Payara Server keeps track of the recently executed SQL statements for monitoring purposes. This way, one can review which SQL statements are executed, how many times the same statement is executed and how long it took.
Activate Overview
The activation of the collection is controlled by the monitoring service.
When using the Web Administration console, go to Configuration → [instance-configuration (like server-config)] → Monitoring: and select the level High for the JDBC Connection pool component.
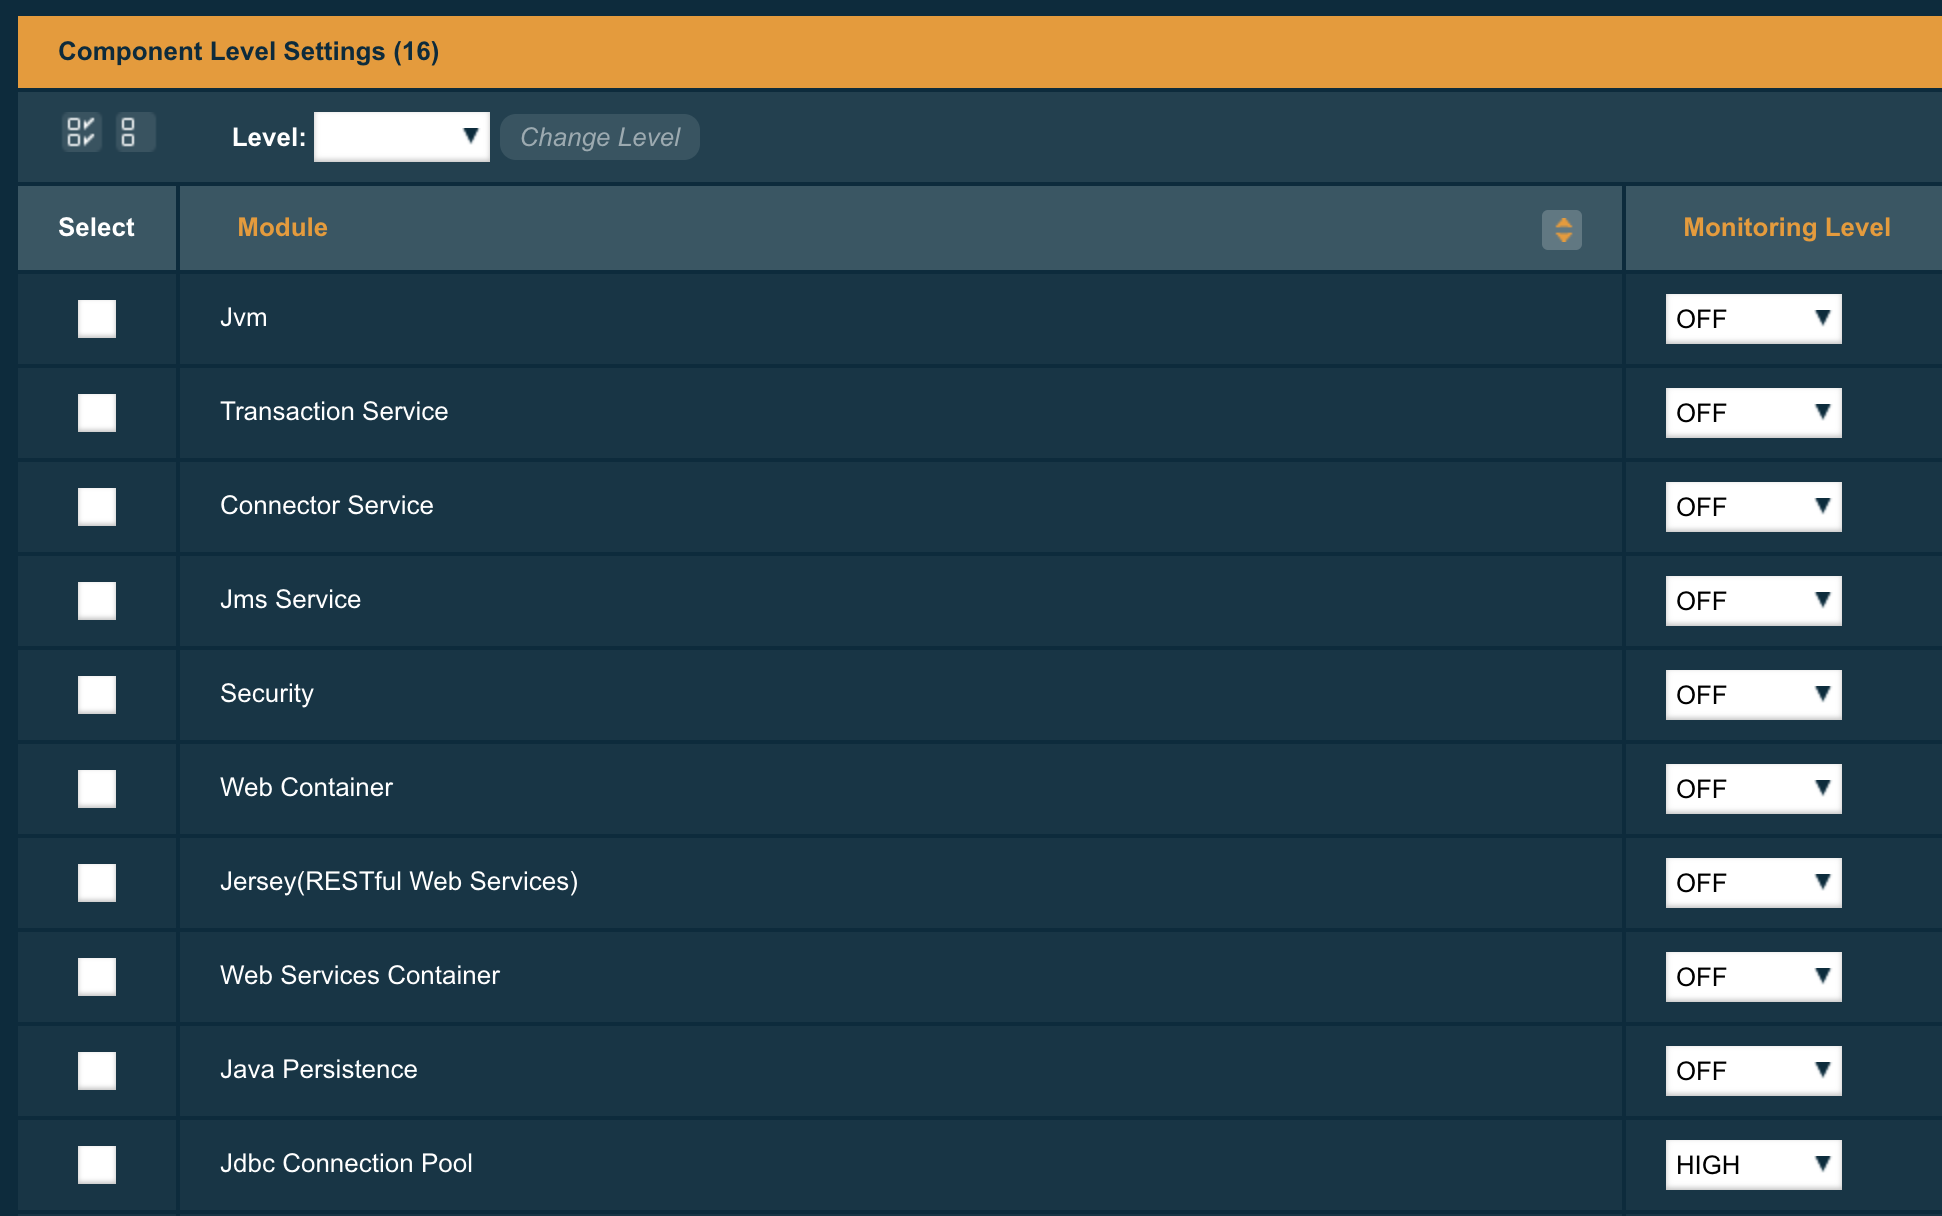
When using the asadmin CLI, you can execute the following command to set the Level Value
set configs.config.server-config.monitoring-service.module-monitoring-levels.jdbc-connection-pool=HIGHThe information can be consulted via the JMX beans or the Rest monitoring interface. These need to be activated also, see jmx monitoring configuration and rest monitoring configuration on how to do this.
Viewing statements
When you want to retrieve the information through the JMX channel, you can find the information in the following MBean:
amx:pp=/mon/server-mon[server],type=jdbcra-mon,name=resources/<pool-name>
When using the Rest monitoring interface, you can access the following URL
http://localhost:4848/monitoring/domain/server/resources/<pool-name>
In both cases, the <pool-name> is the actual pool name you have created within Payara Server and which you like to retrieve the information for.
The properties we want to highlight here are
frequsedsqlqueries-
Contains the list of all SQL statements and their execution count, which are executed during the collection time frame.
slowSqlQueries-
Contains again the list of all SQL statements but this time with the maximum execution time they took.
Configuring parameters
The SQL statement collection has a few configuration values which have default values.
-
Timeframe: By default, the info about the SQL statements are retained during 5 minutes
-
Cache size: The information is kept in a cache which has by default place for 100000 items.
These values can be configured by defining some key-value pairs in the properties for the connection pool. This can be done during the creation or afterward by updating the pool.
-
TIME-TO-KEEP-QUERIES-IN-MINUTES: This defines the number of minutes the SQL statement info is retained.
-
MAX-CACHE-SIZE: This defines the maximum size of the cache.
Setting the maximum size of the cache to 0 will disable it completely.
|
When the cache size is too small, you see an information message in the log to indicate that not all statements could be retained.
Slow SQL Logger
:page-aliases:Technical Documentation/Payara Server Documentation/advanced-jdbc/slow-sql-logger.adoc
Many performance problems in Enterprise Applications can be traced to slow database access. Payara Server includes capabilities to detect and log slow SQL queries executed via a JDBC Connection pool. The Slow SQL logger monitors all queries executed on the connection pool and if they exceed a configurable execution time in seconds a warning message is logged into the server log.
The warning message (see below) logs the SQL query and the stack trace to the code executing the query. This enables rapid diagnosis by pinpointing the exact lines of code to investigate.
Configuring the Slow SQL Logger
Ensure Wrap JDBC Objects is enabled in your JDBC Connection Pool (enabled by default) for the Slow SQL Logger to function correctly.
There are a number of ways to configure the slow SQL threshold time on a JDBC connection pool.
Using the Administration Console
To configure slow SQL logging on a JDBC connection pool via the administration console, navigate to the Connection Pool’s Advanced Properties tab. Then specify the Slow Query Log Threshold time in seconds or use a decimal value to signify milliseconds.
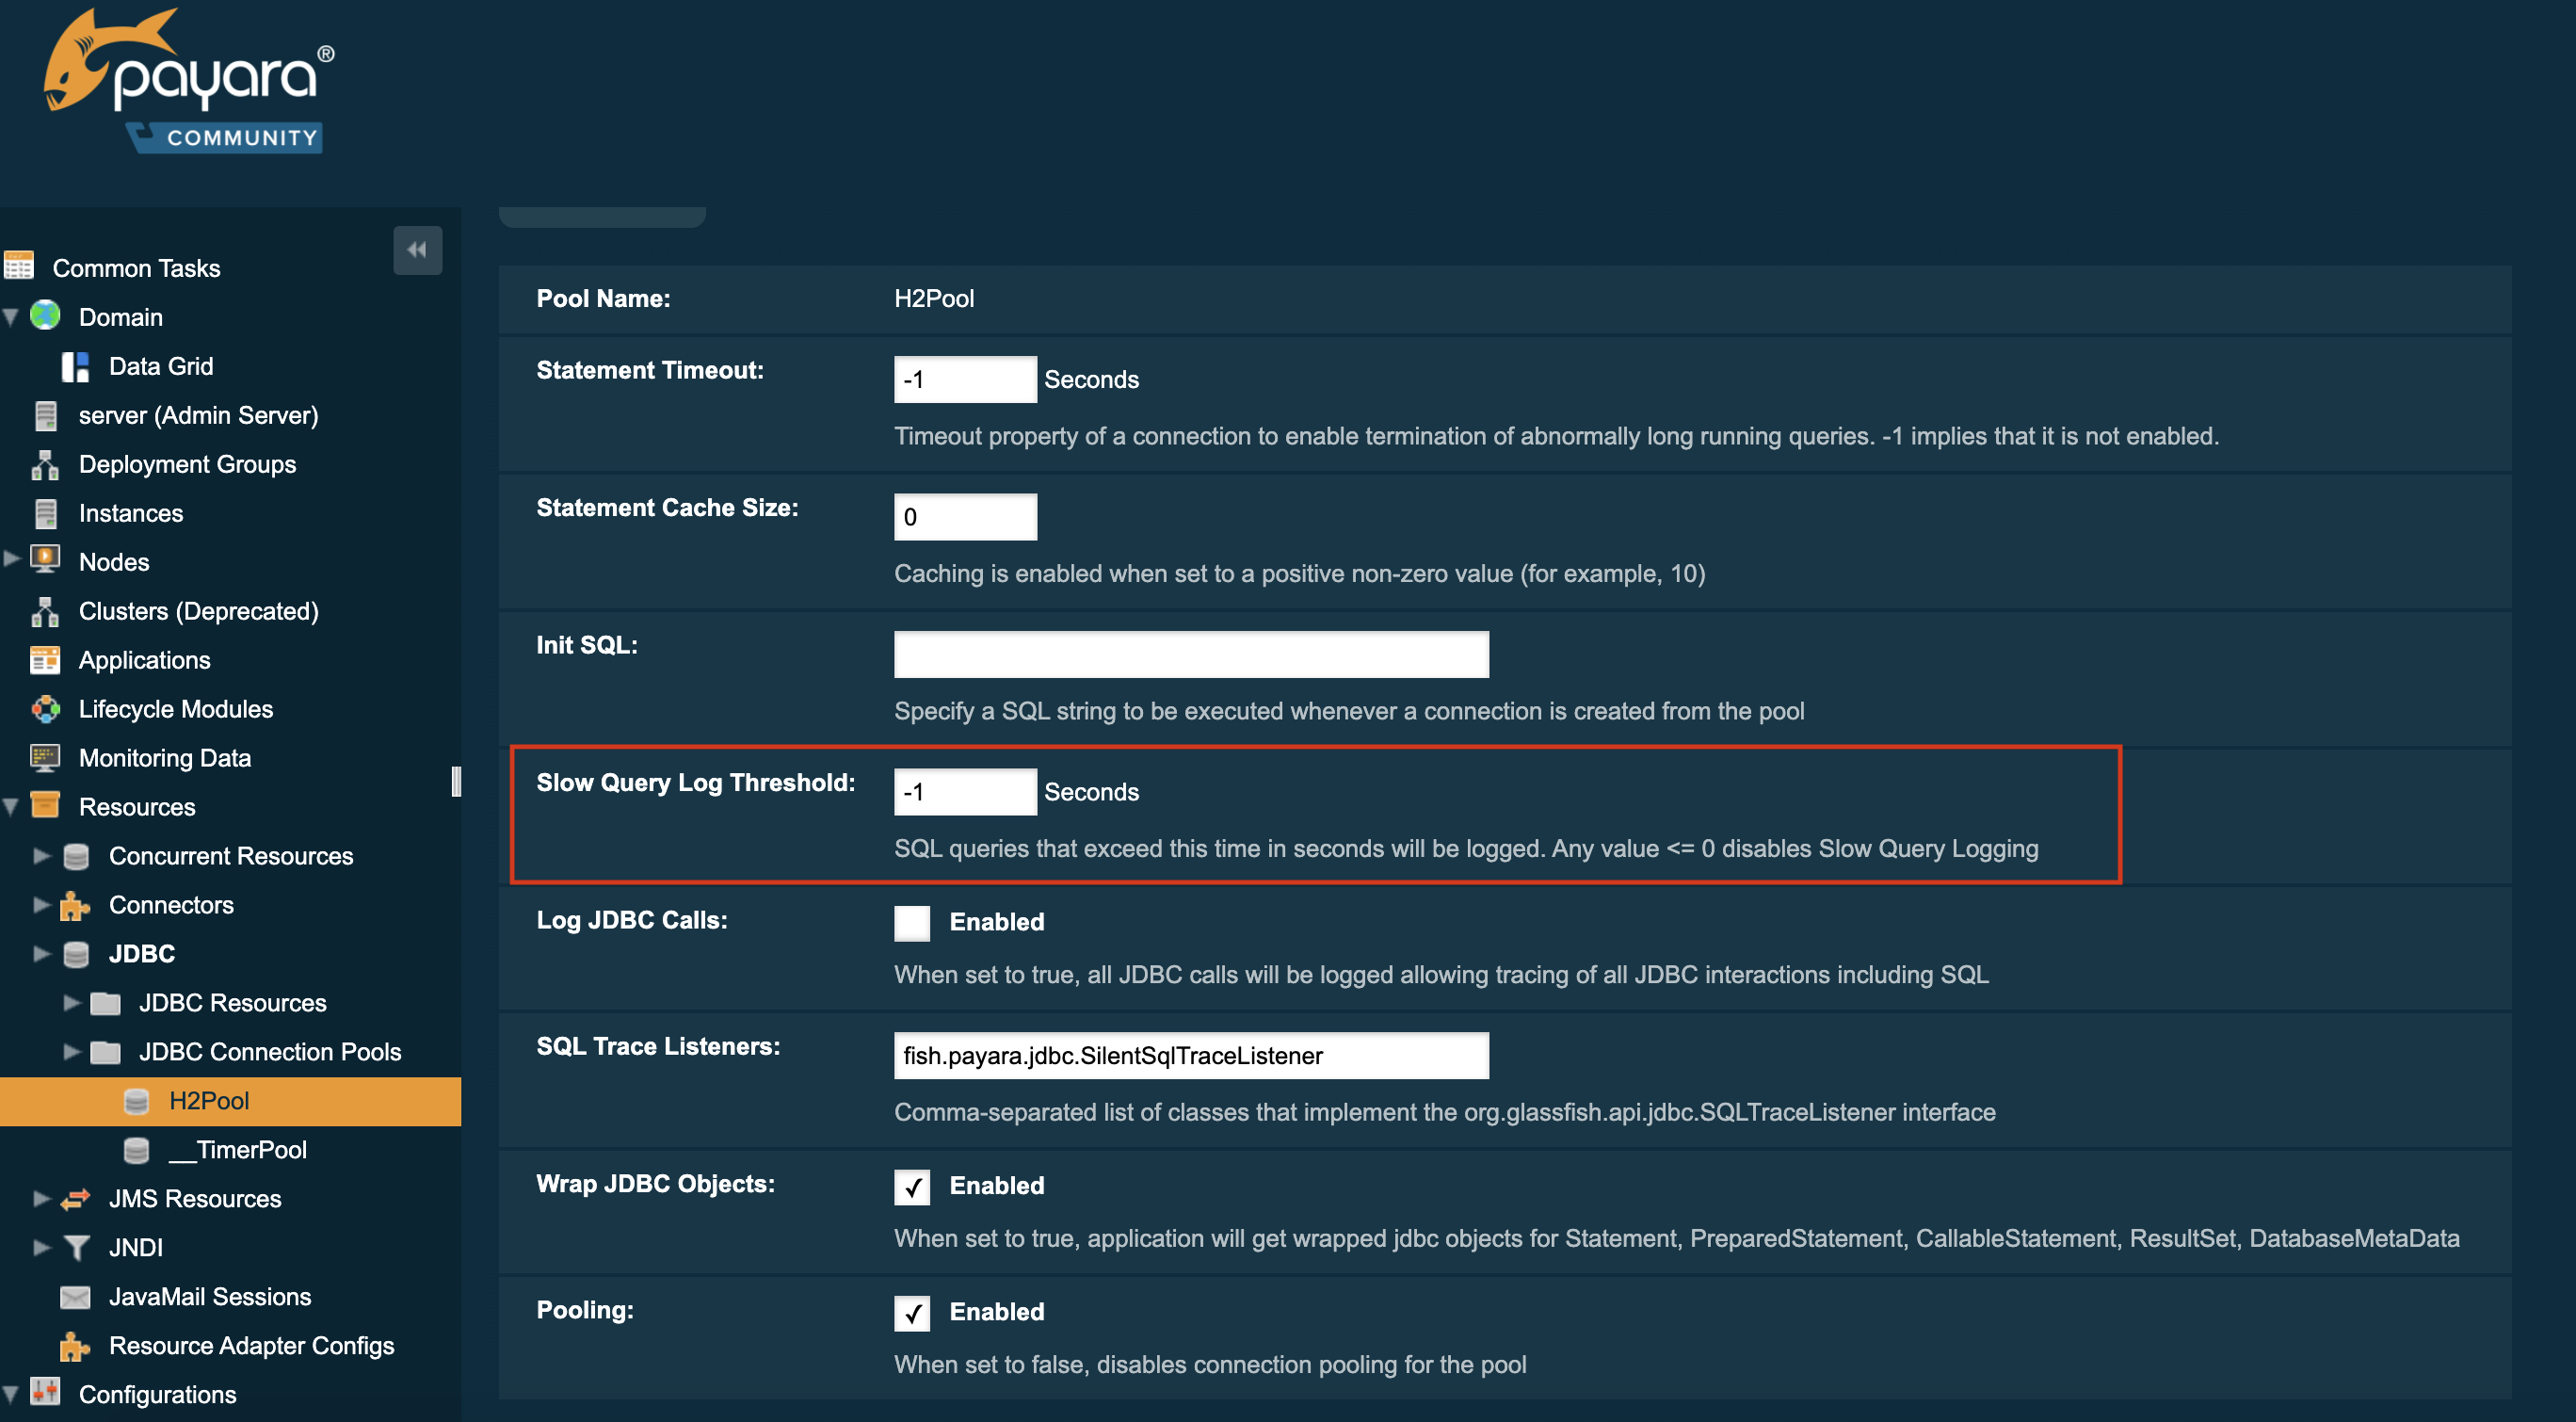
setting the threshold to -1 will disable the feature
|
Using Asadmin commands
The Slow Query Log Threshold time for a JDBC connection pool can also be configured with an asadmin command, by using the set command to set the slow-query-threshold-in-seconds property, like in the following example:
asadmin set domain.resources.jdbc-connection-pool.__TimerPool.slow-query-threshold-in-seconds=50You can also set the threshold time to milliseconds simply by passing a decimal value. Below is an example of setting the threshold on the __TimerPool JDBC connection pool to 200 milliseconds:
asadmin set domain.resources.jdbc-connection-pool.__TimerPool.slow-query-threshold-in-seconds=0.2Application Deployment
In Java EE 7+ applications, a JDBC data source can be deployed by adding the @DataSourceDefinition annotation to a managed component (like and @Stateless EJB bean for example). The Slow Query Log Threshold time can be configured using this annotation, like in the following example:
@DataSourceDefinition(
    name = "java:app/MyApp/MyDS",
    className = "org.h2.jdbcx.JdbcDataSource",
    url = "jdbc:h2:mem:test",
    properties = {"fish.payara.slow-query-threshold-in-seconds=5"})
The Data source definition can also be added to a deployment descriptor of an application, for example in the web.xml standard deployment descriptor:
<data-source>
    <name>java:global/ExampleDataSource</name>
    <class-name>com.mysql.jdbc.jdbc2.optional.MysqlXADataSource</class-name>
    <server-name>localhost</server-name>
    <port-number>3306</port-number>
    <database-name>mysql</database-name>
    <user>test</user>
    <password>test</password>
    <!-- Example of how to use a Payara specific custom connection pool setting -->
    <property>
       <name>fish.payara.slow-query-threshold-in-seconds</name>
       <value>5</value>
    </property>
</data-source>
Example Trace
Below is an example WARNING trace for a slow query recollected from the server’s log:
[#|2016-02-01T22:39:29.289+0000|WARNING|Payara 4.1|javax.enterprise.resource.sqltrace.com.sun.gjc.util|_ThreadID=61;_ThreadName=http-listener-1(2);_TimeMillis=1454366369289;_LevelValue=900;|
  SQL Query Exceeded Threshold Time: 5000(ms): Time Taken: 10000(ms)
Query was SELECT ID, AGE, BIO, BIRTHDATE, BIRTHDAY, DATEFORMAT, DATEOFBIRTH, DATEOFHIRE, EMAIL, HIREDATE, HIREDAY, MEMBERAGE, NAME, TODAYSDATE FROM MEMBERENTITY WHERE (NAME = ?);

java.lang.Exception: Stack Trace shows code path to SQL
    at fish.payara.jdbc.SlowSQLLogger.sqlTrace(SlowSQLLogger.java:123)
    at com.sun.gjc.util.SQLTraceDelegator.sqlTrace(SQLTraceDelegator.java:122)
    at com.sun.gjc.spi.jdbc40.ProfiledConnectionWrapper40$1.invoke(ProfiledConnectionWrapper40.java:448)
    at com.sun.proxy.$Proxy265.executeQuery(Unknown Source)
    at org.eclipse.persistence.internal.databaseaccess.DatabaseAccessor.executeSelect(DatabaseAccessor.java:1009)
    at org.eclipse.persistence.internal.databaseaccess.DatabaseAccessor.basicExecuteCall(DatabaseAccessor.java:644)
    at org.eclipse.persistence.internal.databaseaccess.DatabaseAccessor.executeCall(DatabaseAccessor.java:560)
    at org.eclipse.persistence.internal.sessions.AbstractSession.basicExecuteCall(AbstractSession.java:2055)
    at org.eclipse.persistence.sessions.server.ServerSession.executeCall(ServerSession.java:570)
    at org.eclipse.persistence.internal.queries.DatasourceCallQueryMechanism.executeCall(DatasourceCallQueryMechanism.java:242)
    at org.eclipse.persistence.internal.queries.DatasourceCallQueryMechanism.executeCall(DatasourceCallQueryMechanism.java:228)
    at org.eclipse.persistence.internal.queries.DatasourceCallQueryMechanism.executeSelectCall(DatasourceCallQueryMechanism.java:299)
    at org.eclipse.persistence.internal.queries.DatasourceCallQueryMechanism.selectAllRows(DatasourceCallQueryMechanism.java:694)
    at org.eclipse.persistence.internal.queries.ExpressionQueryMechanism.selectAllRowsFromTable(ExpressionQueryMechanism.java:2740)
    at org.eclipse.persistence.internal.queries.ExpressionQueryMechanism.selectAllRows(ExpressionQueryMechanism.java:2693)
    at org.eclipse.persistence.queries.ReadAllQuery.executeObjectLevelReadQuery(ReadAllQuery.java:559)
    at org.eclipse.persistence.queries.ObjectLevelReadQuery.executeDatabaseQuery(ObjectLevelReadQuery.java:1175)
    at org.eclipse.persistence.queries.DatabaseQuery.execute(DatabaseQuery.java:904)
    at org.eclipse.persistence.queries.ObjectLevelReadQuery.execute(ObjectLevelReadQuery.java:1134)
    at org.eclipse.persistence.queries.ReadAllQuery.execute(ReadAllQuery.java:460)
    at org.eclipse.persistence.queries.ObjectLevelReadQuery.executeInUnitOfWork(ObjectLevelReadQuery.java:1222)
    at org.eclipse.persistence.internal.sessions.UnitOfWorkImpl.internalExecuteQuery(UnitOfWorkImpl.java:2896)
    at org.eclipse.persistence.internal.sessions.AbstractSession.executeQuery(AbstractSession.java:1857)
    at org.eclipse.persistence.internal.sessions.AbstractSession.executeQuery(AbstractSession.java:1839)
    at org.eclipse.persistence.internal.sessions.AbstractSession.executeQuery(AbstractSession.java:1804)
    at org.eclipse.persistence.internal.jpa.QueryImpl.executeReadQuery(QueryImpl.java:258)
    at org.eclipse.persistence.internal.jpa.QueryImpl.getResultList(QueryImpl.java:473)
    at fish.payara.team.info.controllers.MemberSessionBean.getTeamMemberByName(MemberSessionBean.java:35)
SQL Trace Listeners
:page-aliases:Technical Documentation/Payara Server Documentation/advanced-jdbc/sql-trace-listeners.adoc
Payara Server provides support for custom SQL Trace Listeners. A SQL Trace Listener is registered against a data source and is called after each method call made on the JDBC connection pool.
SQL Trace Listeners allows developers to track all calls to the database and can be used to develop custom auditing, error handling or monitoring components. SQL Trace Listeners can be enabled globally on a data source if the class that implements it is on the server’s classpath, or can be enabled on application specific data sources by including them in the application’s WAR or EAR.
SQL Trace listener Interface
The SQL Trace Listener interface is shown below:
public interface SQLTraceListener {
    /**
     * Notify listeners with SQL trace information.
     * @param record SQLTraceRecord that has information related
     * to the SQL operation
     */
    public void sqlTrace(SQLTraceRecord record);

}
To write a custom trace listener you need to implement the interface and override the sqlTrace method. The SQLTraceRecord object contains information about the executed call to the JDBC connection pool. The following is the list of properties that can be queried using their respective getter methods:
    /**
     * Thread ID from which SQL statement originated.
     */
    private long threadID;

    /**
     * Thread Name from which SQL statement originated.
     */
    private String threadName;

    /**
     * Pool Name in which the SQL statement is executed.
     */
    private String poolName;

    /**
     * Type of SQL query. Could be PreparedStatement, CallableStatement or
     * other object types.
     */
    private String className;

    /**
     * Method that executed the query.
     */
    private String methodName;

    /**
     * Time of execution of query.
     */
    private long timeStamp;

    /**
     * Parameters of the method that executed the SQL query. Includes information
     * like SQL query, arguments and so on.
     */
    private Object[] params;
SQL Trace Listener Example
The following code fragment illustrates an example SQL trace listener that just logs the executed call to the server’s log file:
public class SQLTraceLogger implements SQLTraceListener {

    private static Logger _logger = initLogger();

    private static Logger initLogger() {
        _logger = LogDomains.getLogger(SQLTraceLogger.class, LogDomains.SQL_TRACE_LOGGER);
        return _logger;
    }

    public SQLTraceLogger() {
    }

    public void sqlTrace(SQLTraceRecord record) {
        _logger.log(Level.FINE, record.toString());
    }
}
Configuring SQL Trace Listeners
Using the Administration Console
SQL Trace Listeners can be enabled on a JDBC connection pool through the administration web console. Navigate to the Advanced Tab of your connection pool by selecting the JDBC → JDBC Connection Pools → <Your Connection pool>.
Proceed to add the fully qualified class name of your SQL Trace Listener implementation class in the SQL Trace Listeners field:
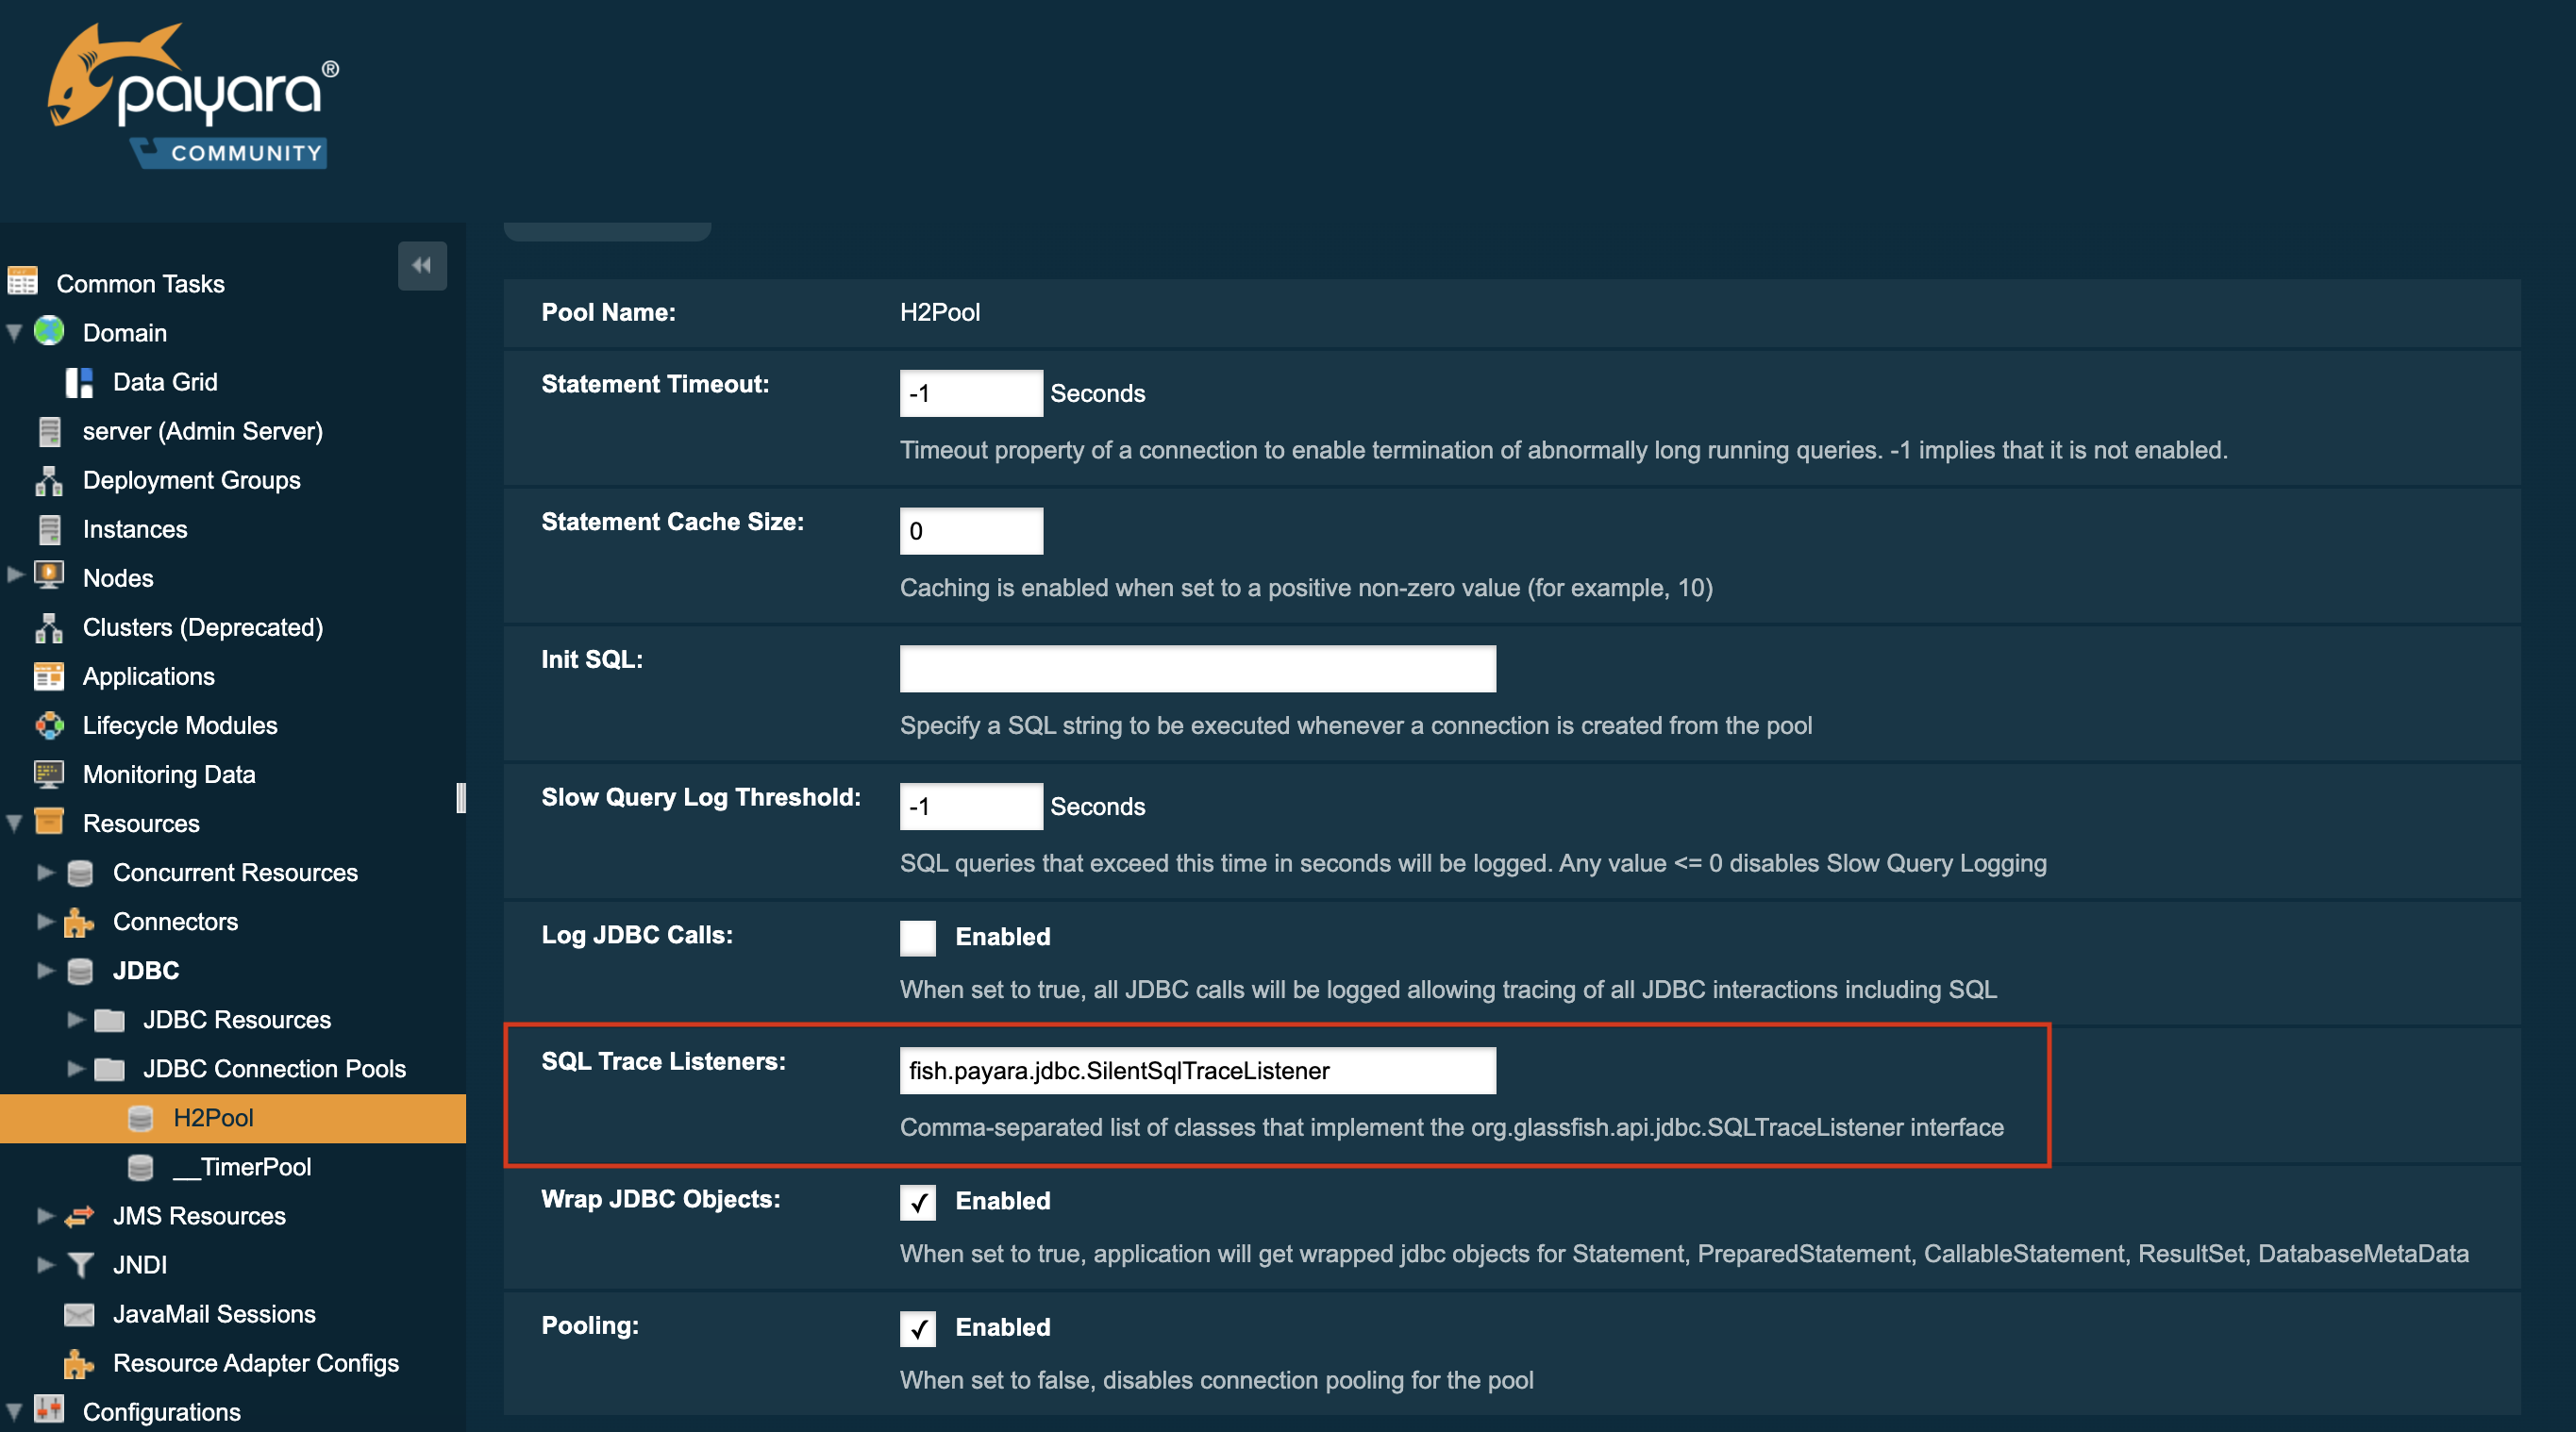
| The implementation class must be on the server’s classpath for it to work correctly |
Using asadmin commands
SQL Trace Listeners can be enabled on a JDBC connection pool using with an asadmin commands by using the set command to set the fish.payara.lsql-trace-listeners to the fully qualified class name of your listener implementation, like on the following example:
asadmin set domain.resources.jdbc-connection-pool.__TimerPool.sql-trace-listeners=fish.payara.examples.payaramicro.datasource.example.CustomSQLTracerApplication Deployment
In Java EE 7+ applications, a JDBC data source can be deployed by adding the @DataSourceDefinition annotation to a managed component (like and @Stateless EJB bean for example). SQL Trace Listener classes can be configured using this annotation, like in the following example:
@DataSourceDefinition(
    name = "java:app/MyApp/MyDS",
    className = "org.h2.jdbcx.JdbcDataSource",
    url = "jdbc:h2:mem:test",
    properties = {"fish.payara.sql-trace-listeners=fish.payara.examples.payaramicro.datasource.example.CustomSQLTracer"})
The data source definition can also be added to a deployment descriptor of an application, for example in the web.xml standard deployment descriptor:
<data-source>
    <name>java:global/ExampleDataSource</name>
    <class-name>com.mysql.jdbc.jdbc2.optional.MysqlXADataSource</class-name>
    <server-name>localhost</server-name>
    <port-number>3306</port-number>
    <database-name>mysql</database-name>
    <user>test</user>
    <password>test</password>
    <!-- Example of how to use a Payara specific custom connection pool setting -->
    <property>
       <name>fish.payara.sql-trace-listeners</name>
       <value>fish.payara.examples.payaramicro.datasource.example.CustomSQLTracer</value>
    </property>
</data-source>