New Relic is an application performance monitoring (APM) tool that can be used to gather statistics and notify on key critical events generated by different type of applications. New Relic specializes on integrating Java application servers like GlassFish, JBoss WildFly, etc. and other application frameworks seamlessly.
Payara Server includes a special notifier to send notifications from the Notification service to the New Relic Insights service using its remote API.
New Relic Configuration
In order for the notifier to work correctly, you must complete the following requirements:
-
Create a New Relic user account. You can signup for a new account here
New Relic offers 14-days trial accounts that can be used to test the service for free. -
Configure application performance monitoring (APM) for a Payara Server instance by installing a New Relic Java agent
-
Configure a New Relic Insights API key that will be used to setup the notifier.
Configure Application Performance Monitoring for Payara Server
The first task is to set up the New Relic Java agent in Payara Server. To do that, follow these steps:
-
Login to New Relic with your account credentials, and if you haven’t setup a monitoring agent yet, the following screen will be shown:
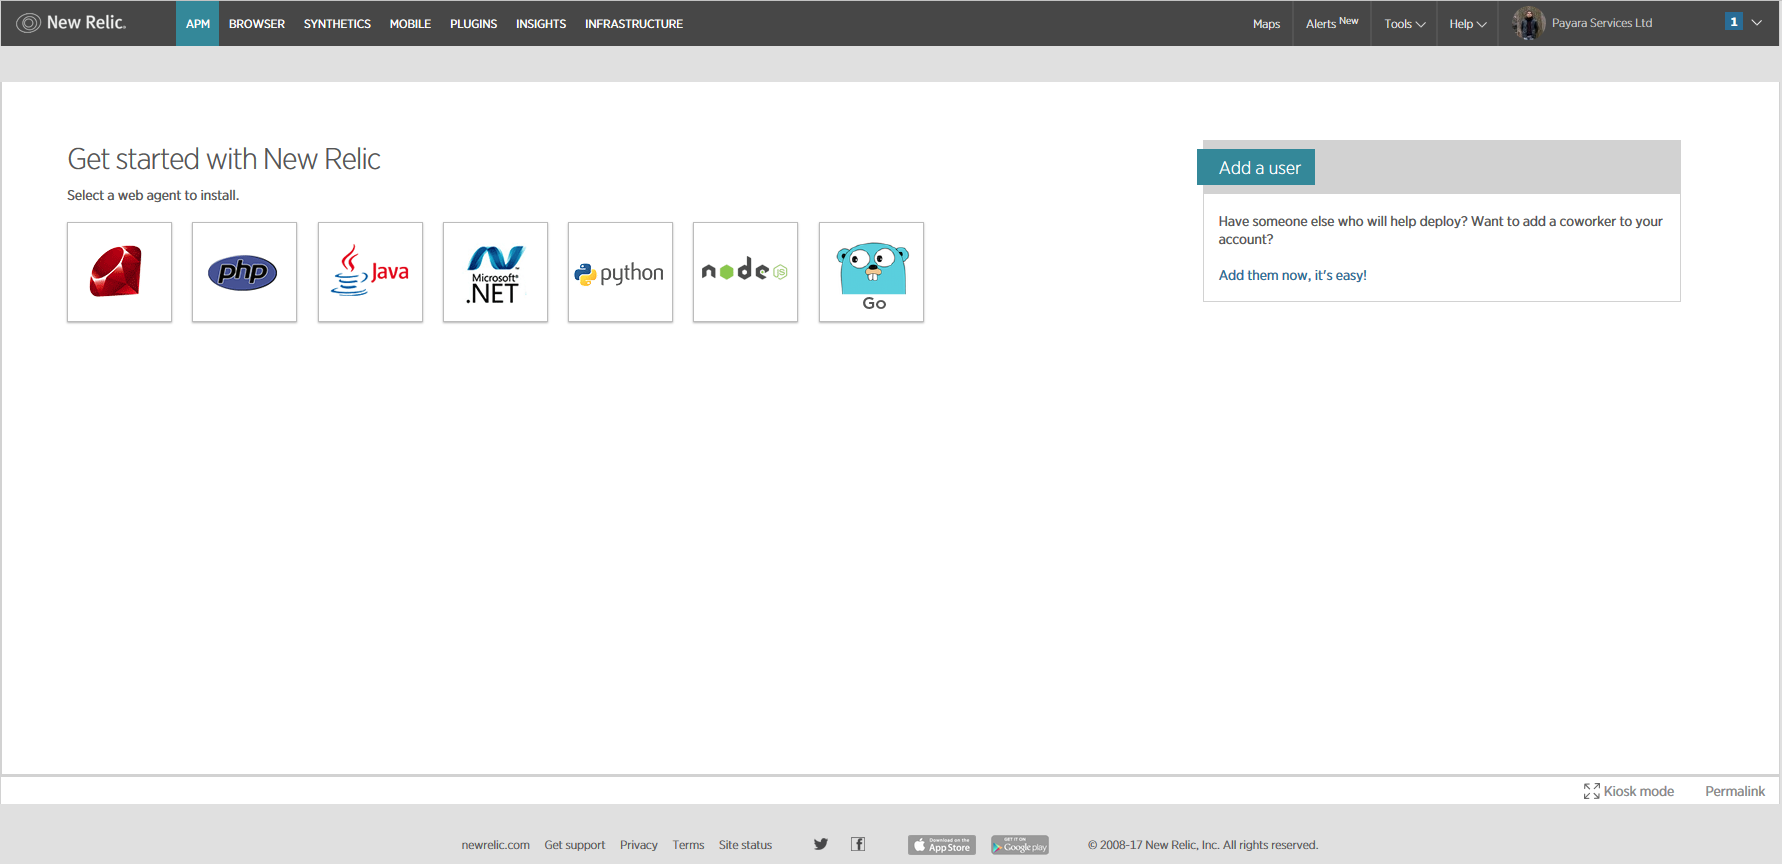
-
Select the Java option and the agent installation procedure will be shown:
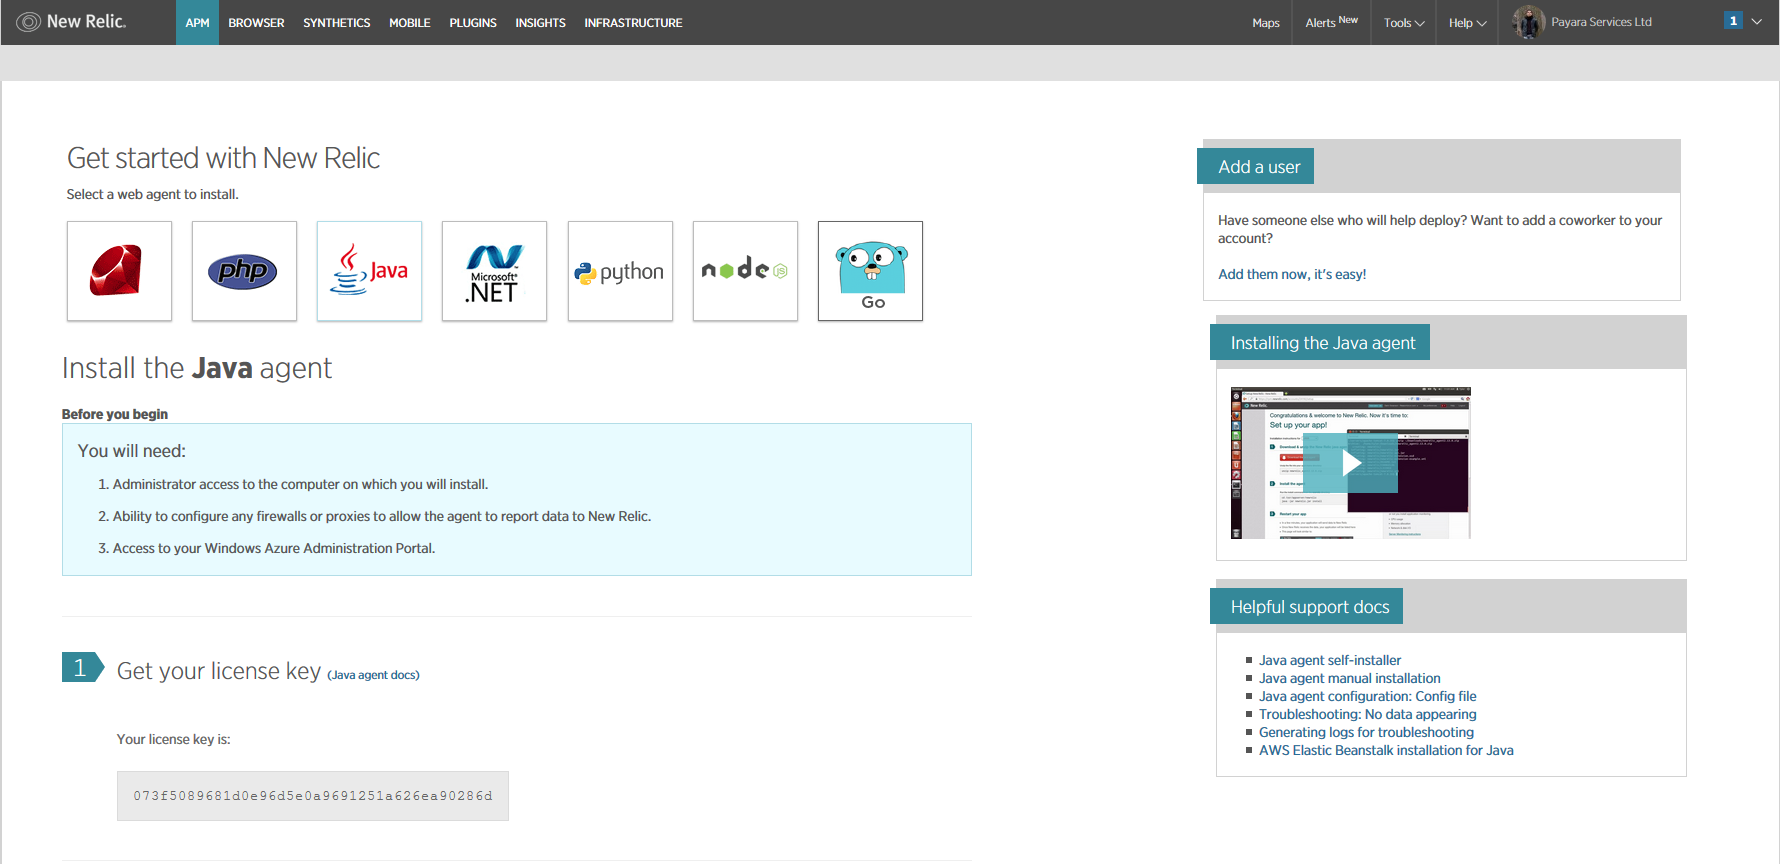
From the screen shown, copy the value of the License Key (you need to press the Reveal License Key button first) since you will need it later.
-
Now, on the same screen press the Download the Java Agent. This will download the Java agent files to your station. Unzip the files and copy the resulting folder to the root folder of the Payara Server domain you want to monitor. In the following example we are copying it to the default domain
domain1:unzip newrelic-java-3.XX.X.zip mv newrelic ${PAYARA_INSTALL_DIR}/glassfish/domains/domain1 -
Before proceeding to install the agent into the Payara Server domain, we need to configure the License Key we got earlier. To do this, modify the agent’s configuration file that’s located at ${PAYARA_DOMAIN_DIR}/newrelic/newrelic.yml by using the
license_keyproperty:# ... # This section is for settings common to all environments. # Do not add anything above this next line. common: &default_settings # ============================== LICENSE KEY =============================== # You must specify the license key associated with your New Relic # account. ... license_key: '073f5089681d0e96d5e0a9691251a626ea90286d' # Agent Enabled # Use this setting to disable the agent instead of removing it from the startup command. # Default is true. agent_enabled: true # Set the name of your application as you'd like it to show up in New Relic. # ... app_name: Payara Server w/ APM # ...We also recommend setting the name of the application under the app_nameproperty to correctly identify this server’s domain on the APM dashboardThe License Key value must be inserted using single quotes (') -
Now, proceed to install the agent by running the following command at the root of the domain folder:
java -jar newrelic/newrelic.jar installIf the installation was successful, the output of the agent’s installer will show it like this:
***** ( ( o))  New Relic Java Agent Installer
***** Installing version 3.39.1 ...

* Backed up start script to /opt/payara-4.1.2.172/glassfish/domains/domain1/config/domain.xml.20170613_180108
* Added agent switch to start script /opt/payara-4.1.2.172/glassfish/domains/domain1/config/domain.xml

* No need to create New Relic configuration file because:
 A config file already exists: /opt/payara-4.1.2.172/glassfish/domains/domain1/newrelic/newrelic.yml

***** Install successful

***** Next steps:
You're almost done! To see performance data for your app:

1) Restart your app server
2) Exercise your app
3) Log into http://rpm.newrelic.com

Within two minutes, your app should show up, ready to monitor and troubleshoot.
If app data doesn't appear, check newrelic/logs/newrelic_agent.log for errors.
The installer will modify the domain.xml configuration file of your server’s domain and add the configuration of the Java agent as a JVM start argument:
<java-config classpath-suffix="" debug-options="-agentlib:jdwp=transport=dt_socket,server=y,suspend=n,address=9009" system-classpath="">
  <jvm-options>-javaagent:${com.sun.aas.instanceRoot}/newrelic/newrelic.jar</jvm-options>
  <jvm-options>-server</jvm-options>
</java-config>
The agent setup page has a different set of instructions for Windows and Linux environments, but they are so similar that the instructions mentioned here should be sufficient. If you are considering installing the New Relic Java agent on a Payara Server standalone instance or a cluster of multiple instances, you need to manually add the JVM (the installer won’t work) option with the javaagentconfiguration to the instance/cluster referenced configuration. Also, make sure that the directory where the newrelic.jar resides also contains the newrelic.yml configuration file -
Now that the agent has been installed, start the Payara Server domain. You will observe the following messages at the start of the domain’s log
INFO: New Relic Agent: Loading configuration file "/opt/payara/glassfish/domains/domain1/newrelic/newrelic.yml" INFO: New Relic Agent: Writing to log file: /opt/payara/glassfish/domains/domain1/newrelic/logs/newrelic_agent.log ... -
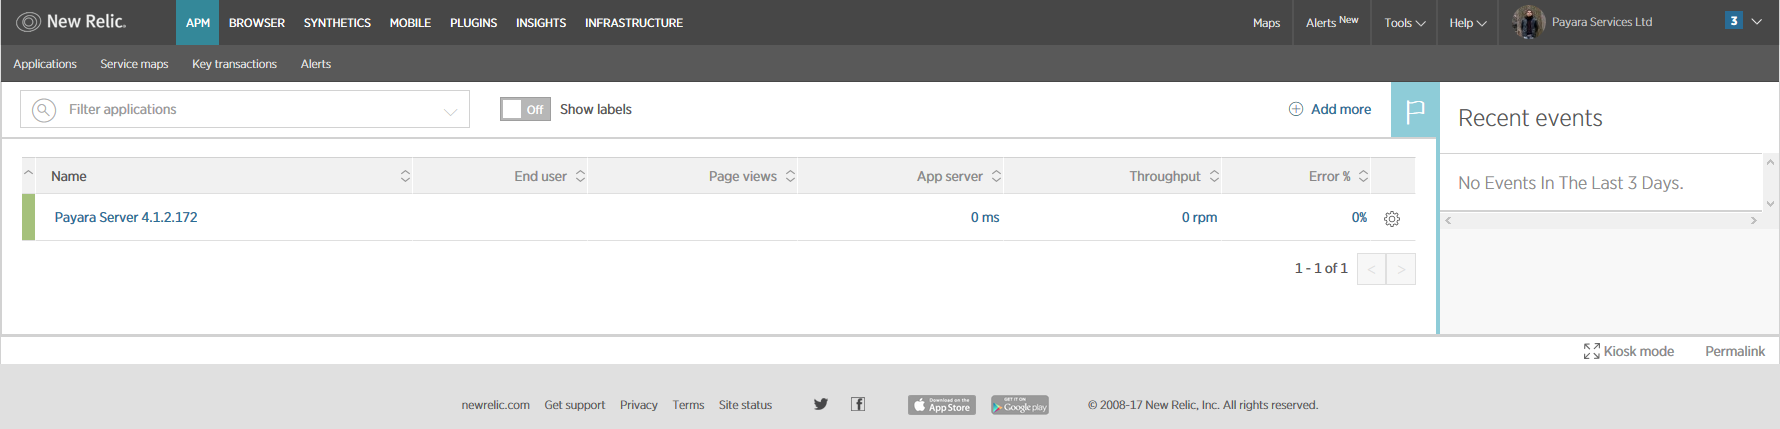
After some minutes with the server working, you can login back to the New Relic portal and on the APM dashboard you can see a new entry for recently configured server:
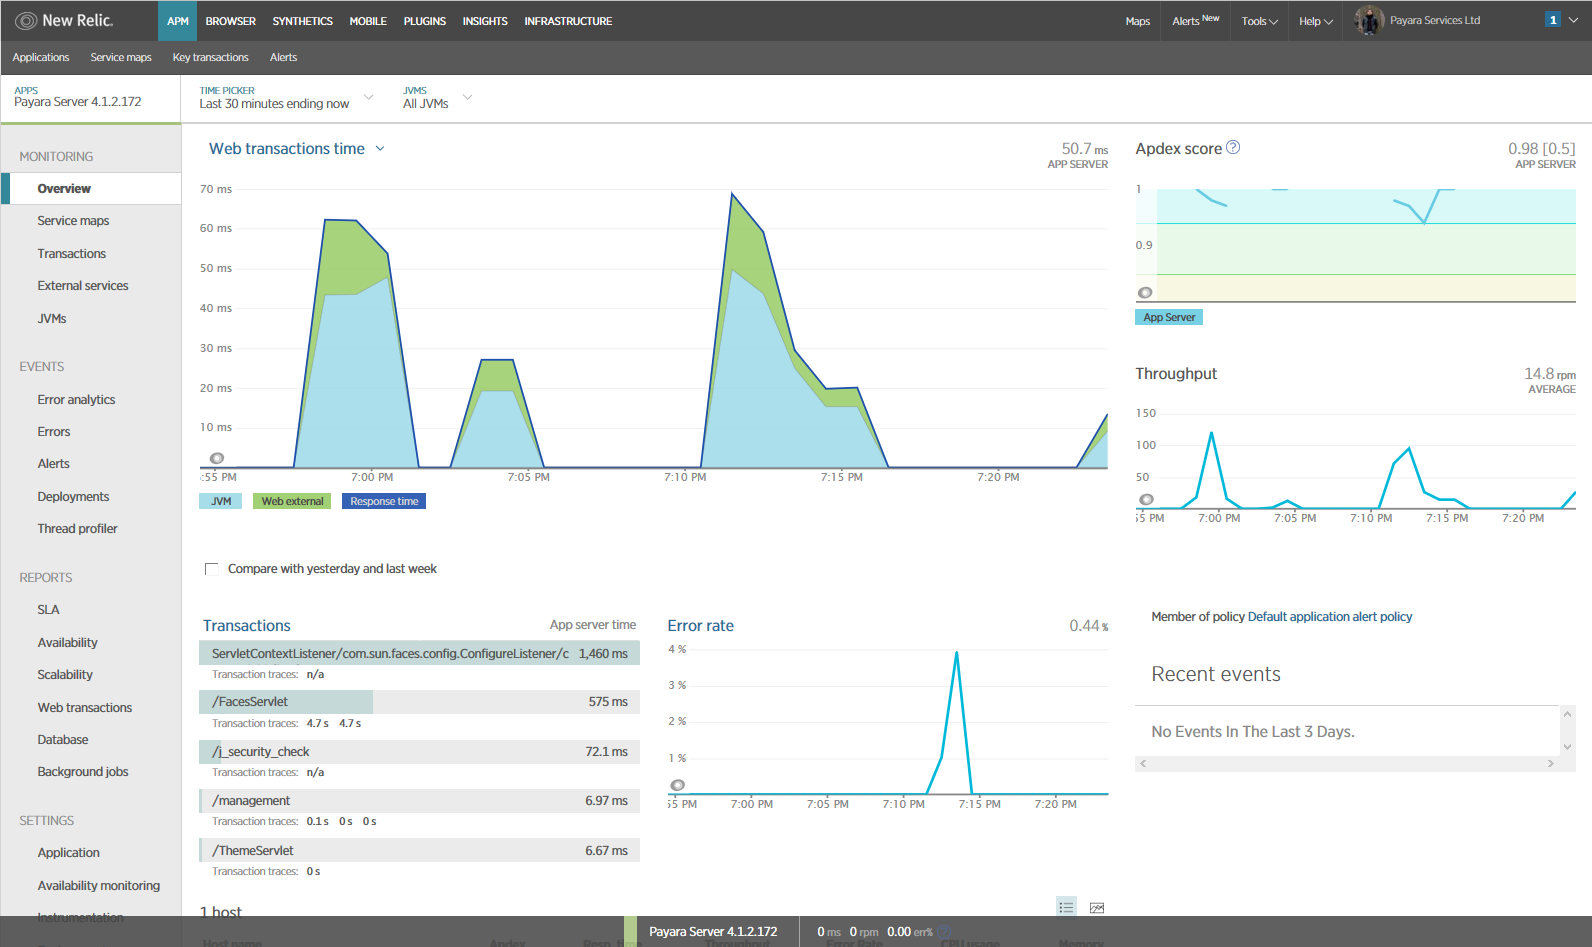
You can also access the latest monitoring statistics:
Retrieving the API Key from New Relic Insights
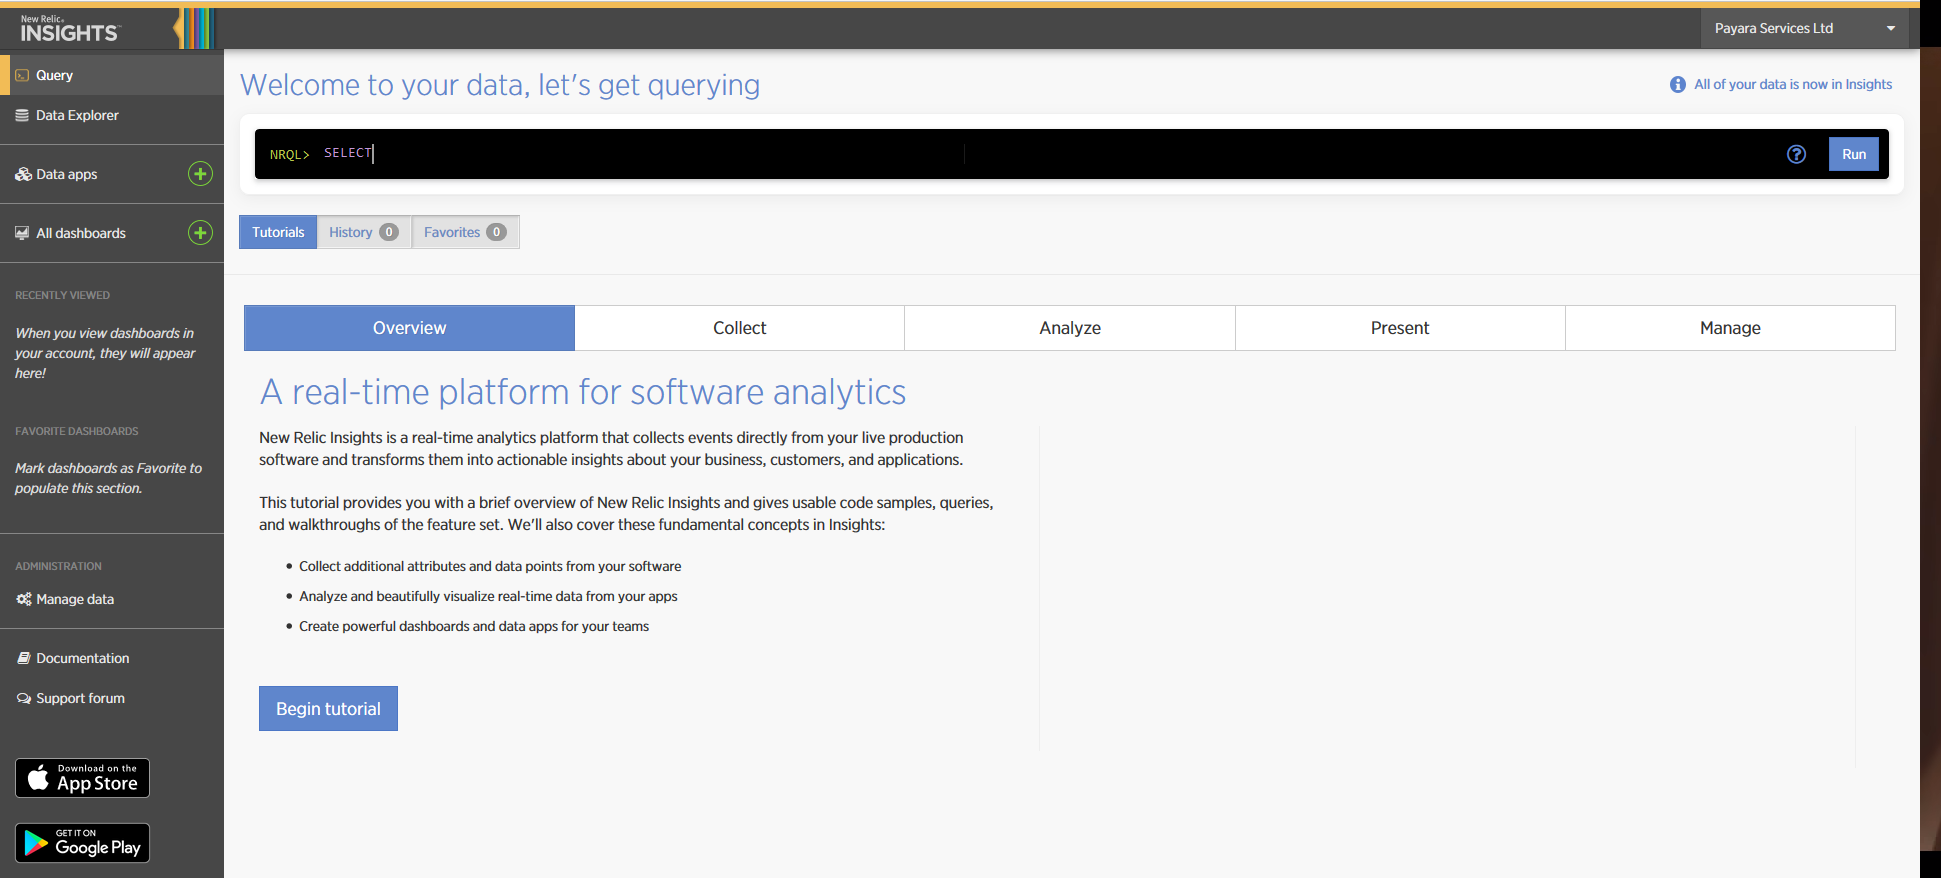
Now that the agent has been correctly installed, login back to your New Relic account portal and head to the Insights dashboard:
Access the Manage Data option on the side menu, you will be presented the following screen:
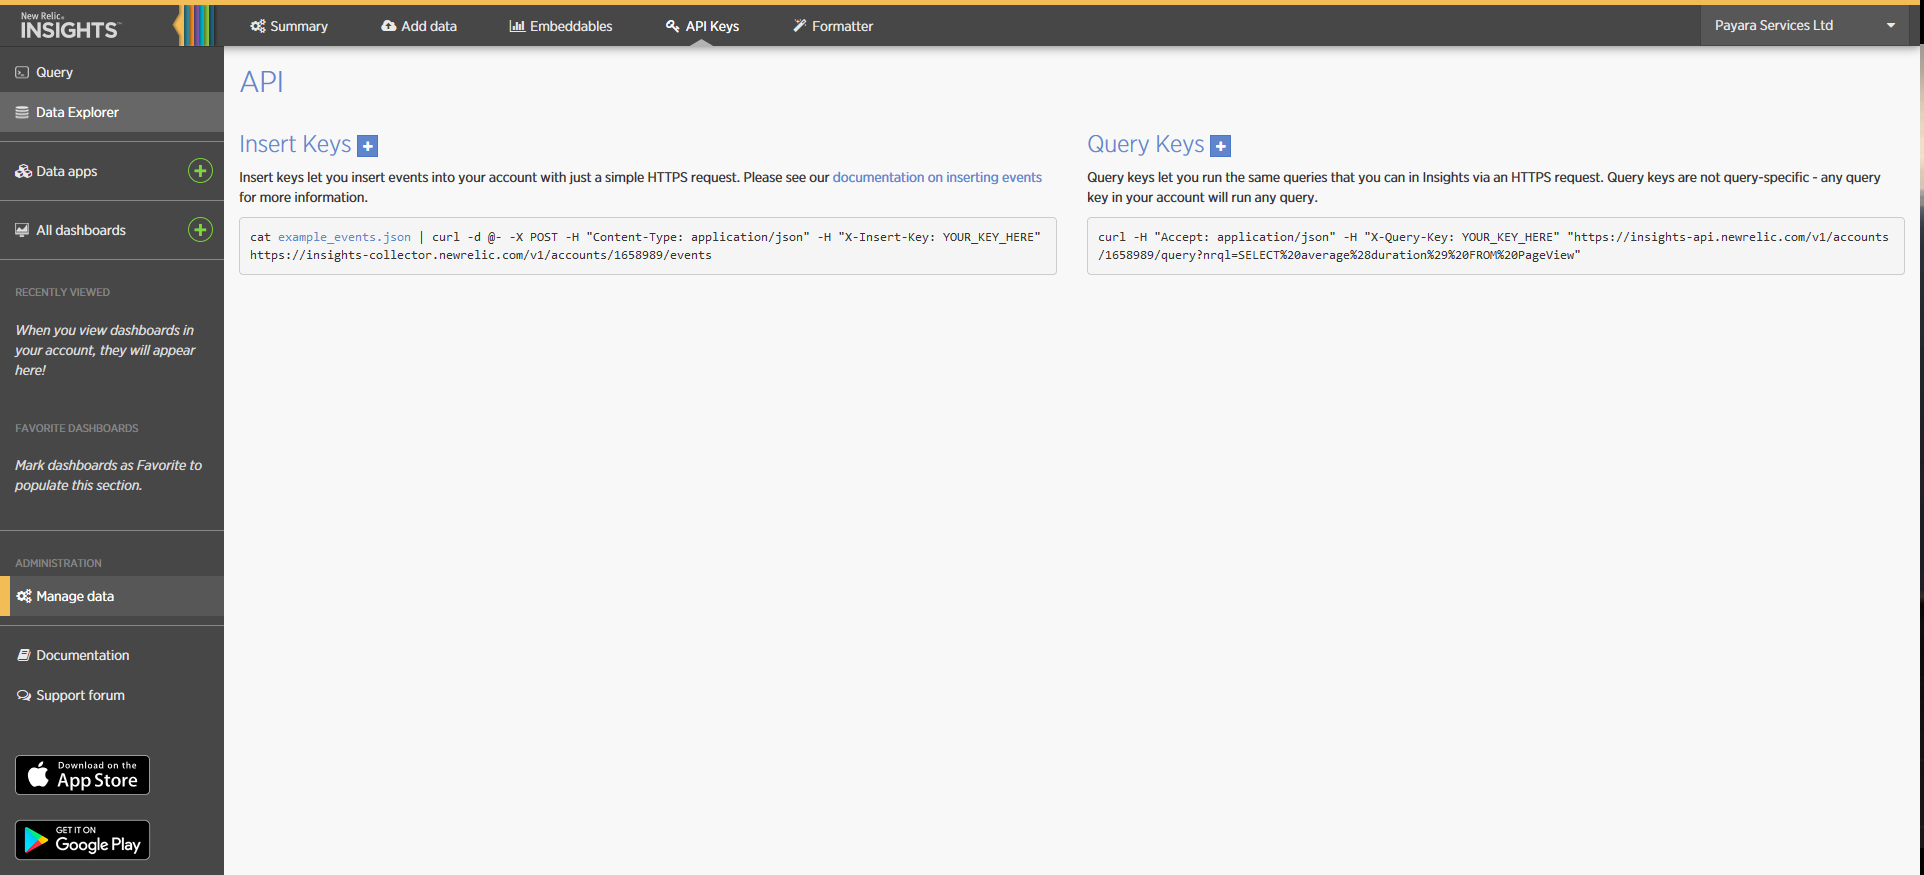
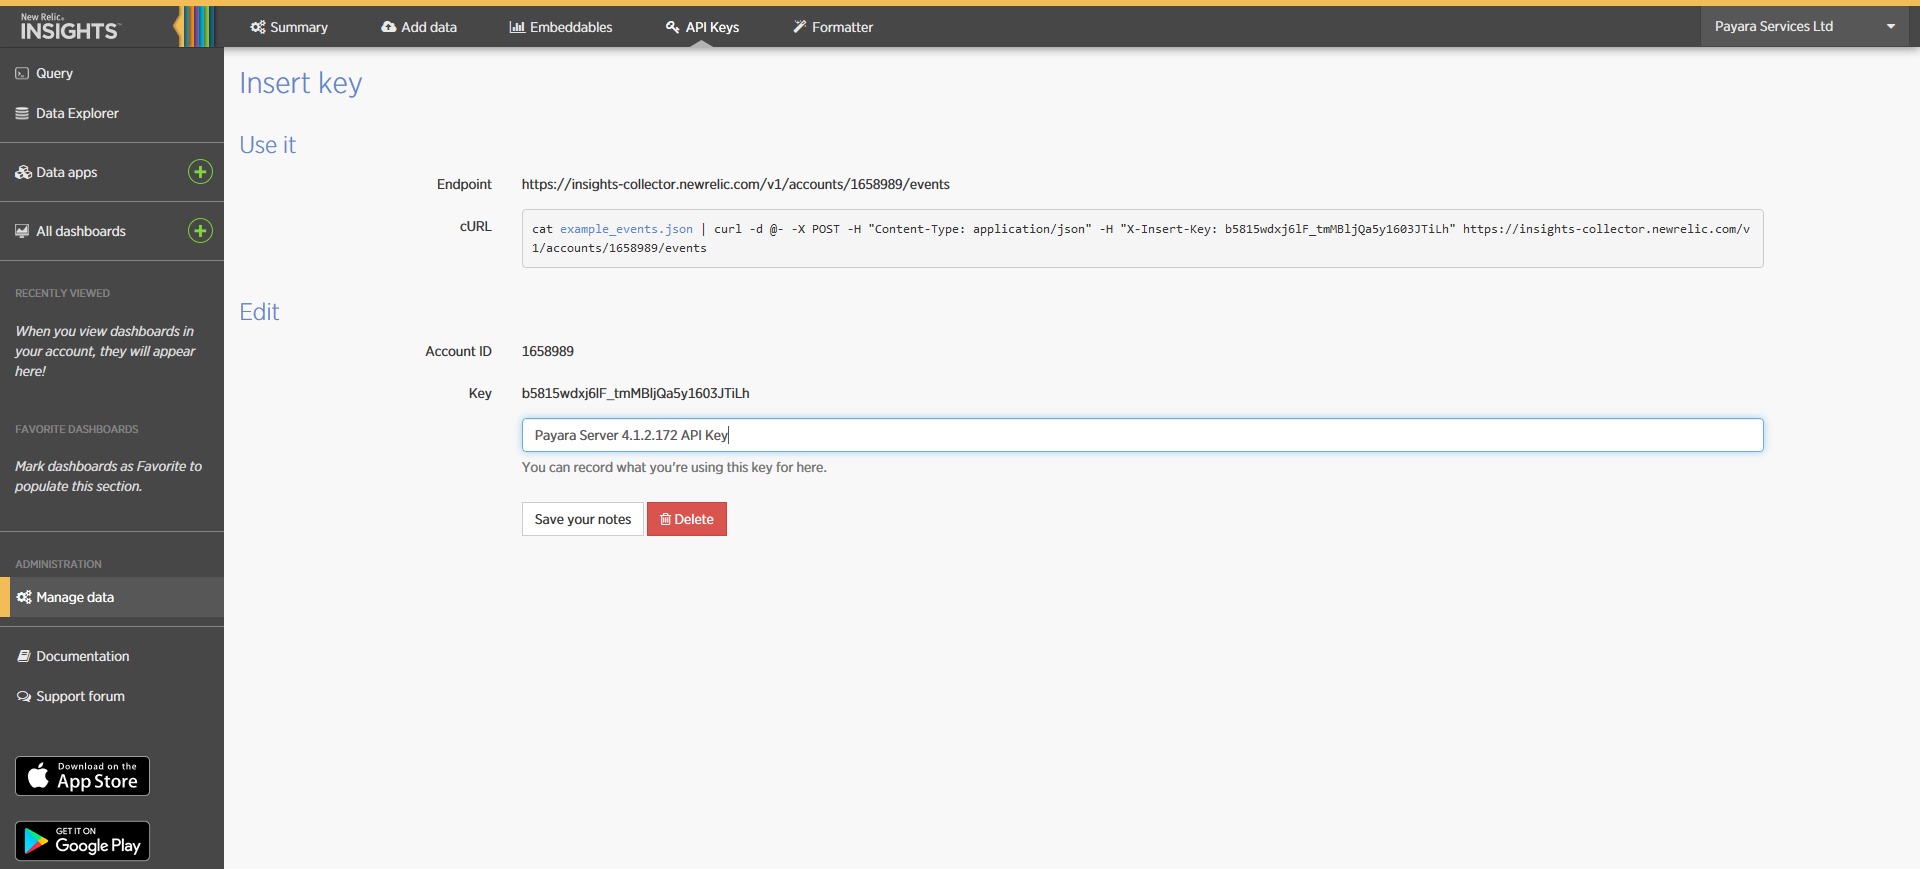
Click on the + icon at the side of the Insert Keys header. Take note of the Account ID and API Key value on this screen. Also add a brief description to reference this key on the dashboard:
Payara Server Configuration
With the New Relic Java agent and Insights API Key correctly configured, you can proceed to configure the New Relic notifier on the Payara Server domain.
Using the Admin Console
To configure the Notification Service in the Admin Console, go to Configuration → [instance-configuration (like server-config)] → Notification Service and click on the New Relic tab:
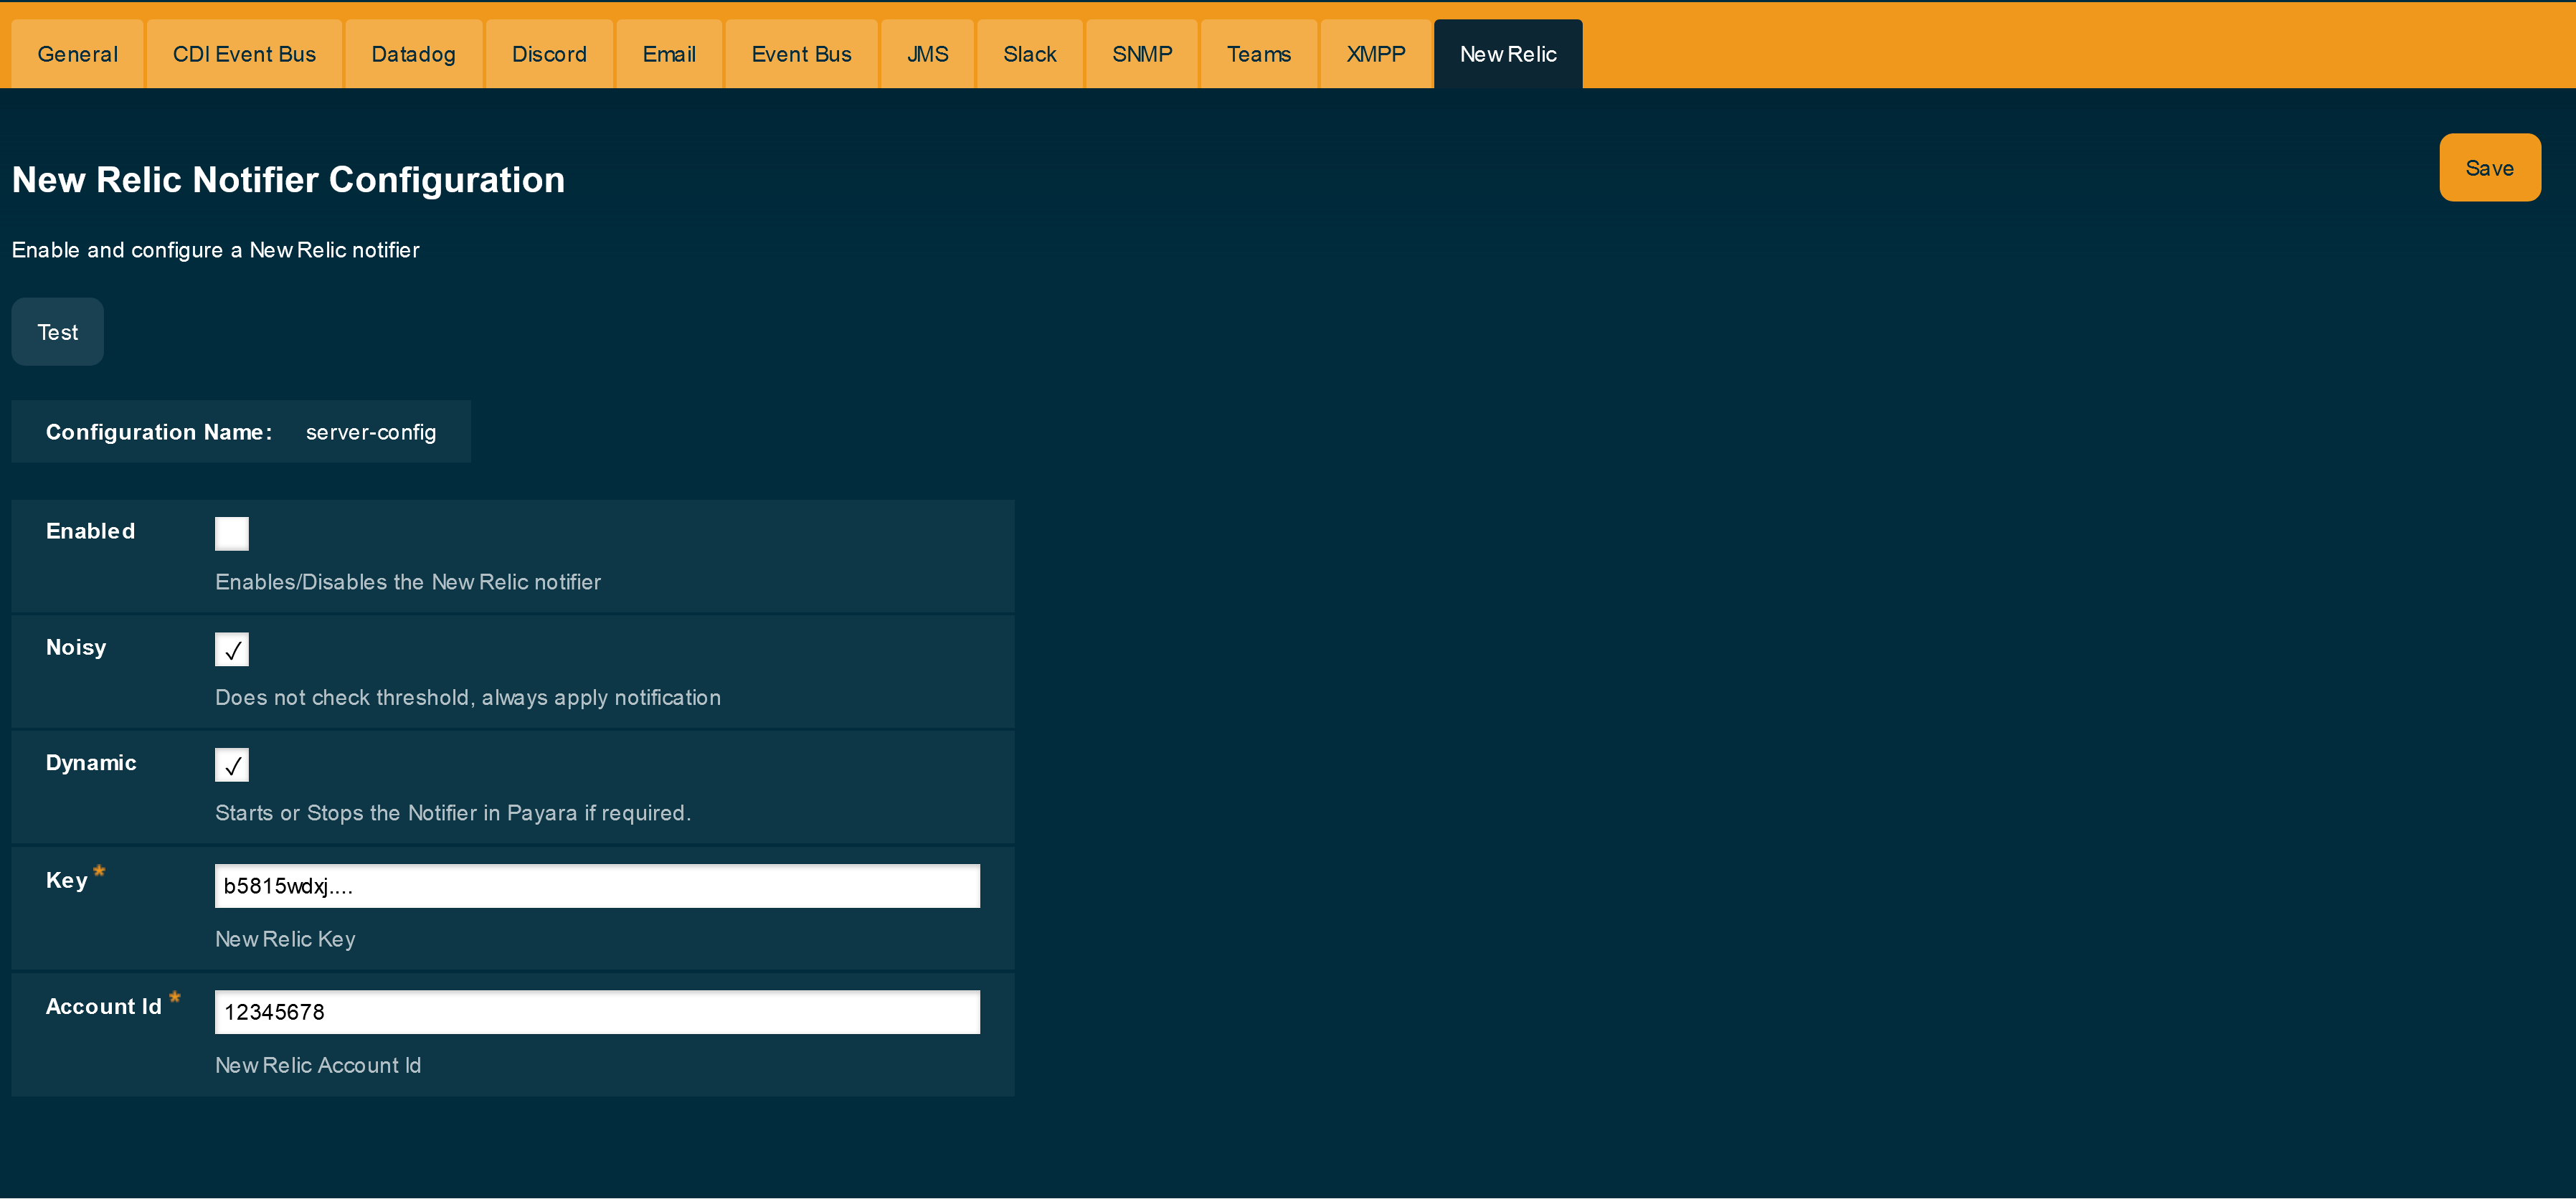
Check the Enabled box (and the Dynamic box too if you don’t want to restart the domain) and input the New Relic Account ID and the newly inserted Insights API Key. Hit the Save button to preserve the changes.
Using the Asadmin CLI
To configure the Notification Service from the command line, use the set-newrelic-notifier-configuration asadmin command, specifying the tokens like this:
asadmin> set-newrelic-notifier-configuration --dynamic=true --enabled=true --accountId=1658989 --key=b5815wdxj6lF_tmMBljQa5y1603JTiLhYou can use the --enabled and --dynamic options to enable or disable the New Relic notifier on demand.
Also, you can retrieve the current configuration for the New Relic notifier using the get-newrelic-notifier-configuration asadmin command like this:
asadmin > get-newrelic-notifier-configuration

Enabled  Noisy  Key                               Account Id
true     true   b5815wdxj6lF_tmMBljQa5y1603JTiLh  1658989
Troubleshooting
When you have correctly configured the New Relic notifier, it can be used observe notification events on the New Relic Insights service dashboard. If you do not see any notification event messages on the data explorer, check the following:
-
Is the New Relic notifier enabled?
-
Is the Notification Service itself enabled?
-
Is there a service configured to use the notifier? (e.g. the HealthCheck service)
-
Is the service configured to send notifications frequently enough to observe?
-
Have you enabled the service after configuring it?
-
Is the Java Agent for your Payara Server’s domain correctly configured?
-
Have you created a valid API Key for the Insights service?
-
Does your account ID and the Insights API key match the ones configured on the Payara Server notifier?
Here’s a sample of how these notifications are visualized on the Data Explorer dashboard for the New Relic Insights service:
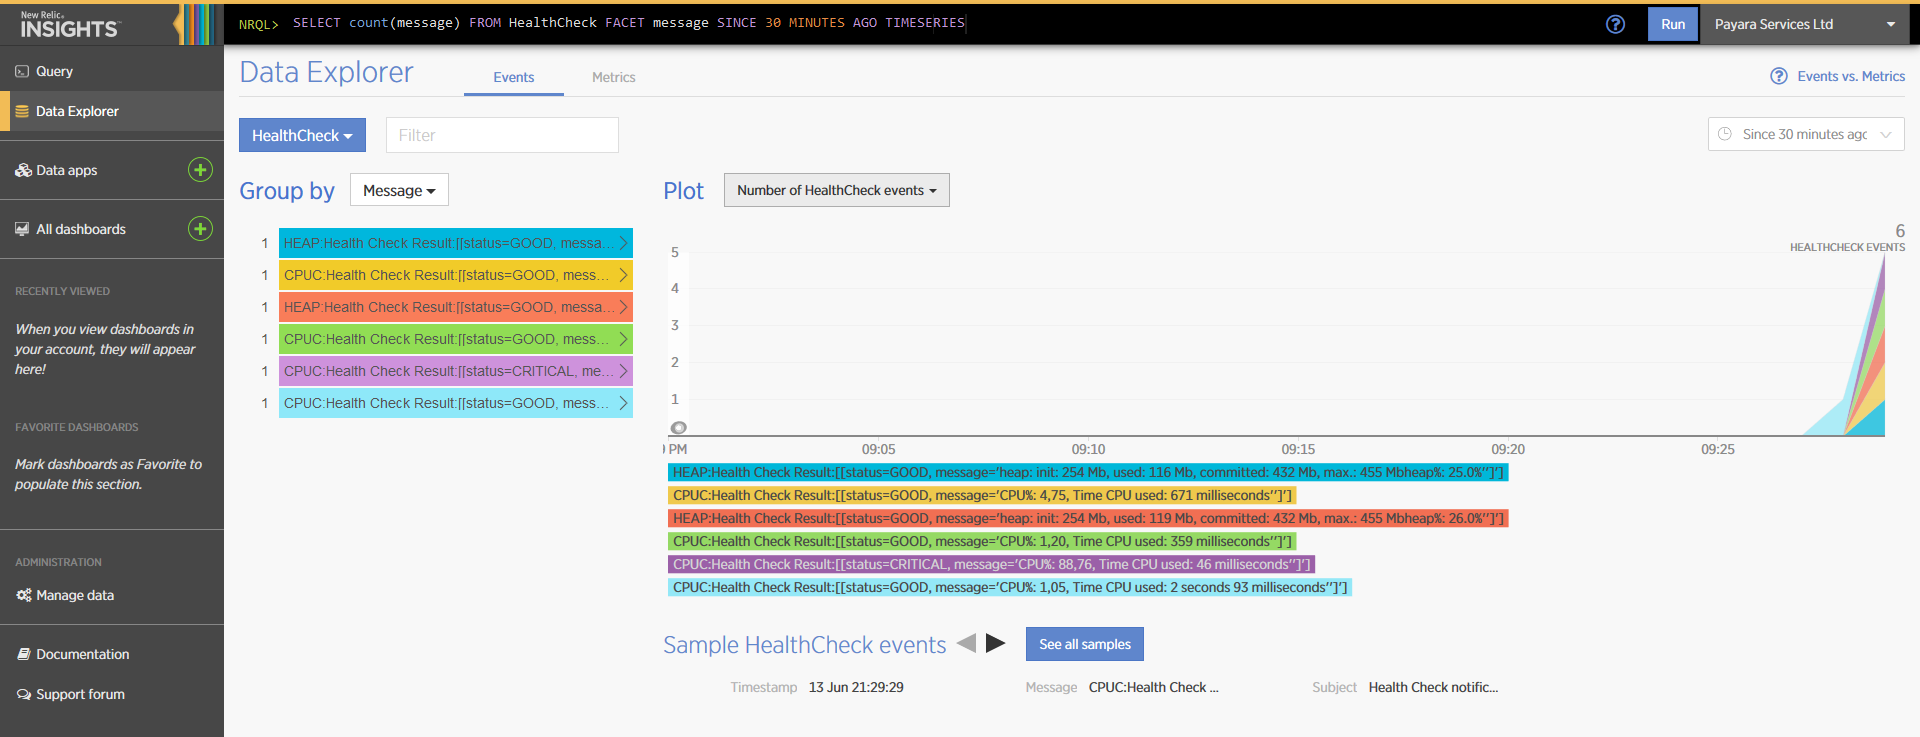
You can observe that the events are correctly identified depending on the severity of the notification and they are correctly grouped by their custom category (in the image only the Healthcheck events are shown).