Payara Server includes a HealthCheck Service that is disabled by default. When enabled it can periodically check the following performance metrics:
-
Host CPU Usage
-
Host Memory Usage
-
Payara Server’s JVM Garbage Collections
-
Payara Server’s JVM Heap Usage
-
CPU Usage of individual threads
-
Detects stuck threads
-
Monitors metrics exposed by MicroProfile Metrics
If there is a problem with any of these metrics and they exceed a configurable threshold then a GOOD, WARNING or CRITICAL event notification is sent to the Notification Service. Notifications can be then sent to one or more notifiers, e.g. a log file.
This allows operations teams to rapidly detect problems or work out what happened after these problems have occurred.
It is possible to display metrics produced by HealthCheck service on MicroProfile Health REST endpoints. You can find more information on set-healthcheck-service-configuration.
|
| The Host Memory Usage currently only works on Linux and BSD derivatives. |
If the Log Notifier is enabled, such events will be presented in the server’s log file like in the following sample:
[2016-05-24T03:52:28.690+0000] [Payara 4.1] [INFO] [fish.payara.nucleus.healthcheck.HealthCheckService] [tid: _ThreadID=72 _ThreadName=healthcheck-service-3 [timeMillis: 1464061948690] [levelValue: 800] [[ CPUC:Health Check Result:[[status=WARNING, message='CPU%: 75.6, Time CPU used: 267 milliseconds'']']]] [2016-05-24T21:11:36.579+0000] [Payara 4.1] [SEVERE] [fish.payara.nucleus.healthcheck.HealthCheckService] [tid: _ThreadID=71 _ThreadName=healthcheck-service-3] [timeMillis: 1464124296579] [levelValue: 1000] [[ HOGT:Health Check Result:[[status=CRITICAL, message='Thread with <id-name>: 145-testing-thread-1 is a hogging thread for the last 59 seconds 999 milliseconds'']']]]HealthCheck Service Configuration
As with any other services available in Payara Server, the HealthCheck service can be configured by using the web console, administration commands or editing the domain.xml configuration file directly.
Using the Web Administration Console
To configure the HealthCheck Service in the Administration Console, go to Configuration → [instance-configuration (like server-config)] → Healthcheck:
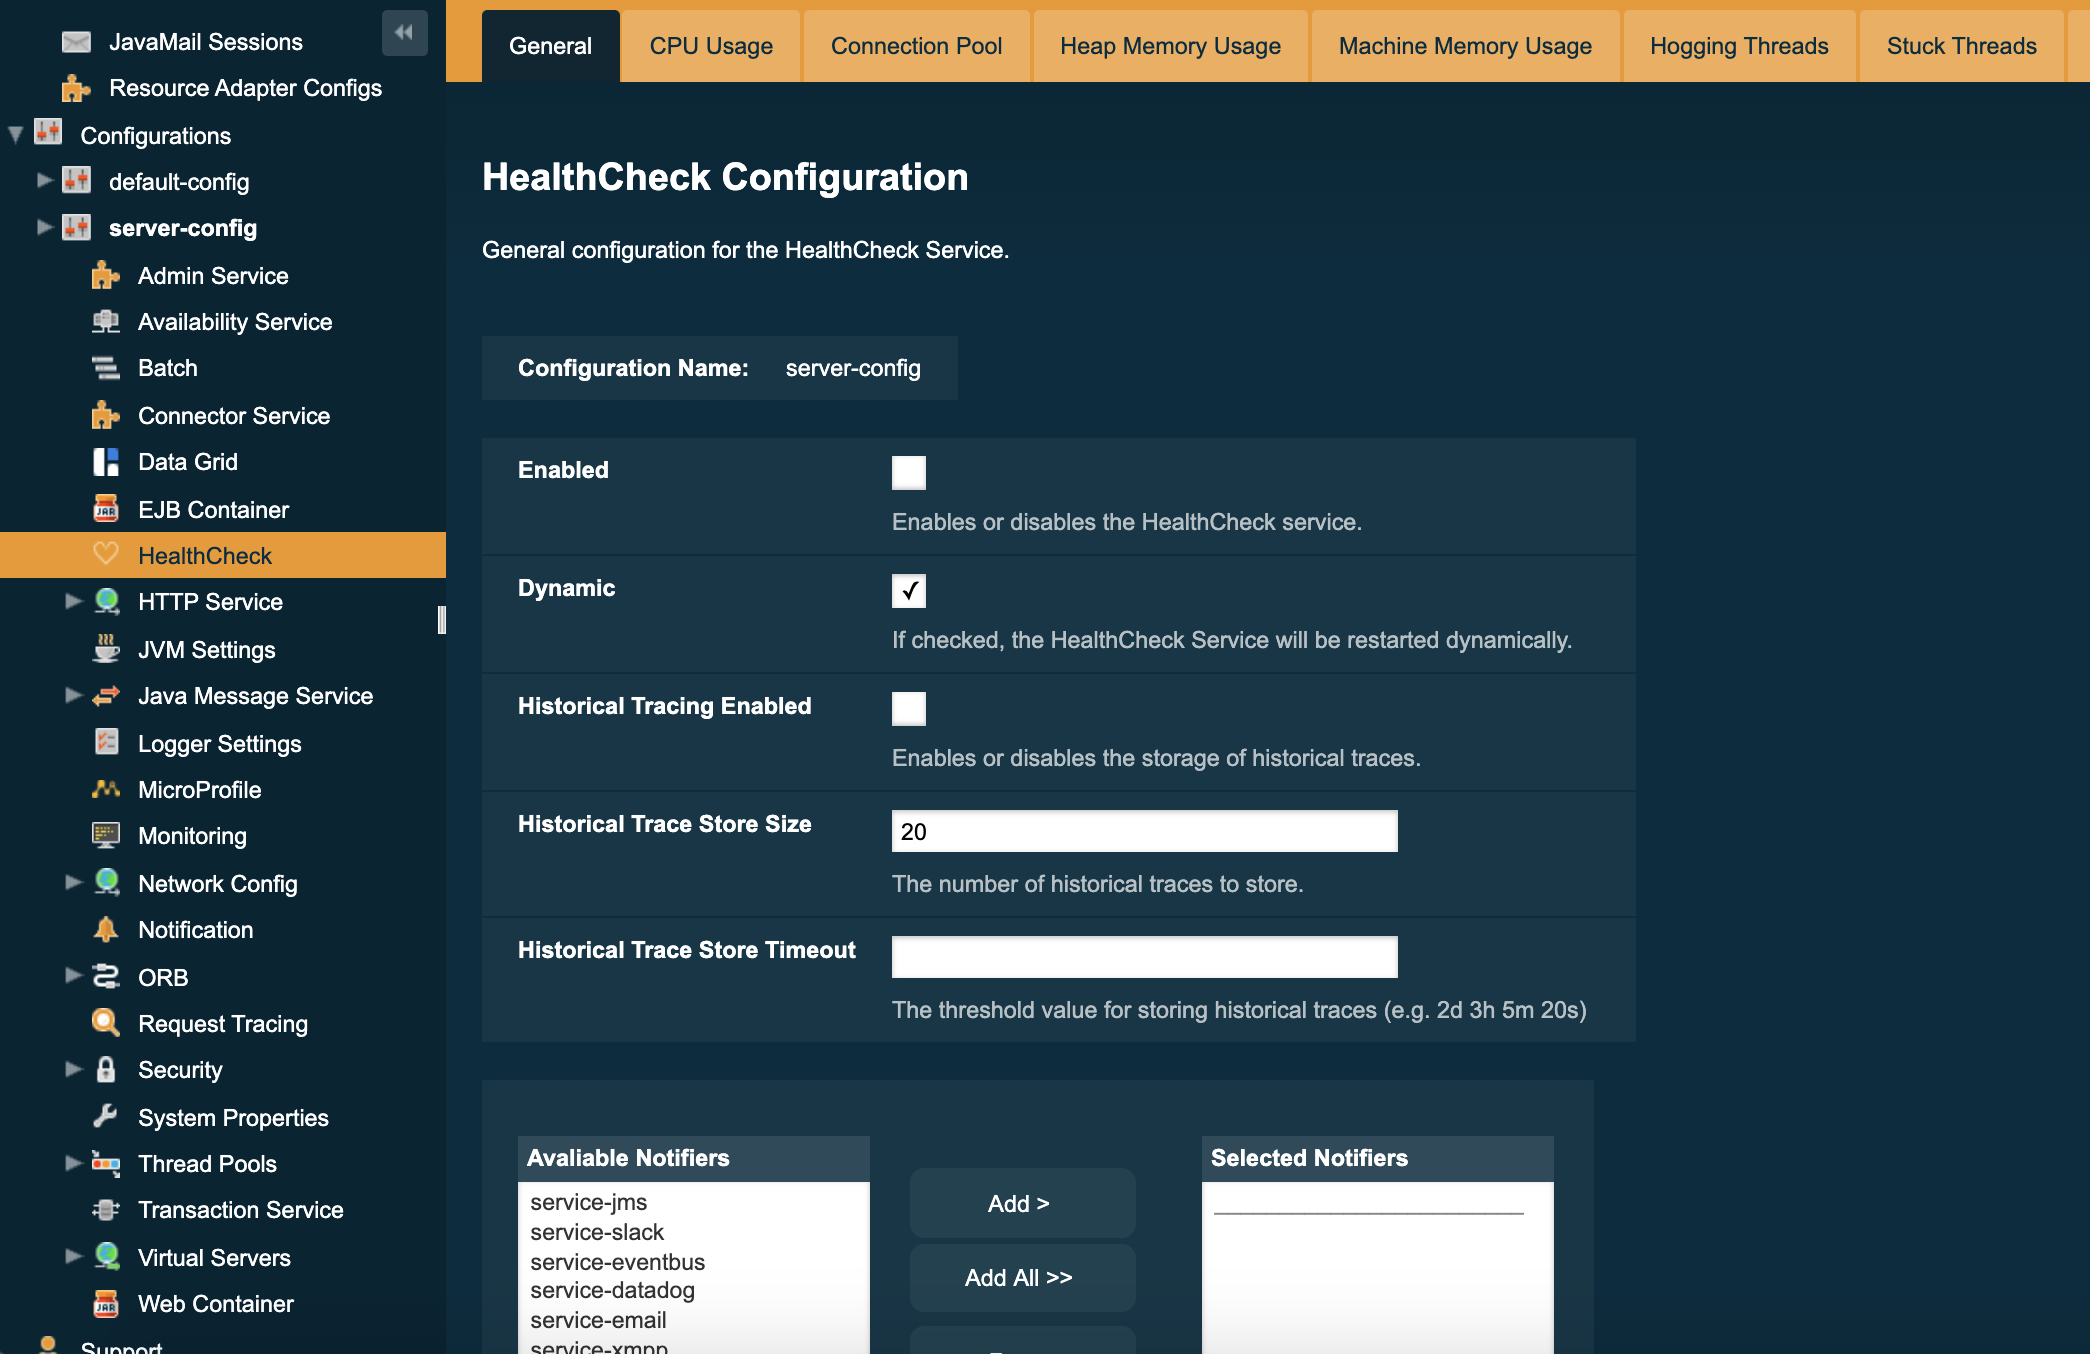
Check the Enabled box (and the Dynamic box too if you don’t want to restart the domain) to switch the HealthCheck service on.
The general settings of the service are:
- Threshold Unit
-
This defines the time duration per unit. The accepted options are any valid java.util.concurrent.TimeUnit values. The default value is SECONDS.
- Threshold Value
-
This defines the number of units beyond which a request will be traced.
- Store Historic Traces
-
When present, enables the storage of the slowest historical request trace events.
- Historic Trace Store Size
-
Determines the number of historical trace events that can be stored in memory when historical storing is enabled. The default value is 20 records
Aside from this configuration settings, you can also define which notifiers will be used to relay the HealthCheck events by moving them to the Active Notifiers box.
| Keep in mind that for HealthCheck events to be relayed to the active notifiers, both the Notification Service and each respective notifier must be enabled first. |
| You don’t need to manually add each notifier on this screen. When enabling a notifier on its configuration screen, the server will automatically add it to the list of active notifiers for the HealthCheck service. This same result occurs when enabling the notifier using the appropriate asadmin command. |
Configuring the Available Checkers
Each of the available checkers that are used to determine the server’s health can also be configured separately from each other on the admin console. The list of the available checkers is as follows:
- CPU Usage
-
Calculates the CPU usage and prints out the percentage along with the usage time.
- Connection Pool
-
Calculates the ratio of free/used connections available for all JDBC connections pool and prints the percentage of used connections for each active pool.
- Heap Memory Usage
-
Calculates the heap memory usage and prints out the percentage along with initial and committed heap sizes.
- Machine Memory Usage
-
Calculates the machine memory usage and prints out the percentage along with the total and used physical memory size.
- Hogging Threads
-
Identifies the threads that are hogging the CPU.
- Stuck Threads
-
Identifies the threads that are stuck for a specified period of time.
- Garbage Collector
-
Calculates and prints out how many times GC is executed with its elapsed time.
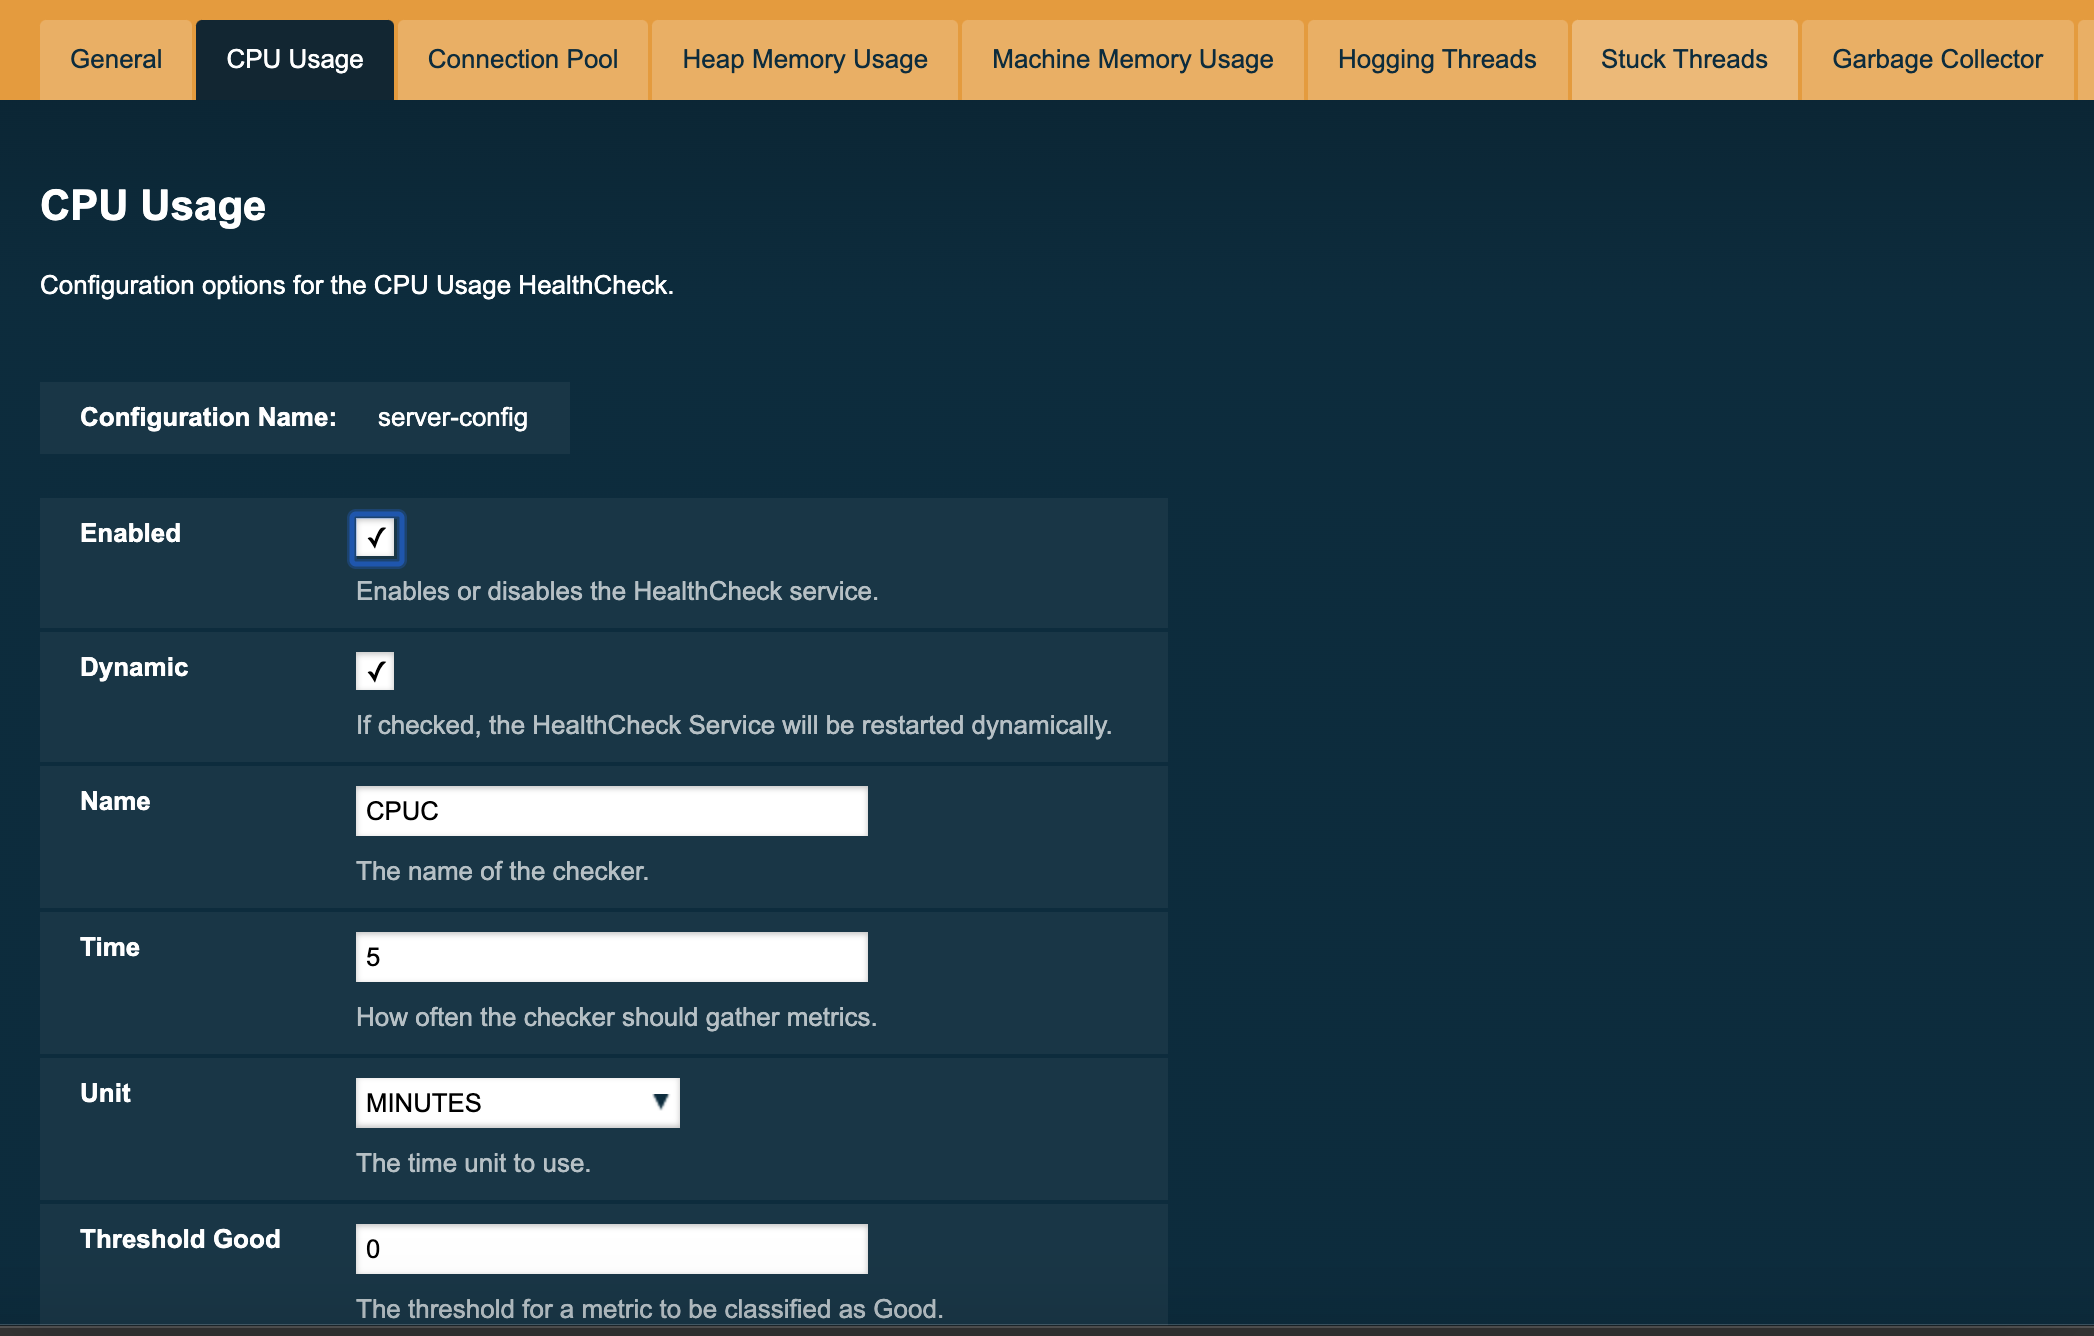
You can configure the settings for each checker on the respective tab in the web console. Here’s a sample image with the current configuration for the CPU Usage checker:
From the Command Line
You can configure the HealthCheck Service by using the asadmin commands. The following is a detailed list of the administration commands that can be used to correctly configure the HealthCheck Service.
set-healthcheck-configuration
- Usage
set-healthcheck-configuration
 --enabled=true|false
 --dynamic=true|false
 --historic-trace-enabled=true|false
 --historic-trace-store-size=20
 --historic-trace-store-timeout=<integer.value>s|m|h|d
 --set-notifiers=<notifier.name>
 --enable-notifiers=<notifier.name>
--disable-notifiers=<notifier.name>- Aim
-
Enables and disables the HealthCheck service. This includes configuration for tracing historic health check events for later inspection.
Command Options
| Option | Type | Description | Default | Mandatory |
|---|---|---|---|---|
|
|
The instance or cluster that will enable or disable its service |
server |
no |
|
|
Whether to apply the changes directly to the server without a restart |
false |
no |
|
|
Whether to enable or disable the service |
N/A |
no |
|
|
Enables storing traces in a rolling store for later inspection |
false |
no |
|
|
Sets the maximum number of health checks to store |
20 |
no |
|
|
Sets the time period after which a historic health check event entry is removed from history. The time expression should consist of a number followed by a time unit; |
- |
no |
|
|
Use the option to set the notifiers to the HealthCheck Service. It will replace all the notifiers that have already been set to the HealthCheck Service. A comma-separated list can be used to represent multiple notifiers. |
The notifiers available by default are:
|
no |
|
|
Use the option to enable a notifier. A comma-separated list can be used to represent multiple notifiers. |
- |
no |
|
|
Use the option to disable a notifier. A comma-separated list can be used to represent multiple notifiers. |
- |
no |
| Enabling or disabling the health check service implicitly also enables or disables the log notifier which is the default notifier. |
You can find the list of available notifiers using the list-notifiers command.
|
Example
The following example will enable the Healthcheck service such that it will only activate from the next time the server is restarted. It sets the log notifier and JMS notifiers and the historical trace store to retain 20 health checks.
asadmin> set-healthcheck-configuration
    --enabled=true
    --dynamic=false
    --historic-trace-enabled=true
    --historic-trace-store-size=20
    --set-notifiers=log-notifier,jms-notifiers
list-healthcheck-services
- Usage
-
asadmin> list-healthcheck-services - Aim
-
Lists the names of all available metric checker services.
Example
Running the command will show output similar to the example below:
Available Health Check Services:
        Name                    Description
        healthcheck-cpool       Provides ratio on connection usage for a given pool name with severity according to defined threshold values
        healthcheck-mp          Checks that all instances are responding to Microprofile Healthcheck requests with an UP response
        healthcheck-stuck       Provides thread name, id and stack trace for requests which reach over defined threshold values
        healthcheck-cpu         Provides ratio on cpu usage time with severity according to defined threshold values
        healthcheck-gc          Provides ratio on garbage collection count with severity according to defined threshold values
        healthcheck-heap        Provides ratio on used heap memory with severity according to defined threshold values
        healthcheck-threads     Lists hogging threads with their id when given thresholds exceed
        healthcheck-machinemem  Provides ratio on used machine memory with severity according to defined threshold values
        healthcheck-mpmetrics   Provides a way to monitor and log the values of metrics exposed by MicroProfile Metrics

Command list-healthcheck-services executed successfully.
set-healthcheck-service-configuration
- Usage
set-healthcheck-service-configuration
 --enabled=true|false
 --dynamic=true|false
 --service=<service.name>
 --checker-name=<string.value>
 --add-to-microprofile-health=true|false
 --time=<integer.value>
 --time-unit=DAYS|HOURS|MINUTES|SECONDS|MILLISECONDS
 --threshold-critical=80
 --threshold-warning=50
 --threshold-good=0
 --hogging-threads-threshold=<integer.value>
 --hogging-threads-retry-count=<integer.value>
 --stuck-threads-threshold=<integer.value>
 --stuck-threads-threshold-unit=DAYS|HOURS|MINUTES|SECONDS|MILLISECONDS
 --add-metric=<metric.name>
--delete-metric=<metric.name>- Aim
-
Enables or disables the monitoring of a specific metric. The command also configures the frequency of monitoring for that metric. Furthermore it configures metric specific properties.
Command Options
| Option | Type | Description | Default | Mandatory |
|---|---|---|---|---|
|
|
The instance or cluster that will enable or disable its metric configuration |
server |
no |
|
|
Whether to apply the changes directly to the server/instance without a restart |
false |
no |
|
|
Whether to enable or disable the metric monitoring |
N/A |
yes |
|
|
The service metric name. One of:
|
- |
yes |
|
|
A user determined name for easy identification of the checker. This should be unique among the services you have configured, to avoid confusion on the notification messages. |
Depends on the service checker. One of:
|
no |
|
|
When enabled the checker is add to MicroProfile Health and all health check result for the checker is displayed on MicroProfile Health REST endpoints. |
false |
no |
|
|
The amount of time units that the service will use to periodically monitor the metric |
5 |
no |
|
|
The time unit to set the frequency of the metric monitoring. Must correspond to a valid
|
|
no |
|
|
The threshold value that this metric must surpass to generate a |
90 |
no |
|
|
The threshold value that this metric must surpass to generate a |
50 |
no |
|
|
The threshold value that this metric must surpass to generate a |
0 |
no |
|
|
The threshold value that this metric will be compared to mark threads as hogging the CPU. Only available for |
95 |
no |
|
|
The number of retries that the checker service will execute in order to identify a hogging thread. Only available for |
3 |
no |
|
|
The threshold above which a thread is considered stuck. Must be 1 or greater. Only available for |
- |
no |
|
|
The unit for the threshold for when a thread should be considered stuck. Only available for |
- |
no |
|
|
Adds a metric exposed by MicroProfile Metrics to monitor. Takes a string of the format |
- |
no |
|
|
Removes a metric exposed by MicroProfile Metrics that has been added to monitor. Takes a string of the format |
- |
no |
If this command gets executed before running the set-healthcheck-configuration command, it will succeed and the configuration will be saved, but the HealthCheck service will not be enabled.
|
Examples
A very basic example command to simply enable the GC checker and activate it without needing a restart would be as follows:
asadmin> set-healthcheck-service-configuration
 --enabled=true
 --service=gc
 --dynamic=true
Monitoring the health of JDBC connection pools is a common need. In that scenario, it is very unlikely that on-the-fly configuration changes would be made, so a very high CRITICAL threshold can be set. Likewise, a nonzero GOOD threshold is needed because an empty or unused connection pool may not be healthy either.
The following command would apply these settings to the connection pool checker:
asadmin> set-healthcheck-service-configuration
 --service=cp
 --dynamic=true
 --threshold-critical=95
 --threshold-warning=70
 --threshold-good=30
Monitoring which threads hog the CPU is extremely important since this can lead to performance degradation, deadlocks and extreme bottlenecks issues that web applications can incur. In some cases the defaults are all that is needed, but imagine that in a critical system you want to set the threshold percentage to 90%, and you want to make sure that the health check service guarantees the state of such threads with a retry count of 5. Additionally, you want to set the frequency of this check for every 20 seconds.
The following command would apply these settings to the connection pool checker:
asadmin> set-healthcheck-service-configuration
 --service=cp
 --dynamic=true
 --hogging-threads-threshold=90
 --hogging-threads-retry-count=5
 --time=20
 --time-unit=SECONDS
The following example configures the stuck threads checker to check every 30 seconds for any threads which have been stuck for more than 5 minutes and applies the configuration change without needing a restart:
asadmin> set-healthcheck-service-configuration
 --service=stuck-thread
 --enabled=true
 --dynamic=true
 --time=30
 --time-unit=SECONDS
 --stuck-threads-threshold=5
 --stuck-threads-threshold-unit=MINUTES
The following example configures the Microprofile Metrics Checker to add base_thread_max_count metrics for monitoring, adds the checker to MicroProfile Health to
display its result on MicroProfile Health REST endpoints and applies the configuration change without needing a restart:
asadmin> set-healthcheck-service-configuration
 --service=mp-metrics
 --enabled=true
 --dynamic=true
 --add-to-microprofile-health=true
 --add-metric='metricName=base_thread_max_count'
get-healthcheck-configuration
- Usage
-
asadmin> get-healthcheck-configuration - Aim
-
Lists the current configuration for the health check service, configured checkers and enabled notifiers.
Example
A sample output is as follows:
Health Check Service Configuration is enabled?: true
Historical Tracing Enabled?: true
Historical Tracing Store Size: 20
Name                  Notifier Enabled
log-notifier          true
jms-notifier          false
cdieventbus-notifier  false
eventbus-notifier     false
Below are the list of configuration details of each checker listed by its name.

Name  Enabled  Time  Unit     Add to MicroProfile Health  Critical Threshold  Warning Threshold  Good Threshold
CPUC  true     5     MINUTES  true                        80                  50                 0
HEAP  true     5     MINUTES  false                       80                  50                 0

Name   Enabled  Time  Unit     Add to MicroProfile Health  Threshold Time  Threshold Unit
STUCK  true     5     MINUTES  false                       5               MINUTES

Name  Enabled  Time  Unit     Add to MicroProfile Health
MPM   true     5     MINUTES  false

Monitored Metric Name  Description
base_thread_max_count Displays the peak live thread count since the Java virtual machine started or peak was reset. This includes daemon and non-daemon threads.
base_gc_total_total    Displays the total number of collections that have occurred. This attribute lists -1 if the collection count is undefined for this collector.

Command get-healthcheck-configuration executed successfully.
Common HealthCheck Service Checker Configuration
The following are the configurable attributes available to ALL the HealthCheck Service checkers:
- Enabled
-
Determines whether or not the checker is enabled.
- Dynamic
-
Determine whether the changes done to the checker’s configuration are applied immediately or after the server/instance’s restart.
- Name
-
The name or label that the checker will use to identify itself on the notification events. The default names for all checkers are the following:
Checker Default name CPU Usage
CPUCConnection Pool
CONPHeap Memory Usage
HEAPMachine Memory Usage
MEMMHogging Threads
HOGTStuck Threads
STUCKGarbage Collector
GBGC - Time
-
The time interval value (as an
Integer) specified in given unit to execute the checker for the metric. The default value is 5. - Unit
-
This defines the time duration per unit. The accepted options are any valid java.util.concurrent.TimeUnit values. The default value is MINUTES.
Threshold Range Configuration for HealthCheck Service Checkers
The following attributes are available to the CPU Usage, Connection Pool, Heap Memory Usage, Machine Memory Usage and Garbage Collector checkers:
- Threshold Good
-
The upper numeric boundary (valid
Integer) of the metric used by the checker for the notification event to be classified as GOOD. It has 0 as default value. - Threshold Warning
-
The upper numeric boundary (valid
Integer) of the metric used by the checker for the notification event to be classified as WARNING. It has 50 as default value. - Threshold Critical
-
The upper numeric boundary (valid
Integer) of the metric used by the checker for the notification event to be classified as CRITICAL. It has 80 as default value.
The threshold values range (GOOD - WARNING - CRITICAL) are used to correctly warn users of the health of a specific metric depending on their value when they are measured based on the checking frequency. For example, if the CPU Usage checker is configured with the default threshold values, and at measuring time, the CPU is performing at 76,8%. Then this notification event would be generated:
Health Check notification with severity level: WARNING - CPUC:Health Check Result:[[status=WARNING, message='CPU%: 76.8, Time CPU used: 171 milliseconds'']']Special HealthCheck Service Checkers Configuration
The Hogging Threads and the Stuck Threads checkers are special on their configuration. They do not have a threshold range configuration, instead opting for different attributes.
Here’s a configuration sample of the Hogging Threads checker:
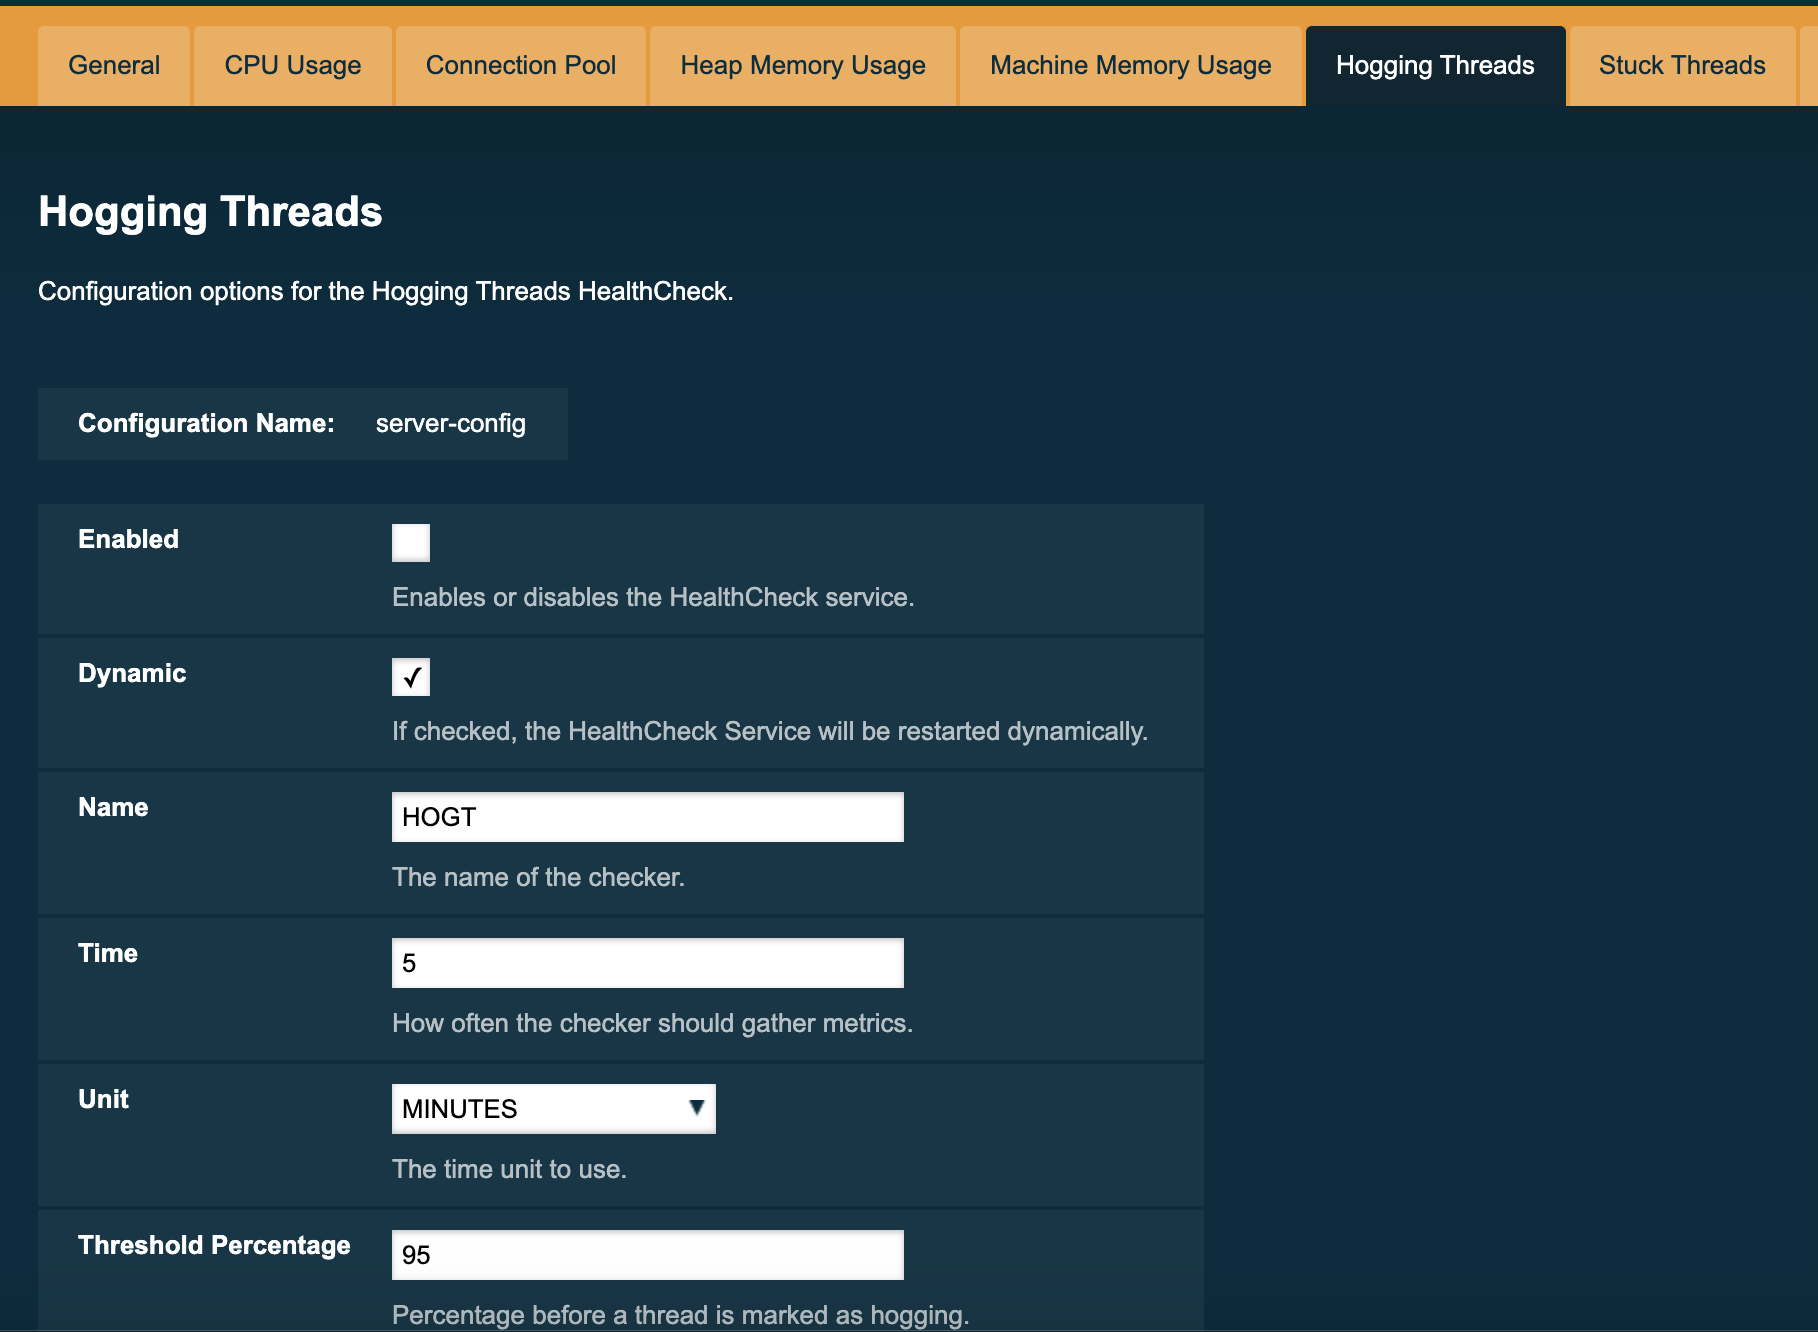
The following are the attributes used to configure this checker:
- Threshold Percentage
-
Defines the minimum percentage needed to decide if the thread is hogged CPU-wise. The percentage is calculated with the ratio of elapsed CPU time to checker execution interval. Its default value is 95.
- Retry Count
-
Represents the count value that should be reached by the hogged thread in order for the service to send notifications. Its default value is 3
And here’s a configuration sample for the Stuck Threads checker:
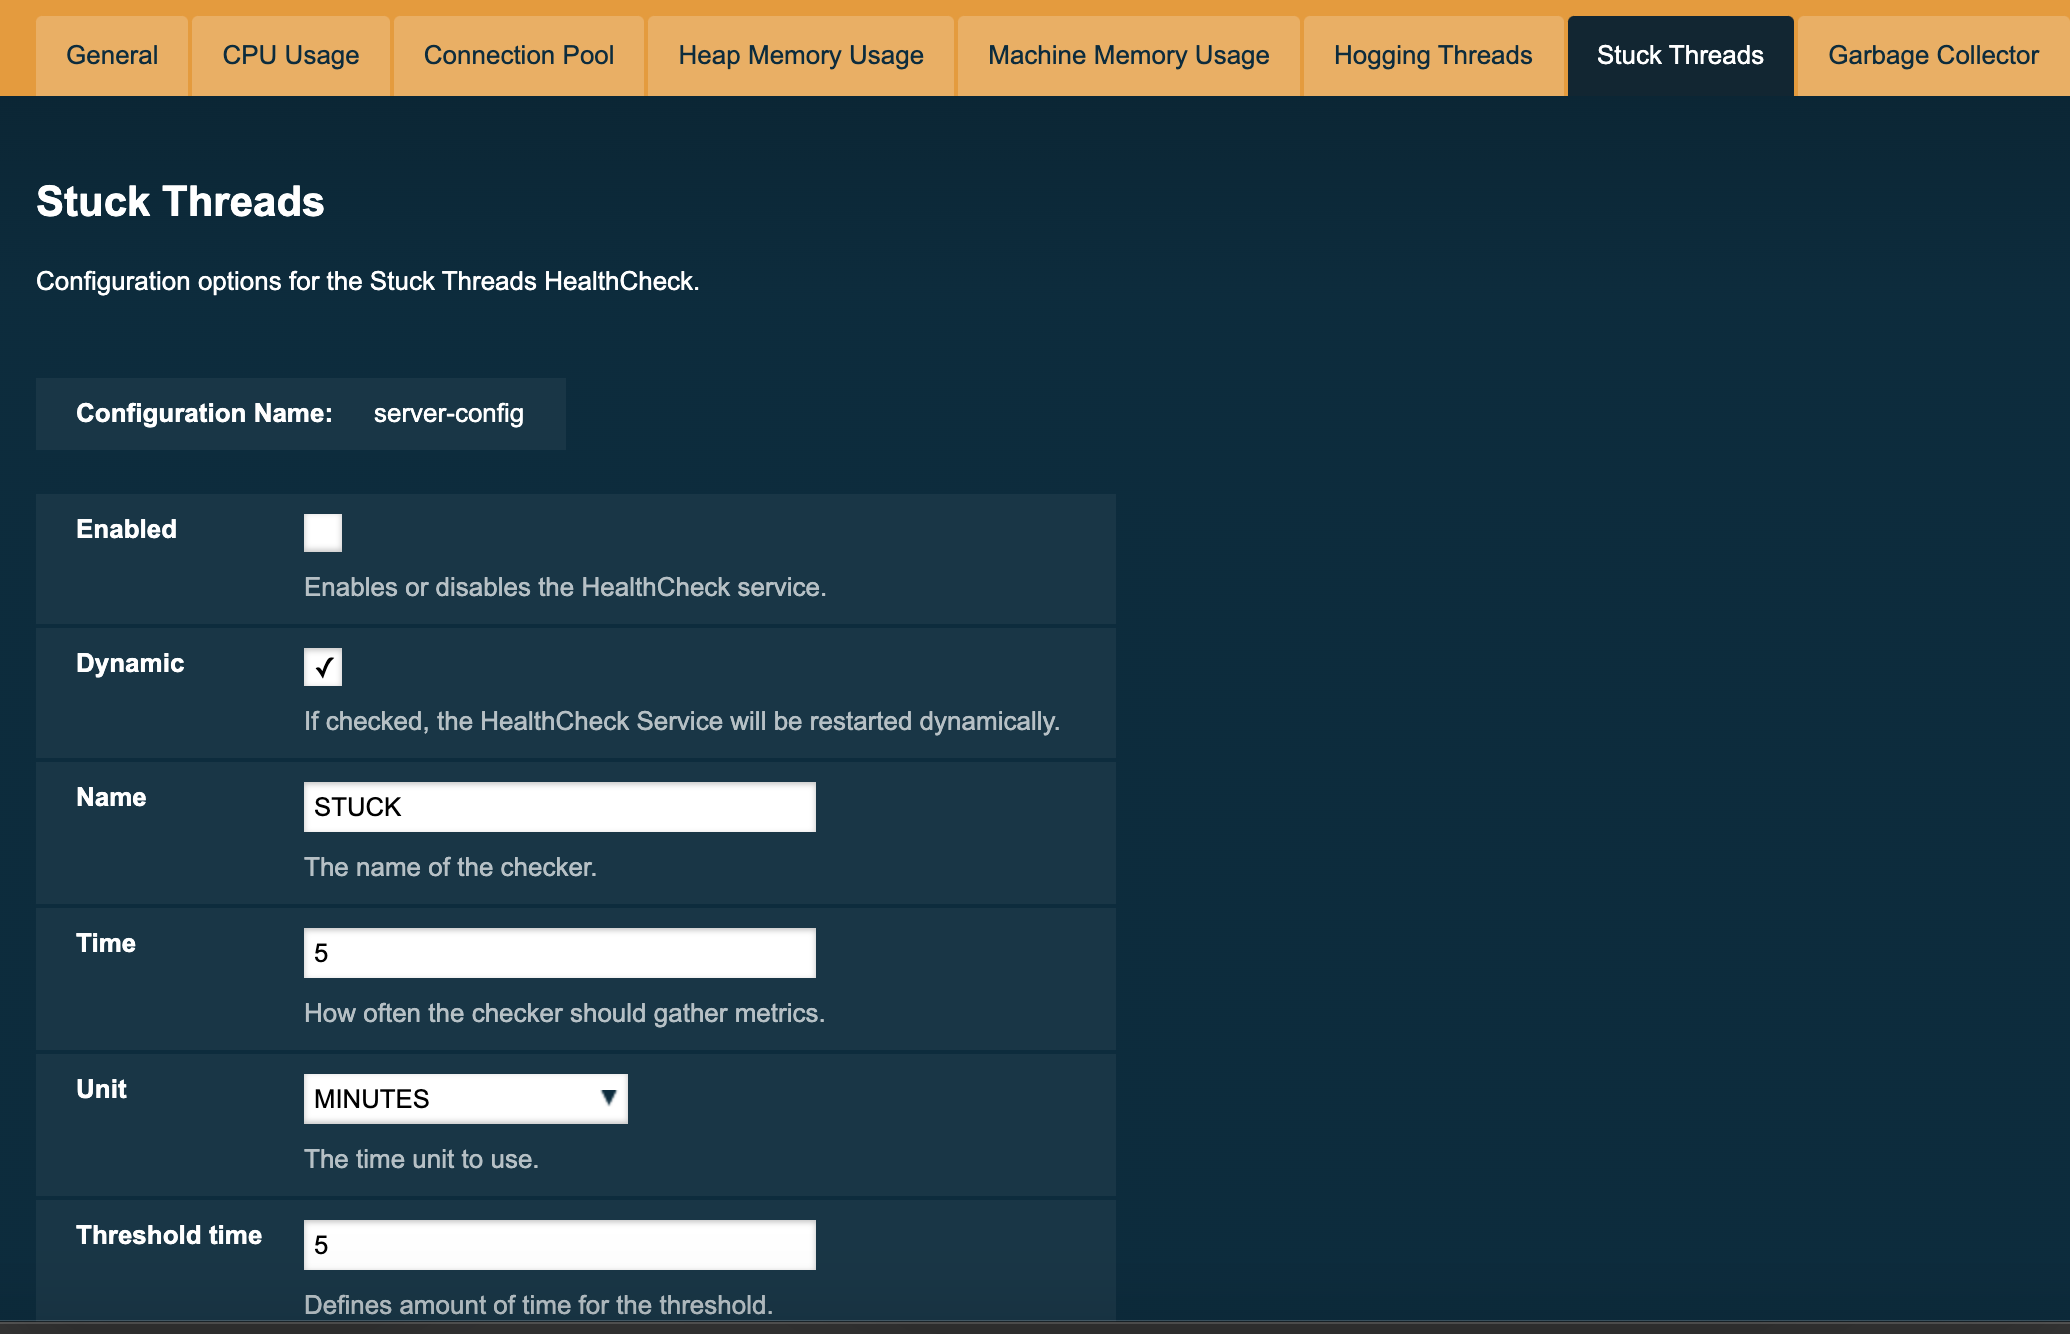
The following are the attributes used to configure this checker:
- Threshold Time
-
Defines the time value for which a thread can be non-responsive before it is considered stuck. It’s default value is 5.
- Threshold Unit
-
Defines the time unit for the value of the Threshold Time field. It’s default value is Minutes.