Payara Cloud includes application logging. To make use of this feature, your application should use java.util.Logging or you can use j.u.l as the backend for SLF4J (or any other logging facade) if your application is utilizing that.
Accessing Logs
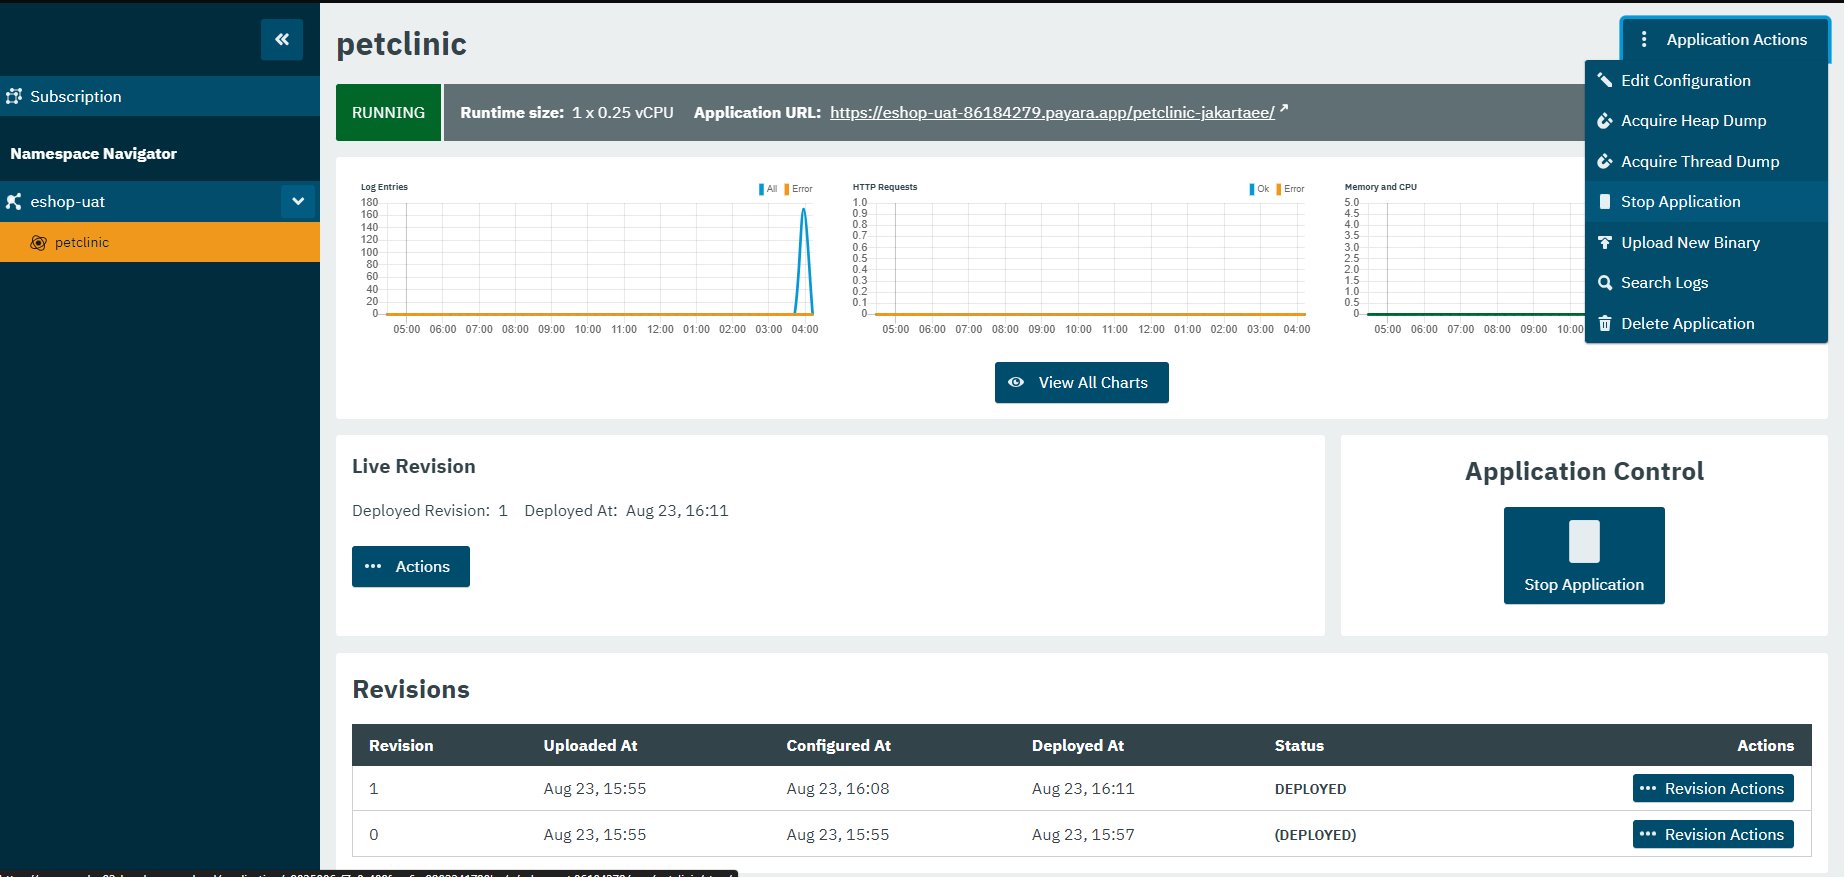
To view or search the logs, go to the application you wish to view and click on the Application Actions button to open the drop down menu.
Click on the Search logs option.
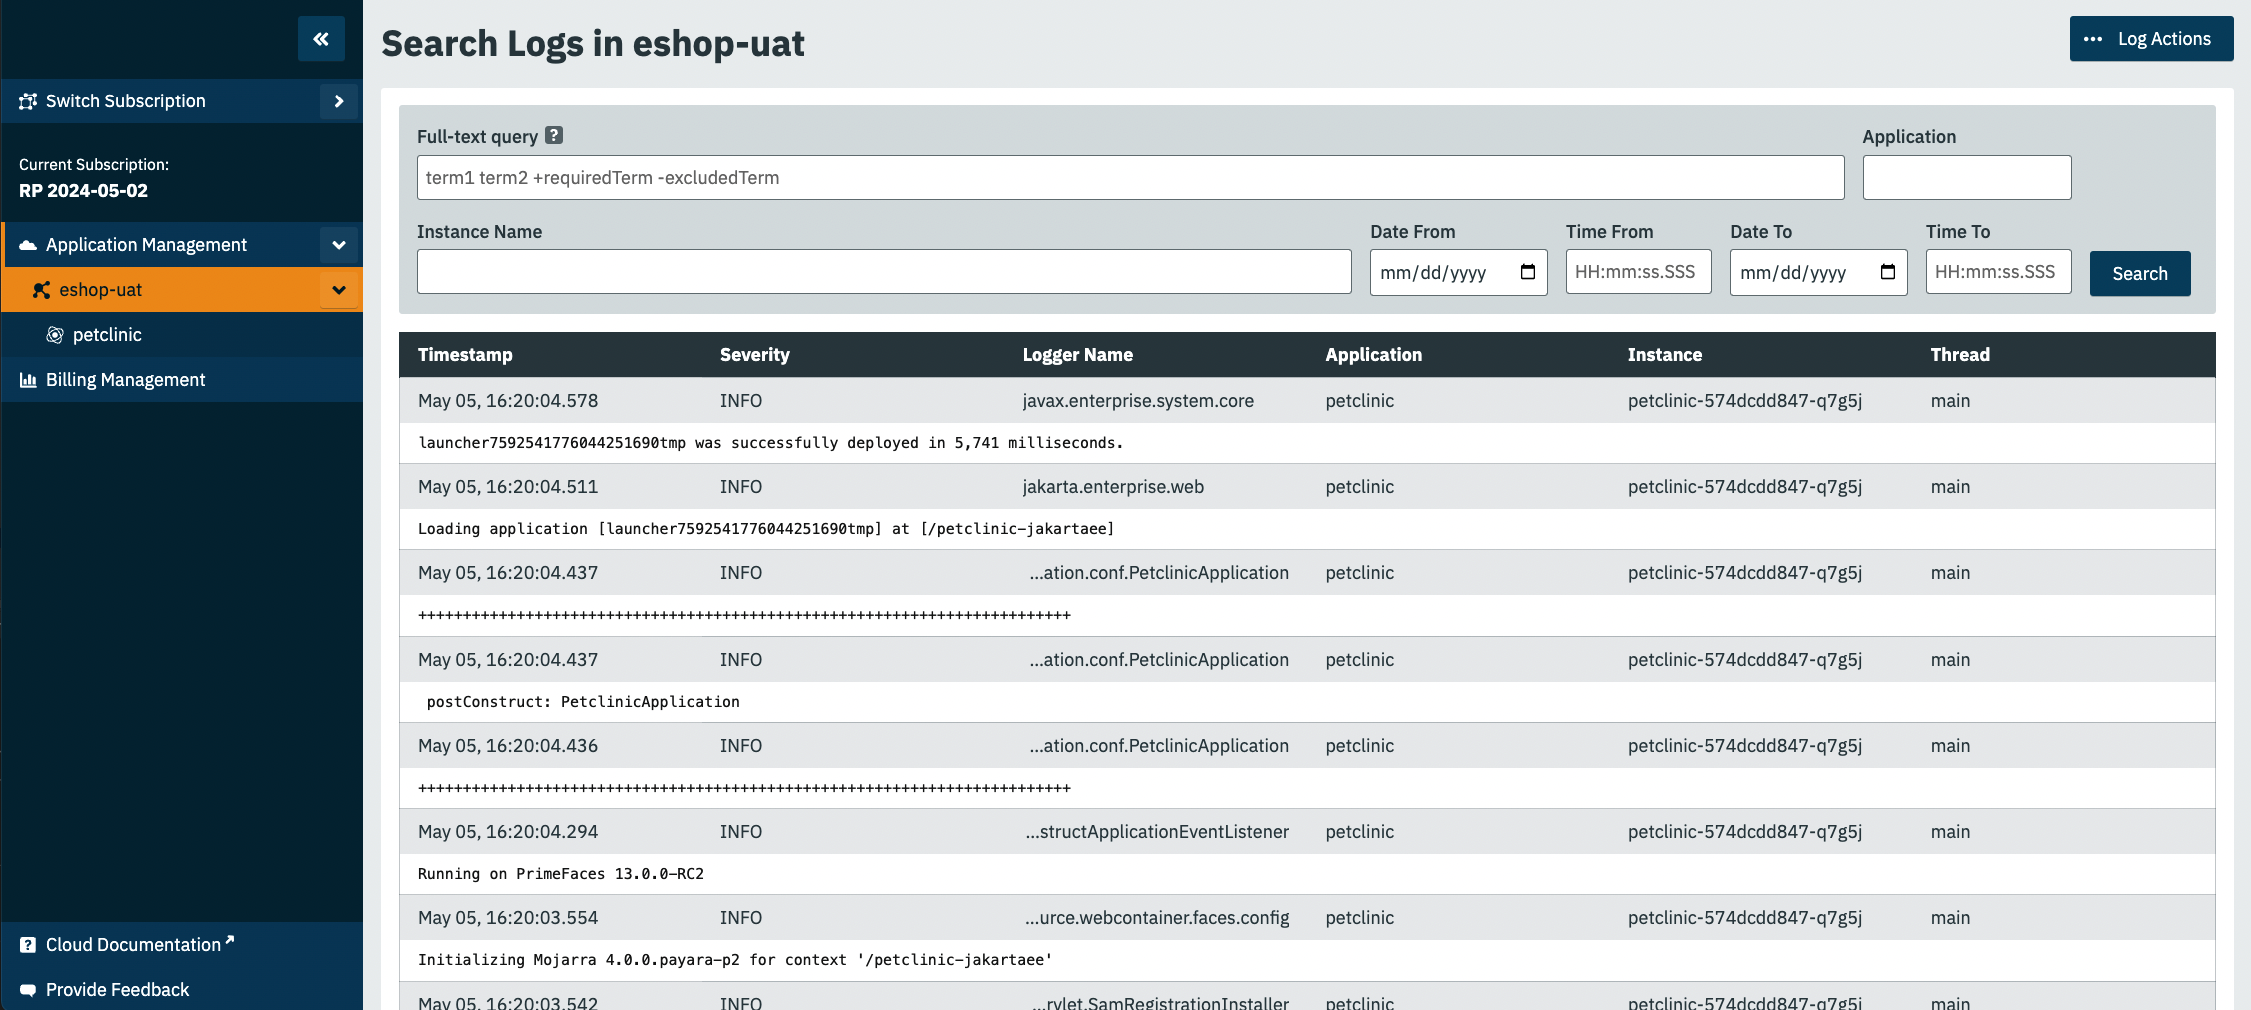
From the Search Logs screen, you can enter search queries and restrict your search to specific dates and times using the options in the search box.
Search queries will search the entire log entry. Search terms are alphanumeric sequences containing four or more characters. When a log entry matches any of the terms it is included in the result. You can use Boolean operators in your search queries to display results with a search term or exclude results containing your search term.
Using the full-text query to locate specific information, you can define which words need to be present in the message or other fields, or which words should not be present.
Only whole words are recognized, for example when specifying load, log entries containing loading are not matched.
When specifying multiple words, without any prefix, a log entry is shown when one of those words is found in the message. For example, loading network returns the log entries containing either loading or network.
If you require that a certain word needs to be present in the message, prefix it with +. And when you want to exclude a message based on the occurrence of a word, use the – prefix.
The prefixes can be combined with words without a prefix. For example, the following is a valid query loading network -policy. It returns those entries where the message contains either the word loading or network but excludes those having the word policy.
You can also filter the log entries based on the timestamp of the log entry.
You can either specify a timestamp from or timestamp from and timestamp to - but specifying only a timestamp to value to retrieve entries older than the specified timestamp is not allowed. In that case, put a timestamp for last week or month in the timestamp from field.
When defining a timestamp, you can specify a date, a date in combination with hour and minutes, or a more detailed timestamp as indicated by the pattern visible in the field.
20/01/2021: Only the date is specified and when used in the timestamp from field, the beginning of the day is assumed. In the field timestamp to, the end of the day is taken as value.
20/01/2021 08:00: Besides the date, also hour and minutes are defined. In the timestamp from field, the beginning of the hour is assumed and in the end field, the end of the hour.
Heap Dumps
A Heap Dump can be used to analyze issues with your application if you suspect there is an object usage problem causing it. You can create a Heap dump of the JVM process running your application through the Application Actions, Acquire Heap Dump item.
When the Heap dump is ready, it starts downloading a file containing the Heap dump. This file can be analyzed with the same tools when you capture a Heap dump locally.
The file appears at the bottom of the diagnostic exports table. It can be downloaded again from this location during the next 7 days.
Thread Dumps
You can analyze the Thread usages of your applications by obtaining a Thread Dump through the Application Actions, Acquire Thread Dump item. This dump is identical to a Thread Dump you obtain from a local JVM and can be used to analyze potential performance issues with your application.
When the Thread dump is ready, it starts downloading a file containing the dump. This file can be analyzed with the same tools when you capture a Thread dump locally.
The file appears at the bottom of the diagnostic exports table. It can be downloaded again from this location during the next 7 days.


