This chapter provides instructions on how to configure logging and how to view log information in the Payara Server environment.
Instructions for accomplishing these tasks and editing logging service properties in the Administration Console are available from the Administration Console online help.
About Logging
Logging is the process by which Payara Server captures information about events that occur, such as configuration errors, security failures, or server malfunction. This data is recorded in log files and is usually the first source of information when problems occur. Analyzing the log files can help you to follow events that occur in the server runtime and determine the overall health of the server.
Although application components can use the Apache Commons Logging Library to record messages, the platform standard JSR 47 Logging API is recommended for better log configuration.
For more information about Logging in Java, see:
Log Files
Payara Server log records are captured in the server log file, which captures information about the operation of a server instance running in the domain. Each instance, managed server instance (that is, each cluster member), and the domain administration server (DAS) has an individual server log file.
Log File Names and Locations
In a Payara Server domain, log files have the following name and location by default:
| Instance | Default Log File Name and Location |
|---|---|
DAS |
|
Server instance |
|
Cluster instance |
|
For example, in a domain hosted on a given machine that includes a cluster with two managed servers (ClusterServer1 and ClusterServer1) and a standalone instance (StandaloneServer), the log files might be arranged in the following directory structure. In this directory structure, the server.log file for the DAS is located in domain-dir/logs.
as-install-parent directory
     glassfish/
         domains/
             domain-dir/
                         logs/
                            server.log
         nodes/
             hostname/
                         ClusterServer1/
                                      logs/
                                         server.log
                         ClusterServer2/
                                      logs/
                                         server.log
                         StandaloneServer/
                                      logs/
                                         server.log
You can change the default name or location of a log file by modifying the logging properties file for the corresponding instance, described in To Change the Name and Location of the Log File.
Log Records
Payara Server writes log records in either the Oracle Diagnostics Logging (ODL) format or the Uniform Log Formatter (ULF) format. The default format is ODL. For information about changing the format, see Setting the Log File Format.
A custom formatter can also be used by specifying the fully qualified name of a class that extends the java.util.logging.Formatter class. The custom formatter class can be packaged in a JAR file and placed in the domain-dir/lib/ext directory, or implemented as a Hundred-Kilobyte Kernel (HK2) service and the JAR containing the formatter implementation placed in the as-install/modules directory.
Log records formatted in the ODL format are displayed as follows:
[yyyy-mm-ddThh:mm:ss.SSS-Z][ProductName-Version][Log Level][Message ID][LoggerName][Key Value Pairs][[Message]]-
[and]mark the beginning and end of fields in the record. Some fields may be empty. -
yyyy-mm-dd`T`hh:mm:ss.SSSS-Zrepresents the date and time that the record was created. For example:2013-04-12T08:08:30.154-0700 -
ProductName-Version represents the current version of Payara Server. For example:
payara -
Log Level represents the log level.
You can set any of the following values:
EMERGENCY,ALERT,SEVERE,WARNING,INFO,CONFIG,FINE,FINER, andFINEST.The default is
INFO. -
Message ID consists of a module code that indicates the origin of the message and the message number. For example:
AS-WEB-GLUE-00172 -
LoggerName represents a hierarchical logger namespace that identifies the source of the log module. For example:
jakarta.enterprise.web -
Key Value Pairs represents pairs of key names and values. For example:
timeMillis: 1365779310154 -
Message represents the text of the log message.
For multiline messages,
\[[marks the end of the first line, and]]marks the end of the message. Multiline messages start on a new line after the message header and are indented.
The following is an example of a log record formatted in the ODL format:
[2013-04-12T08:08:30.154-0700] [Payara Server 7.2026.6] [INFO] [AS-WEB-GLUE-00172] [jakarta.enterprise.web] [tid: _ThreadID=217 _ThreadName=admin-listener(21)]
[timeMillis: 1365779310154] [levelValue: 800] [[
  Loading application [payroll] at [/payroll]]]
Log records formatted in the ULF format are displayed as follows:
[#|yyyy-mm-ddThh:mm:ss.SSS-Z|Log Level|ProductName-Version|LoggerName|Key Value Pairs|Message|#]-
[and]mark the beginning and end of the record. -
The vertical bar (
|) separates the fields of the record. -
yyyy-mm-dd`T`hh:mm:ss.SSSS-Z represents the date and time that the record was created. For example:
2013-04-18T09:27:44.315-0700 -
Log Level represents the log level. You can set any of the following values:
EMERGENCY,ALERT,SEVERE,WARNING,INFO,CONFIG,FINE,FINER, andFINEST. The default isINFO. -
ProductName-Version represents the current version of Payara Server. For example:
Payara Server 7.2026.6 -
LoggerName represents a hierarchical logger namespace that identifies the source of the log module. For example:
jakarta.enterprise.web.core -
Key Value Pairs represents pairs of key names and values and can include a message ID. For example:
_MessageID=AS-WEB-CORE-00306.Message IDs are included for all Payara Server
EMERGENCY,ALERT,SEVERE, andWARNINGmessages, and for manyINFOmessages. -
Message represents the text of the log message. Multiline messages start on a new line after the message header and are indented.
The following is an example of a log record formatted in the ULF format:
[#|2013-04-18T09:27:44.315-0700|INFO|Payara Server 7.2026.6|jakarta.enterprise.web.core| _ThreadID=15;_ThreadName=RunLevelControllerThread-1366302462682;_TimeMillis=1366302464315;_LevelValue=800;_MessageID=AS-WEB-CORE-00306;| Setting JAAS app name glassfish-web|#]The Administration Console presents log records in a more readable display. For information about viewing log records using the Administration Console, see Viewing Log Records.
Log Rotation
By default, when a log file grows to 2 MB, Payara Server renames (rotates) the file to incorporate a timestamp and creates a new log file. The log file is renamed as server.log date, where date is the date and time that the file was rotated.
You can configure the logging service to change the default settings for log file rotation, as explained in Setting Log File Rotation.
Logger Namespaces
Payara Server provides a logger for each of its modules. The following list is an example of the logger namespaces in a server instance as they appear when using the list-log-levels subcommand.
ShoalLogger     <CONFIG>
com.hazelcast   <WARNING>
com.sun.enterprise.server.logging.GFFileHandler <ALL>
com.sun.enterprise.server.logging.SyslogHandler <ALL>
jakarta.mail    <INFO>
java.util.logging.ConsoleHandler        <FINEST>
javax.enterprise.resource.corba <INFO>
javax.enterprise.resource.javamail      <INFO>
javax.enterprise.resource.jdo   <INFO>
javax.enterprise.resource.jms   <INFO>
javax.enterprise.resource.jta   <INFO>
javax.enterprise.resource.resourceadapter       <INFO>
javax.enterprise.resource.sqltrace      <FINE>
javax.enterprise.resource.webcontainer.jsf.application  <INFO>
javax.enterprise.resource.webcontainer.jsf.config       <INFO>
javax.enterprise.resource.webcontainer.jsf.context      <INFO>
javax.enterprise.resource.webcontainer.jsf.facelets     <INFO>
javax.enterprise.resource.webcontainer.jsf.lifecycle    <INFO>
javax.enterprise.resource.webcontainer.jsf.managedbean  <INFO>
javax.enterprise.resource.webcontainer.jsf.renderkit    <INFO>
javax.enterprise.resource.webcontainer.jsf.resource     <INFO>
javax.enterprise.resource.webcontainer.jsf.taglib       <INFO>
javax.enterprise.resource.webcontainer.jsf.timing       <INFO>
javax.enterprise.system.container.ejb   <INFO>
javax.enterprise.system.container.ejb.mdb       <INFO>
javax.enterprise.system.container.web   <INFO>
javax.enterprise.system.core.classloading       <INFO>
javax.enterprise.system.core.config     <INFO>
javax.enterprise.system.core    <INFO>
javax.enterprise.system.core.security   <INFO>
javax.enterprise.system.core.selfmanagement     <INFO>
javax.enterprise.system.core.transaction        <INFO>
javax.enterprise.system <INFO>
javax.enterprise.system.ssl.security    <INFO>
javax.enterprise.system.tools.admin     <INFO>
javax.enterprise.system.tools.backup    <INFO>
javax.enterprise.system.tools.deployment.common <WARNING>
javax.enterprise.system.tools.deployment.dol    <WARNING>
javax.enterprise.system.tools.deployment        <INFO>
javax.enterprise.system.util    <INFO>
javax.enterprise.system.webservices.registry    <INFO>
javax.enterprise.system.webservices.rpc <INFO>
javax.enterprise.system.webservices.saaj        <INFO>
javax   <INFO>
javax.mail      <INFO>
javax.org.glassfish.persistence <INFO>
org.apache.catalina     <INFO>
org.apache.coyote       <INFO>
org.eclipse.persistence.session <INFO>
org.glassfish.admingui  <INFO>
org.glassfish.naming    <INFO>
org.glassfish.wasp      <INFO>
org.jvnet.hk2.osgiadapter       <INFO>
For information about how to display logger namespaces and log levels, see To List Log Levels. For information about how to display a list of loggers and logger details, see To List Loggers.
Logging Targets
Each instance in a Payara Server domain has a dedicated log file, and each instance and cluster has its own logging properties file. To configure logging for an instance or a cluster, Payara Server allows you target specific log files or logging properties files when you do the following:
-
Set global or module-specific log levels
-
Rotate log files or compress them into a ZIP archive
-
Change logging property attributes
-
List log levels or log attributes
The following subcommands optionally accept a target specification. A target can be a configuration name, server name, cluster name, or instance name, and is specified as either an operand or as a value passed using the --target option. If no target is specified when using any of these subcommands, the default target is the DAS.
| Subcommand | Description | Target Specification |
|---|---|---|
Collects all available log files into a ZIP archive. |
|
|
Lists logging attributes in the logging properties file. |
target-name operand |
|
Lists the loggers in the logging properties file and their log levels |
target-name operand |
|
Rotates the log file by renaming it and creating a new log file to store new messages. |
|
|
Sets the specified logging attributes in the logging properties file. |
|
|
Sets the log file formatter. |
|
|
Sets the log level for one or more loggers listed in the logging properties file. |
|
Logging Properties
The DAS as well as each configuration, instance, and cluster has its own set of logging properties that are maintained in individual configuration files. A logging properties file is named logging.properies and includes the following information:
-
Log file name and location
-
Logger names and levels
-
Properties for custom handlers
-
Log rotation and logger format properties
By default, in a Payara Server domain, logging properties files are created in the following locations:
| Target | Default Location of Logging Properties File |
|---|---|
DAS |
|
A configuration |
|
An instance |
|
A cluster |
|
Configuring the Logging Service
Changing the Name and Location of Logging Service Files
This section explains how to change the name and location of the following logging service files:
-
Log file
-
Logging properties file
To Change the Name and Location of the Log File
To change the name and location of the log file, first use the list-log-attributes subcommand to obtain the current log attribute setting for the log file name and location.
Then use the set-log-attributes subcommand to specify the new name or location. The default target for these two subcommands is the DAS. However, you can optionally specify one of the following targets:
-
Configuration name — to target all instances or clusters that share a specific configuration name.
-
Server name — to target only a specific server.
-
Instance name — to target only a specific instance.
-
Cluster name — to target only a specific cluster.
-
Ensure that the target server or cluster is running. Remote subcommands require a running server.
-
Use the
list-log-attributessubcommand in remote mode to obtain the current log attribute settings.The name and location of the log file is set with the
com.sun.enterprise.server.logging.GFFileHandler.fileattribute of the logging properties file. Optionally you can target a configuration, server, instance, or cluster.If you do not specify a target, the log attribute settings for the DAS are displayed.
-
Use the
set-log-attributessubcommand in remote mode to define a custom name or location of the log file.If you do not specify a target, the log file for the DAS is targeted by default. If you target a cluster, the name of the cluster log file for each member instance can be changed (the server log file name cannot).
-
Example - To Change the Name and Location of the Log File
This example changes the name of the cluster log file for Cluster1 to cluster1.log. Cluster1 has two server instances: ClusterServer1 and ClusterServer2.
asadmin list-log-attributes Cluster1

com.sun.enterprise.server.logging.GFFileHandler.alarms <false>
com.sun.enterprise.server.logging.GFFileHandler.file
<${com.sun.aas.instanceRoot}/logs/server.log>
com.sun.enterprise.server.logging.GFFileHandler.flushFrequency  (1)
.
.
.
log4j.logger.org.hibernate.validator.util.Version <warn>
Command list-log-attributes executed successfully.
asadmin> set-log-attributes --target Cluster1
com.sun.enterprise.server.logging.GFFileHandler.file=
${com.sun.aas.instanceRoot}/logs/cluster1.log
com.sun.enterprise.server.logging.GFFileHandler.file
logging attribute set with value ${com.sun.aas.instanceRoot}/logs/cluster1.log
These logging attributes are set for Cluster1.
ClusterServer1 :
com.sun.enterprise.server.logging.GFFileHandler.file
logging attribute set with value ${com.sun.aas.instanceRoot}/logs/cluster1.log
These logging attributes are set for Cluster1.

ClusterServer2 :
com.sun.enterprise.server.logging.GFFileHandler.file
logging attribute set with value ${com.sun.aas.instanceRoot}/logs/cluster1.log
These logging attributes are set for Cluster1.

Command set-log-attributes executed successfully.
You can view the full syntax and options of these subcommands by typing
asadmin help list-log-levels and asadmin help set-log-attributes at
the command line.
To Change the Name and Location of the Logging Properties File
You can set the name and location of the logging properties file by setting the java.util.logging.config.file system property. By setting this system property, you can have a single logging properties file that is used by all instances running on the same host.
Setting the java.util.logging.config.file system property causes all other Payara Server logging properties files on the host to be overridden.
|
-
Set the
java.util.logging.config.filesystem property.For example, you can use the following command:
java -Djava.util.logging.config.file=properties_fileAlternatively, you can use the Administration Console to set this system property.
-
To apply your change, restart Payara Server.
Setting Log Levels
The log level determines the granularity of the message that is logged, from error only (EMERGENCY) to detailed debug (FINEST). The following values apply: EMERGENCY, ALERT, SEVERE, WARNING, INFO, CONFIG, FINE, FINER, and FINEST.
These log levels are hierarchically inclusive, which means that if you set a particular log level, such as INFO, the messages that have log levels above that level (EMERGENCY, ALERT, SEVERE, and WARNING,) are also included. If you set the log level to the lowest level, FINEST, your output includes all the messages in the file. The default setting is INFO.
You can list current log levels of all loggers specified in the logging properties file. In some cases, loggers that have not been created by the respective containers will also appear in the list.
You can set log levels that are global or logger-specific. When you set a global log level, the log level goes into effect for all loggers. If you set the log level for a specific logger that is different from the global log level, the logger-specific setting takes precedence. In addition, when setting log levels, you can target a configuration, server, instance, or cluster.
Because setting log levels is a dynamic operation, you do not need to restart Payara Server for changes to take effect.
Setting either global or logger-specific log levels is done by using the set-log-levels subcommand. Listing log levels is done by using the list-log-levels subcommand.
To List Log Levels
Payara Server provides the means to list all loggers and their log levels. Listing the loggers provides a convenient means to view current loggers and log levels either prior to or after making log level changes.
Use the list-log-levels subcommand in remote mode to list the modules and their current log levels. The default target for this subcommand is the DAS. However, you can optionally specify one of the following targets:
-
Configuration name — to target all instances or clusters that share a specific configuration name.
-
Server name — to target a specific server.
-
Instance name — to target a specific instance.
-
Cluster name — to target a specific cluster.
-
Ensure that the DAS is running. Remote subcommands require a running server.
-
List the existing module loggers and log levels by using the
list-log-levelssubcommand.
-
Example - To List Log Levels Part 1
This example shows a partial list of the existing loggers and their log levels in the DAS.
asadmin list-log-levels

jakarta.enterprise.system.tools.admin <INFO>
java.util.logging.ConsoleHandler <FINEST>
jakarta.enterprise.system.container.web <INFO>
jakarta.enterprise.system.util <INFO>
jakarta.enterprise.resource.webcontainer.jsf.timing <INFO>
javax <INFO>
jakarta.enterprise.resource.corba <INFO>
...
Command list-log-levels executed successfully.
Example - To List Log Levels Part 2
This example shows a partial list of the loggers and log levels for the instance MyServer2.
asadmin list-log-levels MyServer2

java.util.logging.ConsoleHandler <FINEST>
jakarta.enterprise.resource.corba  <INFO>
jakarta.enterprise.resource.javamail   <INFO>
jakarta.enterprise.resource.jdo <INFO>
jakarta.enterprise.resource.jms <INFO>
jakarta.enterprise.resource.jta <INFO>
jakarta.enterprise.resource.resourceadapter <INFO>
jakarta.enterprise.resource.sqltrace <FINE>
...
Command list-log-levels executed successfully.
You can view the full syntax and options of the subcommand by typing asadmin help list-log-levels at the command line.
To Set the Global Log Level
The global log level specifies the events that are logged across all loggers. The default level for messages output to the console is INFO (which also includes EMERGENCY, ALERT, SEVERE, and WARNING messages).
Use the set-log-levels subcommand in remote mode to set the global log level. The default target for this subcommand is the DAS. However, you can optionally specify one of the following targets using the --target option:
-
Configuration name — to target all instances or clusters that share a specific configuration name.
-
Server name — to target a specific server.
-
Instance name — to target a specific instance.
-
Cluster name — to target a specific cluster.
-
Ensure that the target server or cluster is running.
-
Set the global log level by using the
set-log-levelssubcommand, specifying the log level of thejava.util.logging.ConsoleHandlerlogger.The
ConsoleHandlerhas a separate log level setting that limits the messages that are displayed. For example:java.util.logging.ConsoleHandler <FINEST>
-
Example - To Set the Global Log Level
By setting the log level of the ConsoleHandler, you set the global log level for all loggers. This example sets the global log level in the DAS to INFO:
asadmin set-log-levels java.util.logging.ConsoleHandler=INFO

java.util.logging.ConsoleHandler package set with log level INFO.
These logging levels are set for server.

Command set-log-levels executed successfully.
You can view the full syntax and options of the subcommand by typing asadmin help set-log-levels at the command line.
To Set Module Log Levels
A module log level specifies the events that are logged for a particular logger. The default level for messages output to the console is INFO (which also includes EMERGENCY, ALERT, SEVERE, and WARNING messages). The global log level is overridden by a module-specific log level.
By default, the module log level is set to FINE. The lines for the loggers in the logging properties file might look like this:
jakarta.enterprise.system.tools.level=FINE
jakarta.enterprise.system.container.ejb.level=FINE
jakarta.enterprise.system.core.security.level=FINE
jakarta.enterprise.system.tools.admin.level=FINE
jakarta.enterprise.level=FINE
jakarta.enterprise.system.container.web.level=FINE
Because setting log levels is a dynamic operation, you do not need to restart Payara Server for changes to take effect.
-
Ensure that the target server or cluster is running.
Remote subcommands require a running server.
-
List the existing module loggers and their log levels by using the
list-log-levelssubcommand. -
Set the log level for a module by using the
set-log-levelssubcommand.Your choices are
EMERGENCY,ALERT,SEVERE,WARNING,INFO,CONFIG,FINE,FINER, andFINEST.
Example - To Set the Module Log Levels Part 1
This example sets the log level for the web container logger to WARNING on the target instance ManagedServer1:
asadmin set-log-levels --target ManagedServer1

jakarta.enterprise.system.container.web=WARNING
jakarta.enterprise.system.container.web package set with log level WARNING.
These logging levels are set for ManagedServer1.
ManagedServer1 :
jakarta.enterprise.system.container.web package set with log level WARNING.
These logging levels are set for ManagedServer1.

Command set-log-levels executed successfully.
Example - To Set the Module Log Levels Part 2
The following example sets the log level for security and web container loggers in the DAS.
asadmin set-log-levels jakarta.enterprise.system.core.security=FINE:

jakarta.enterprise.system.container.web=WARNING
jakarta.enterprise.system.container.web package set with log level WARNING.
jakarta.enterprise.system.core.security package set with log level FINE.
These logging levels are set for server.

Command set-log-levels executed successfully.
You can view the full syntax and options of the subcommand by typing asadmin help set-log-levels at the command line.
Setting the Log File Format
You can set the format for log records in log files.
To Set the Log File Format
Use the set-log-file-format subcommand in remote mode to set the formatter used by Payara Server to format log records in log files. You can also use the set-log-attributes subcommand.
Log formats for all server instances in a cluster will be the same. For information about log formats, see Log Records.
| Changing the log format forces log rotation to avoid mixed format in the same file. |
-
Ensure that the target server or cluster is running. Remote commands require a running server.
-
Set the formatter by using the
set-log-file-formatsubcommand. -
To apply your change, restart Payara Server.
Example - To Set the Log File Format Part 1
This example sets the log file format to ULF for standalone instance ManagedServer1 using the set-log-file-format subcommand.
asadmin set-log-file-format --target ManagedServer1 ulf

The log file formatter is set to com.sun.enterprise.server.logging.UniformLogFormatter for instance ManagedServer1.
Command set-log-file-format executed successfully.
Example - To Set the Log File Format Part 2
This example sets the log file format to ULF for standalone instance ManagedServer1 using the set-log-attributes subcommand.
asadmin set-log-attributes --target ManagedServer1 com.sun.enterprise.server.logging.GFFileHandler.formatter=ulf

com.sun.enterprise.server.logging.GFFileHandler.formatter logging attribute value set to ulf.
The logging attributes are saved successfully for ManagedServer1-config.
Command set-log-attributes executed successfully.
You can view the full syntax and options of the set-log-file-format subcommand by typing asadmin help set-log-file-format at the command line. You can view the full syntax and options of the set-log-attributes subcommand by typing asadmin help set-log-attributes at the command line.
ANSI Coloured Logging
Payara Server supports the use of ANSI coloured log entries when running in verbose mode under the uniform log format (ULF).
To enable ANSI colours run the following command using the Asadmin CLI:
asadmin> set-log-attributes com.sun.enterprise.server.logging.UniformLogFormatter.ansiColor=true| This setting is enabled by default when a domain is started in Linux and macOS environments. |
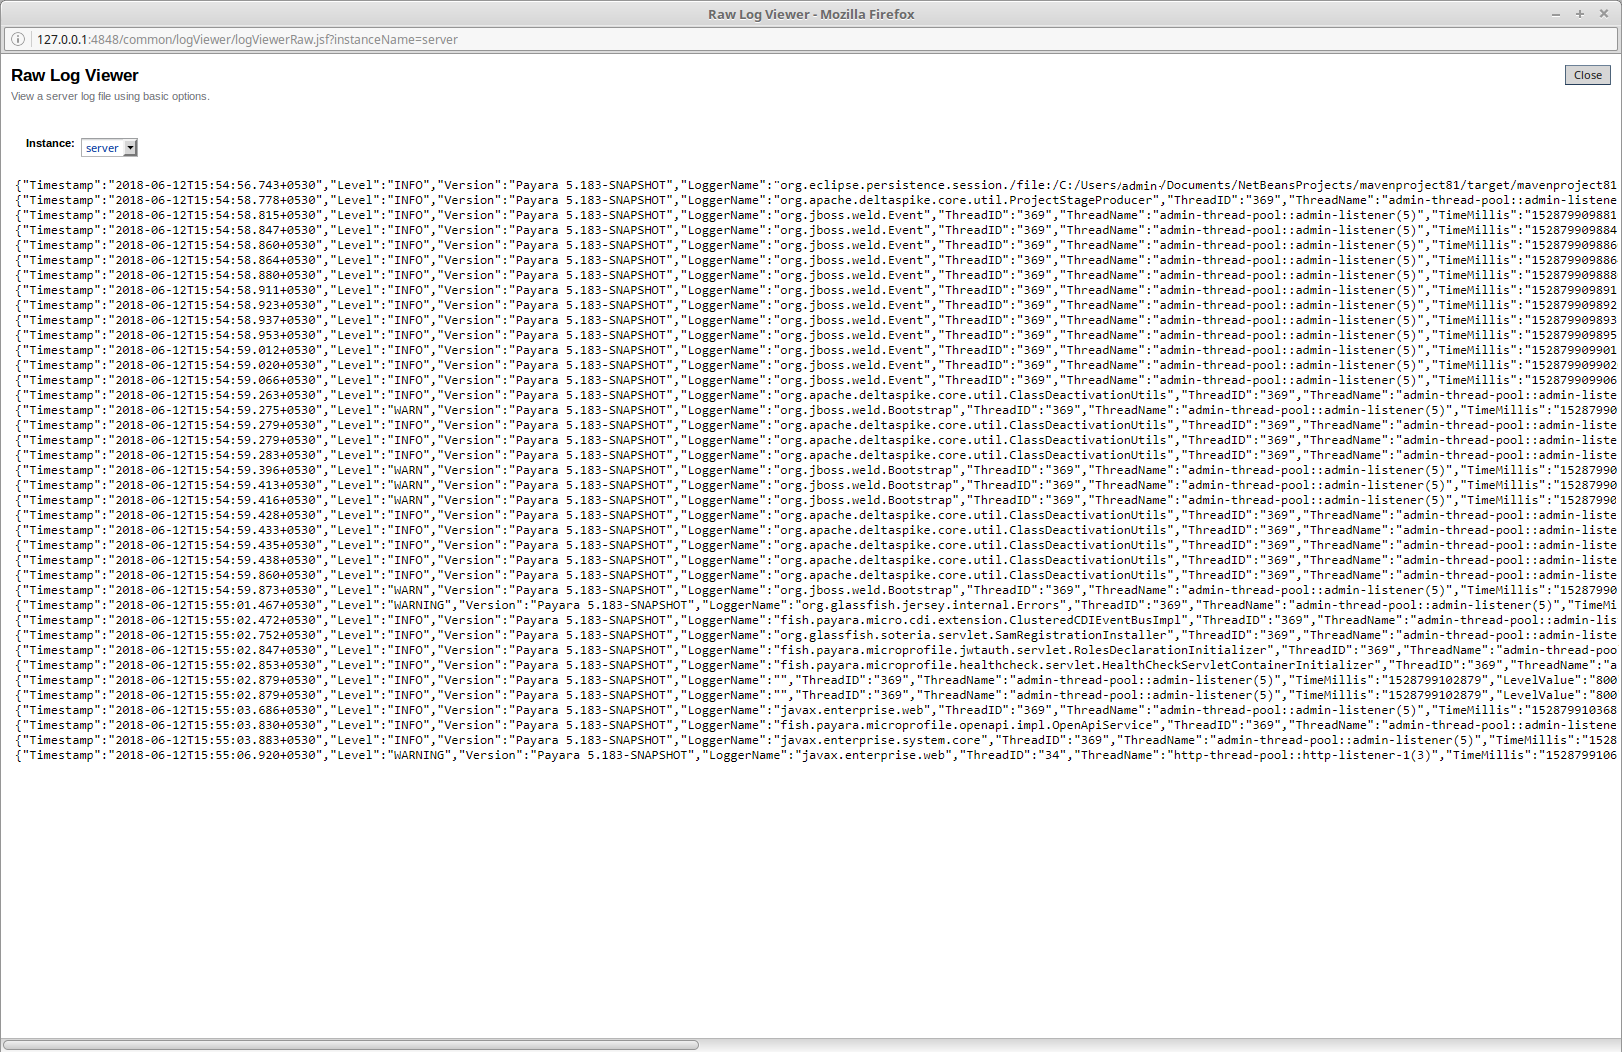
JSON Log Format
Besides the standard Uniform Log Format (ULF) and Oracle Diagnostics Logging (ODL) formats Payara Server provides a JSON format. With this format, every entry is formatted as a JSON object string. These entries can be easily processed by any JSON parser for further data processing.
Once the JSON formatter is enabled, the server’s log file may look similar to this sample:
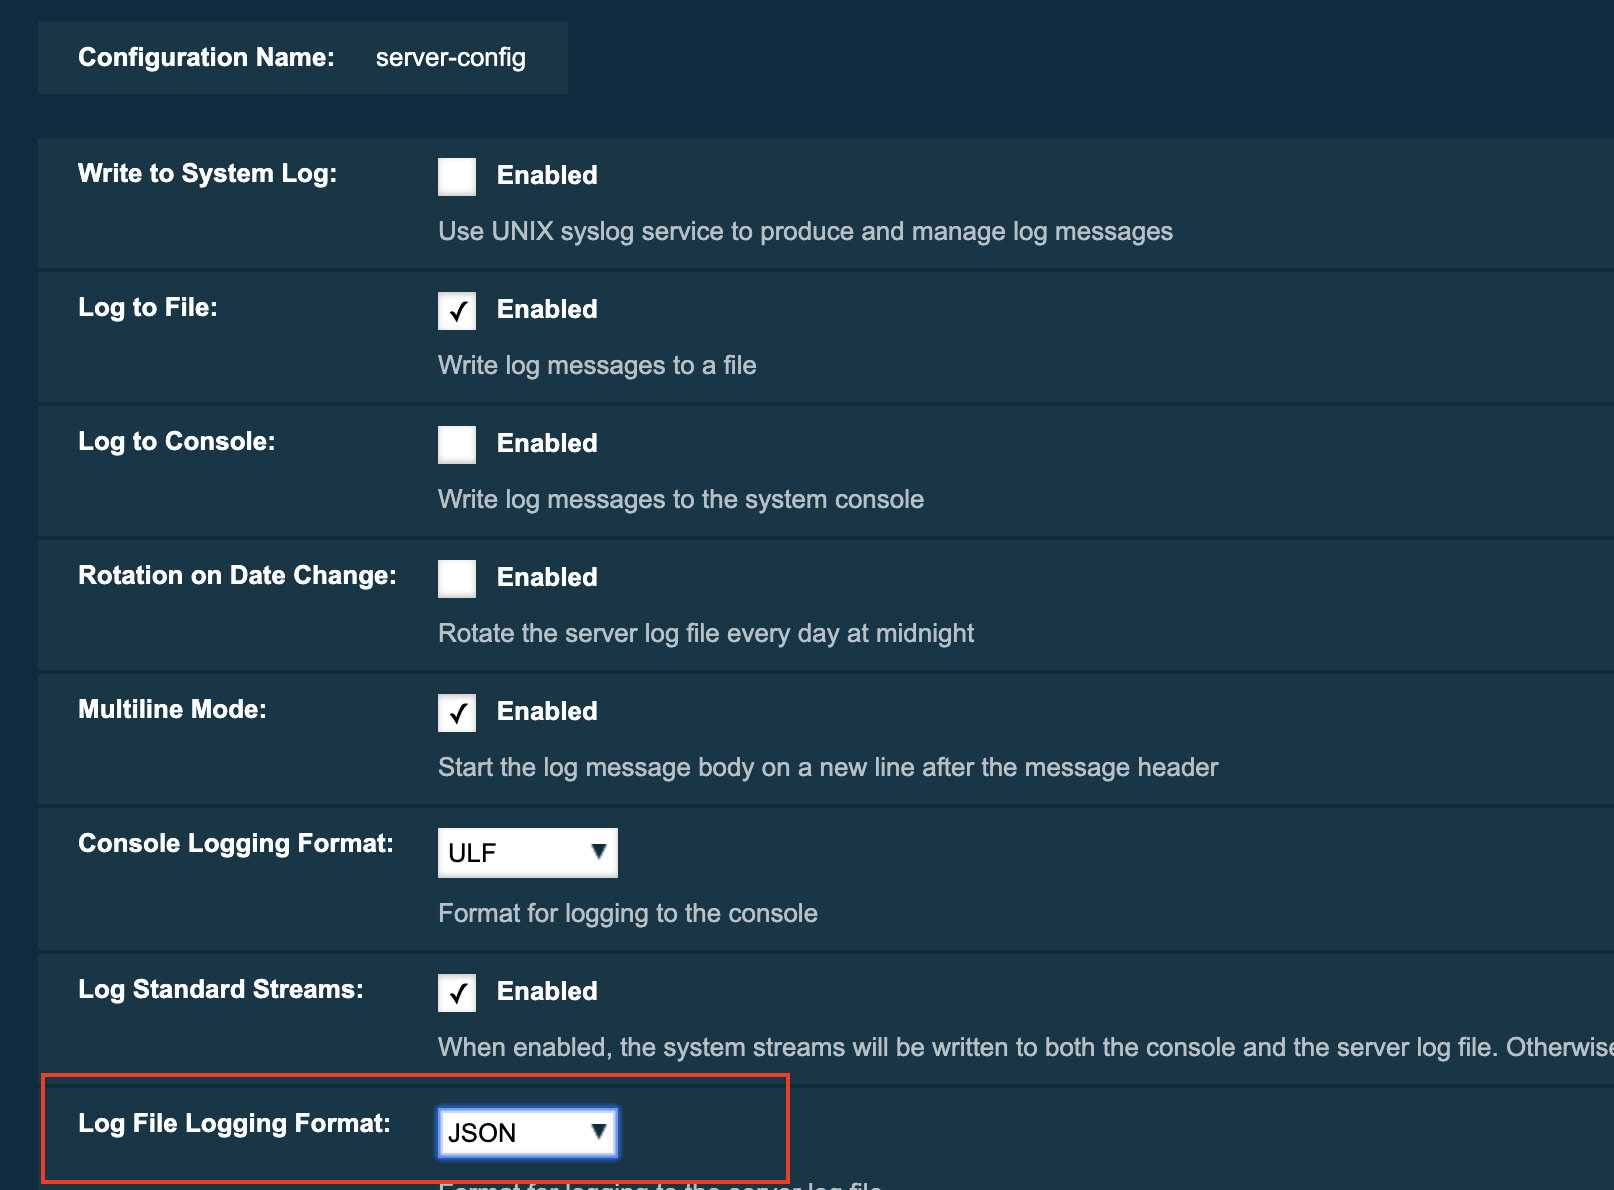
Enable the JSON formatter using the Web Admin Console
To enable the JSON formatter using the Admin Console, just select JSON from the list of Logging Formats, either for Console or Log File:
Enable the JSON formatter using the Asadmin CLI
The following command will enable the JSON formatter:
asadmin> set-log-attributes com.sun.enterprise.server.logging.GFFileHandler.formatter='fish.payara.enterprise.server.logging.JSONLogFormatter'Configure Prefixed field names
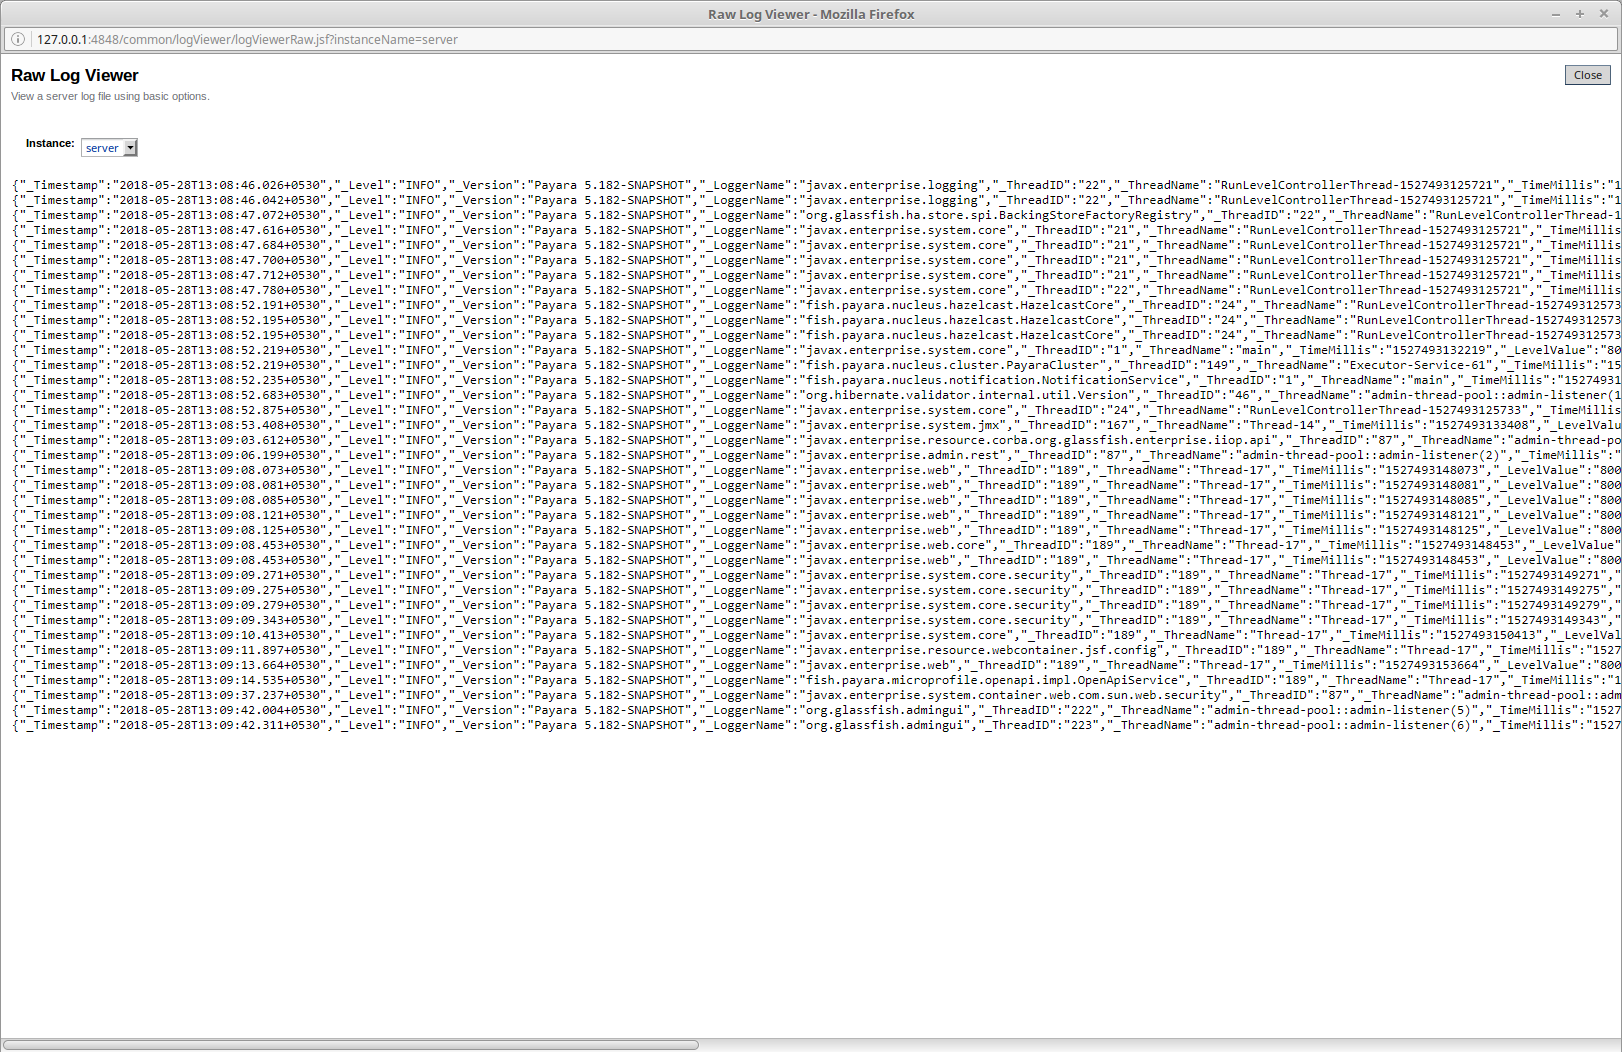
In some situations, the JSON representation of a log entry may use field names that clash with existing standard field names that logging gathering tools may use them for specific purposes.
To solve this problem, Payara Server can be configured to automatically prefix all field names in the JSON object representation with an underscore (_) character. See the following sample to get an idea of how such a JSON payload would look like:
The following Asadmin command will enable this configuration setting:
asadmin set-log-attributes fish.payara.deprecated.jsonlogformatter.underscoreprefix=trueSupport for Additional Fields
The JSON Log Formatter also supports the customization of additional fields through the setParameters method of the LogRecord class. This action is done when logging a new entry at runtime, so it is limited to an application business logic context.
Here’s a quick example of how to pass additional fields to the resulting JSON object by using a map with a single entry:
public class ApplicationComponent{

    public void businessMethod(){
        var lr = new LogRecord(Level.INFO, "Sample message");
        lr.setParameters(new Object[]{Collections.singletonMap("key", "value")});
        logger.log(lr);
    }
}
To Exclude Fields in Log Records
Use the set-log-attributes subcommand in remote mode to exclude specific name-value fields from log records. If the excludeFields attribute is not specified, all name-value fields are included.
The following fields can be excluded:
-
tid -
userId -
ecid -
timeMillis -
levelVal -
version
Follow these instructions:
-
Ensure that the target server or cluster is running.
Remote commands require a running server.
-
Exclude fields by using the
set-log-attributessubcommand, specifying the following attribute and the fields to exclude:com.sun.enterprise.server.logging.GFFileHandler.excludeFields=fieldswherefieldsis a comma-separated list of the name-value fields to exclude from the log file. -
To apply your change, restart Payara Server.
Example - To Exclude Fields in Log Records
This example excludes the userId and levelVal name-value fields in log records for standalone instance ManagedServer1:
asadmin set-log-attributes --target ManagedServer1
com.sun.enterprise.server.logging.GFFileHandler.excludeFields=userId,levelVal

com.sun.enterprise.server.logging.GFFileHandler.excludeFields logging attribute value set to userId,levelVal.
The logging attributes are saved successfully for ManagedServer1-config.

Command set-log-attributes executed successfully.
You can view the full syntax and options of the subcommand by typing asadmin help set-log-attributes at the command line.
To Set Multiline Mode
Use the set-log-attributes command in remote mode to set multiline
mode. When multiline mode is enabled (the default), the body of a log message starts on a new line after the message header and is indented.
-
Ensure that the target server or cluster is running.
Remote commands require a running server.
-
Set multiline mode by using the
set-log-attributessubcommand, specifying the following attribute and its value (trueorfalse):com.sun.enterprise.server.logging.GFFileHandler.multiLineMode=value -
To apply your change, restart Payara Server.
Example - To Set Multiline Mode
Multiline mode is enabled by default. The following example disables multiline mode in log files for standalone instance ManagedServer1:
asadmin set-log-attributes --target ManagedServer1

com.sun.enterprise.server.logging.GFFileHandler.multiLineMode=false
com.sun.enterprise.server.logging.GFFileHandler.multiLineMode logging attribute value set to false.
The logging attributes are saved successfully for ManagedServer1-config.

Command set-log-attributes executed successfully.
You can view the full syntax and options of the subcommand by typing asadmin help set-log-attributes at the command line.
Setting Log File Rotation
As explained in Log Files, Payara Server by default rotates log files when they reach 2 MB in size.
However, you can change the default rotation settings. For example, you can change the file size at which the server rotates the log file, or you can configure a server to rotate log files based on a time interval.
In addition to changing when rotation occurs, you can also:
-
Specify the maximum number of rotated files that can accumulate.
By default, Payara Server does not limit the number of rotated log files that are retained. However, you can set a limit.
After the number of log files reaches this limit, subsequent file rotations delete the oldest rotated log file.
-
Rotate the log file manually.
A manual rotation forces the immediate rotation of the target log file.
Changing the default log rotation settings is done using the set-log-attributes subcommand, and rotating log files manually is done using the rotate-log subcommand.
To Change the Rotation File Size
Use the set-log-attributes subcommand in remote mode to change the log rotation file size. The default target of this subcommand is the DAS.
Optionally, you can target a configuration, server, instance, or cluster. The minimum size that can be set is 500 KB.
-
Ensure that the target server or cluster is running.
-
Change the rotation file size limit by using the
set-log-attributessubcommand, specifying the following attribute and the desired limit in bytes:com.sun.enterprise.server.logging.GFFileHandler.rotationLimitInBytes=bytes -
To apply your change, restart Payara Server.
Example - To Change the Rotation File Size
The following example sets the log file rotation size to 1 MB for the standalone instance ManagedServer1:
asadmin set-log-attributes --target ManagedServer1
com.sun.enterprise.server.logging.GFFileHandler.rotationLimitInBytes=1000000

com.sun.enterprise.server.logging.GFFileHandler.rotationLimitInBytes
logging attribute set with value 1000000.
These logging attributes are set for ManagedServer1.
ManagedServer1 :
com.sun.enterprise.server.logging.GFFileHandler.rotationLimitInBytes
logging attribute set with value 1000000.
These logging attributes are set for ManagedServer1.

Command set-log-attributes executed successfully.
You can view the full syntax and options of the subcommand by typing asadmin help set-log-attributes at the command line.
To Change the File Rotation Interval
Use the set-log-attributes subcommand in remote mode to change the log file rotation time limit interval. The default target of this subcommand is the DAS. Optionally, you can target a configuration, server, instance, or cluster. The default value is 0.
-
Ensure that the target server or cluster is running.
-
Change the rotation time limit by using the
set-log-attributessubcommand, specifying the following attribute and the desired limit in minutes:com.sun.enterprise.server.logging.GFFileHandler.rotationTimelimitInMinutes=minutes -
To apply your change, restart Payara Server.
Example - To Change the File Rotation Interval
The following example sets the log file rotation time limit for the cluster Cluster1, which has the instances ClusterServer1 and ClusterServer2.
asadmin set-log-attributes --target Cluster1
com.sun.enterprise.server.logging.GFFileHandler.rotationTimelimitInMinutes=10

com.sun.enterprise.server.logging.GFFileHandler.rotationTimelimitInMinutes
logging attribute set with value 10.
These logging attributes are set for Cluster1.
ClusterServer1 :
com.sun.enterprise.server.logging.GFFileHandler.rotationTimelimitInMinutes
logging attribute set with value 10.
These logging attributes are set for Cluster1.

ClusterServer2 :
com.sun.enterprise.server.logging.GFFileHandler.rotationTimelimitInMinutes
logging attribute set with value 10.
These logging attributes are set for Cluster1.

Command set-log-attributes executed successfully.
You can view the full syntax and options of the subcommand by typing asadmin help set-log-attributes at the command line.
To Change the Limit Number of Retained Files
Use the set-log-attributes subcommand in remote mode to change the limit on the number of log files that the server creates to store old log messages. The default target of this subcommand is the DAS.Optionally, you can target a configuration, server, instance, or cluster. The default limit value is 0, which results in no limit placed on the number of rotated log files that are retained.
-
Ensure that the target server or cluster is running.
-
Change the limit number of retained log files by using the
set-log-attributessubcommand, specifying the following attribute and the desired file limit number:com.sun.enterprise.server.logging.GFFileHandler.maxHistoryFiles=minutes
The behavior of the com.sun.enterprise.server.logging.GFFileHandler.maxHistoryFiles attribute is as follows:
-
If the property is not set, Payara Server keeps a maximum of 10 rotated log files.
-
If the property is set to an invalid number or null, Payara Server keeps a maximum of 10 rotated log files.
-
If the property is set to 0, Payara Server retains all rotated log files (that is, sets no maximum).
-
To apply your change, restart Payara Server.
-
Example - To Change the Limit Number of Retained Files
The following example sets the log limit number of retained log files for the DAS to 10.
asadmin set-log-attributes

com.sun.enterprise.server.logging.GFFileHandler.maxHistoryFiles=10
com.sun.enterprise.server.logging.GFFileHandler.maxHistoryFiles
logging attribute set with value 10.
These logging attributes are set for server.
Command set-log-attributes executed successfully.
You can view the full syntax and options of the subcommand by typing asadmin help set-log-attributes at the command line.
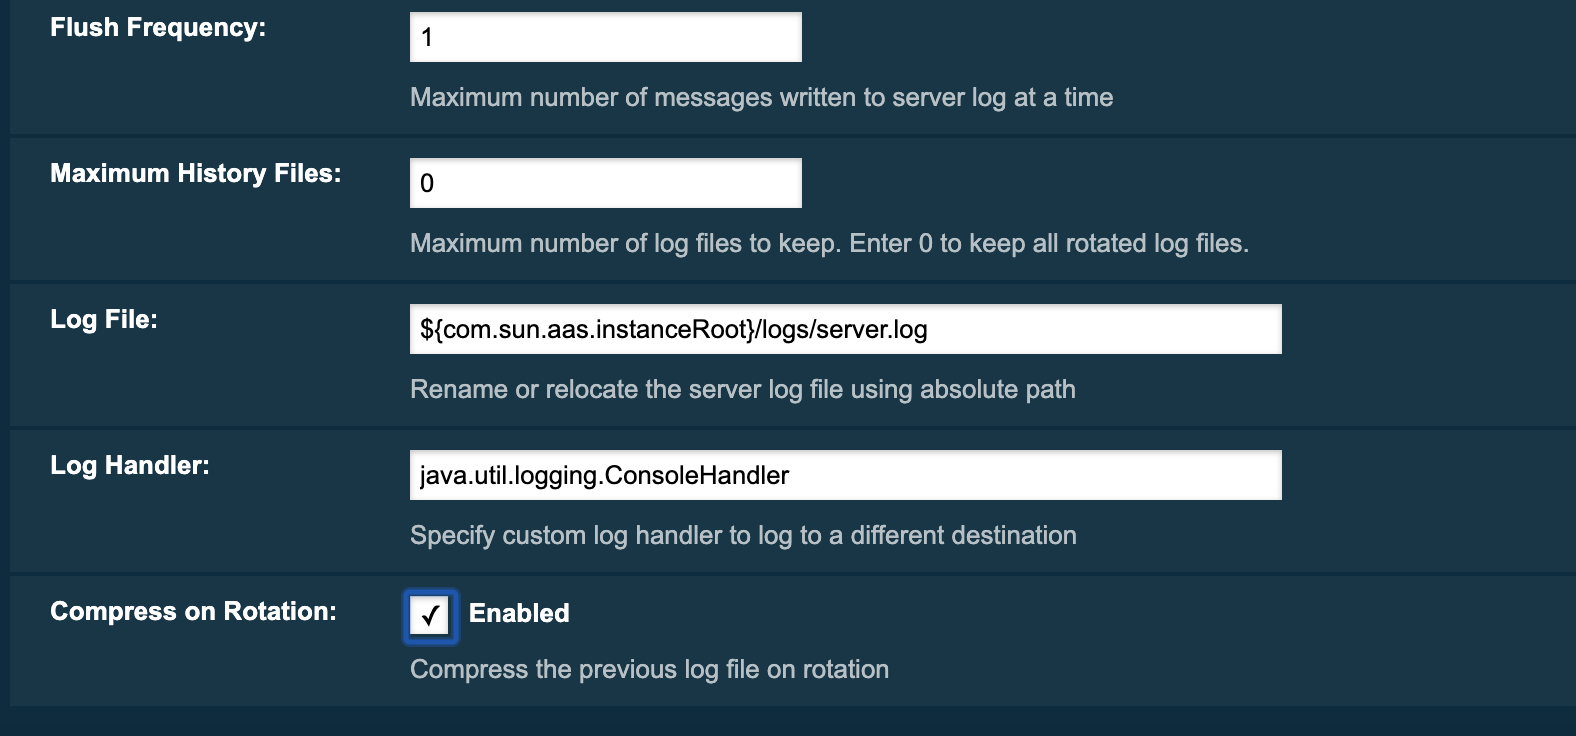
Log File Compression on Rotation
Payara Server can be configured to automatically compress rotated log files in an automatic manner to save disk space.
To Rotate Log Files Manually
You can rotate log files manually by using the rotate-log subcommand in remote mode. The default target of this subcommand is the DAS. Optionally, you can target a configuration, server, instance, or cluster. When you use this subcommand, the target log file is immediately moved to a new time-stamped file and a new log file is created.
Because log rotation is a dynamic operation, you do not need to restart Payara Server for changes to take effect.
-
Ensure that the target server or cluster is running.
-
Rotate log files by using the
rotate-logsubcommand.
Example - To Rotate Log Files Manually
The following example rotates the server.log file for ManagedServer2 to server.log_`yyyy-mm-dd`T`hh-mm-ss, where yyyy-mm-dd`T`hh-mm-ss represents the time when the file is rotated, and creates a new server.log file in the default location.
asadmin> rotate-log --target ManagedServer2
Command rotate-log executed successfully.
You can view the full syntax and options of the subcommand by typing asadmin help rotate-log at the command line.
Adding a Custom Logging Handler
By default, Payara Server log records are captured in a server log file using the format described in Log Records.
However, you may find that you want to log messages to a different location, such as a database or a remote server, or log messages from specific loggers to your own file. This can be done by implementing a custom log handler.
This section explains how to add a custom log handler to the Payara Server logging service.
To Add a Custom Log Handler
A comma-separated list of log handlers is installed during startup of the Java Virtual Machine (JVM) host. The default log handler that is provided in the logging.properties file, ConsoleHandler, is configured as follows:
handlers=java.util.logging.ConsoleHandlerIn Payara Server, the best approach to developing a custom handler is to define a Hundred-Kilobyte Kernel (HK2) component that implements the handler contract. Payara Server registers this handler automatically because it is an HK2 component. There is no task required of the administrator.
The custom handler class should be packaged in an OSGi module and the JAR file placed in the as-install/modules directory.
|
To configure a custom handler that is not developed as an HK2 component, add the new handler to the logging.properties file after the developer has put the custom handler JAR file into the domain-dir/lib/ext directory.
Before You Begin
If you set a handler by setting the handlers attribute in the logging properties file, the class that extends java.util.logging.Handler must be in the server classpath.
-
Ensure that the target server or cluster is running. Remote subcommands require a running server.
-
Use the
set-log-attributessubcommand to add the handler to thehandlersattribute.The default target of this subcommand is the DAS. Optionally you can target a configuration, server, instance, or cluster.
-
To apply your changes, restart Payara Server.
Example - To Add a Custom Log Handler
This example adds the custom logger com.example.logging.MyHandler to the logging properties file of the DAS.
asadmin set-log-attributes handlers=java.util.logging.ConsoleHandler,com.example.logging.MyHandler

handlers logging attribute set with value java.util.logging.ConsoleHandler,com.example.logging.MyHandler.
These logging attributes are set for server.

Command set-log-attributes executed successfully.
You can view the full syntax and options of the subcommand by typing asadmin help set-log-attributes at the command line.
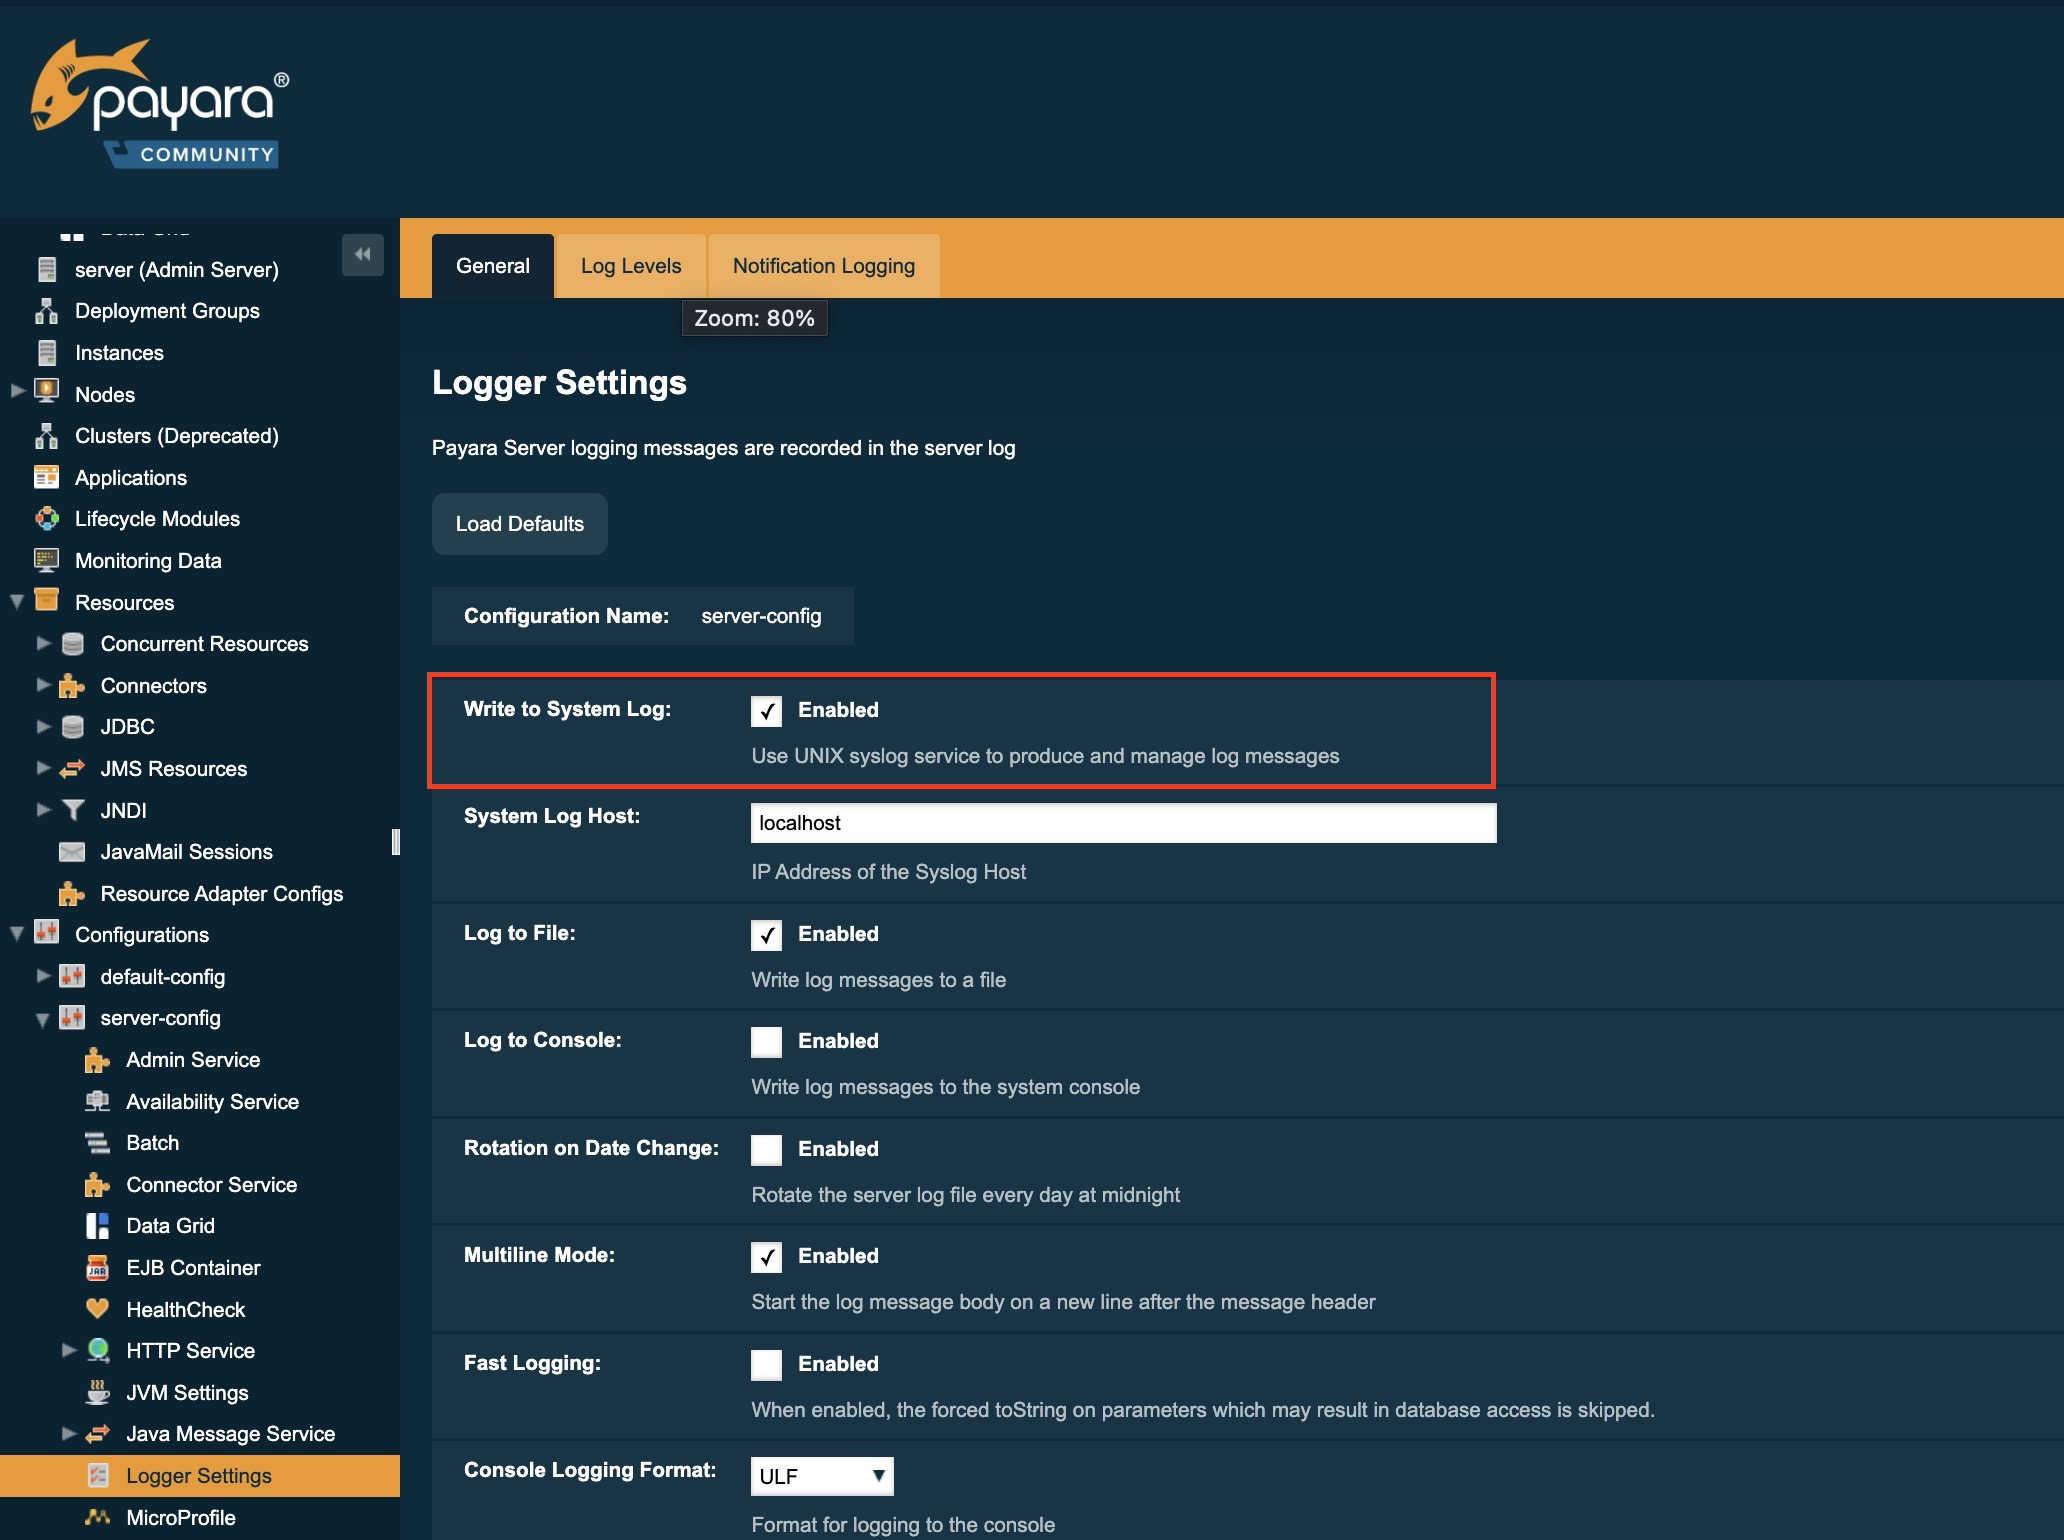
Write to System Log
The Write to System Log option allows you to enable and disable the action of logging to the system log. Disabling this option should help to minimize disk usage.
Enable Write to System Log using the Admin Console
To configure the Write to System Log option using the Admin Console:
Enable Write to System Log using the Asadmin CLI
Use the following command to enable or disable the Write to System Log feature:
asadmin set-log-attributes com.sun.enterprise.server.logging.SyslogHandler.useSystemLogging=true
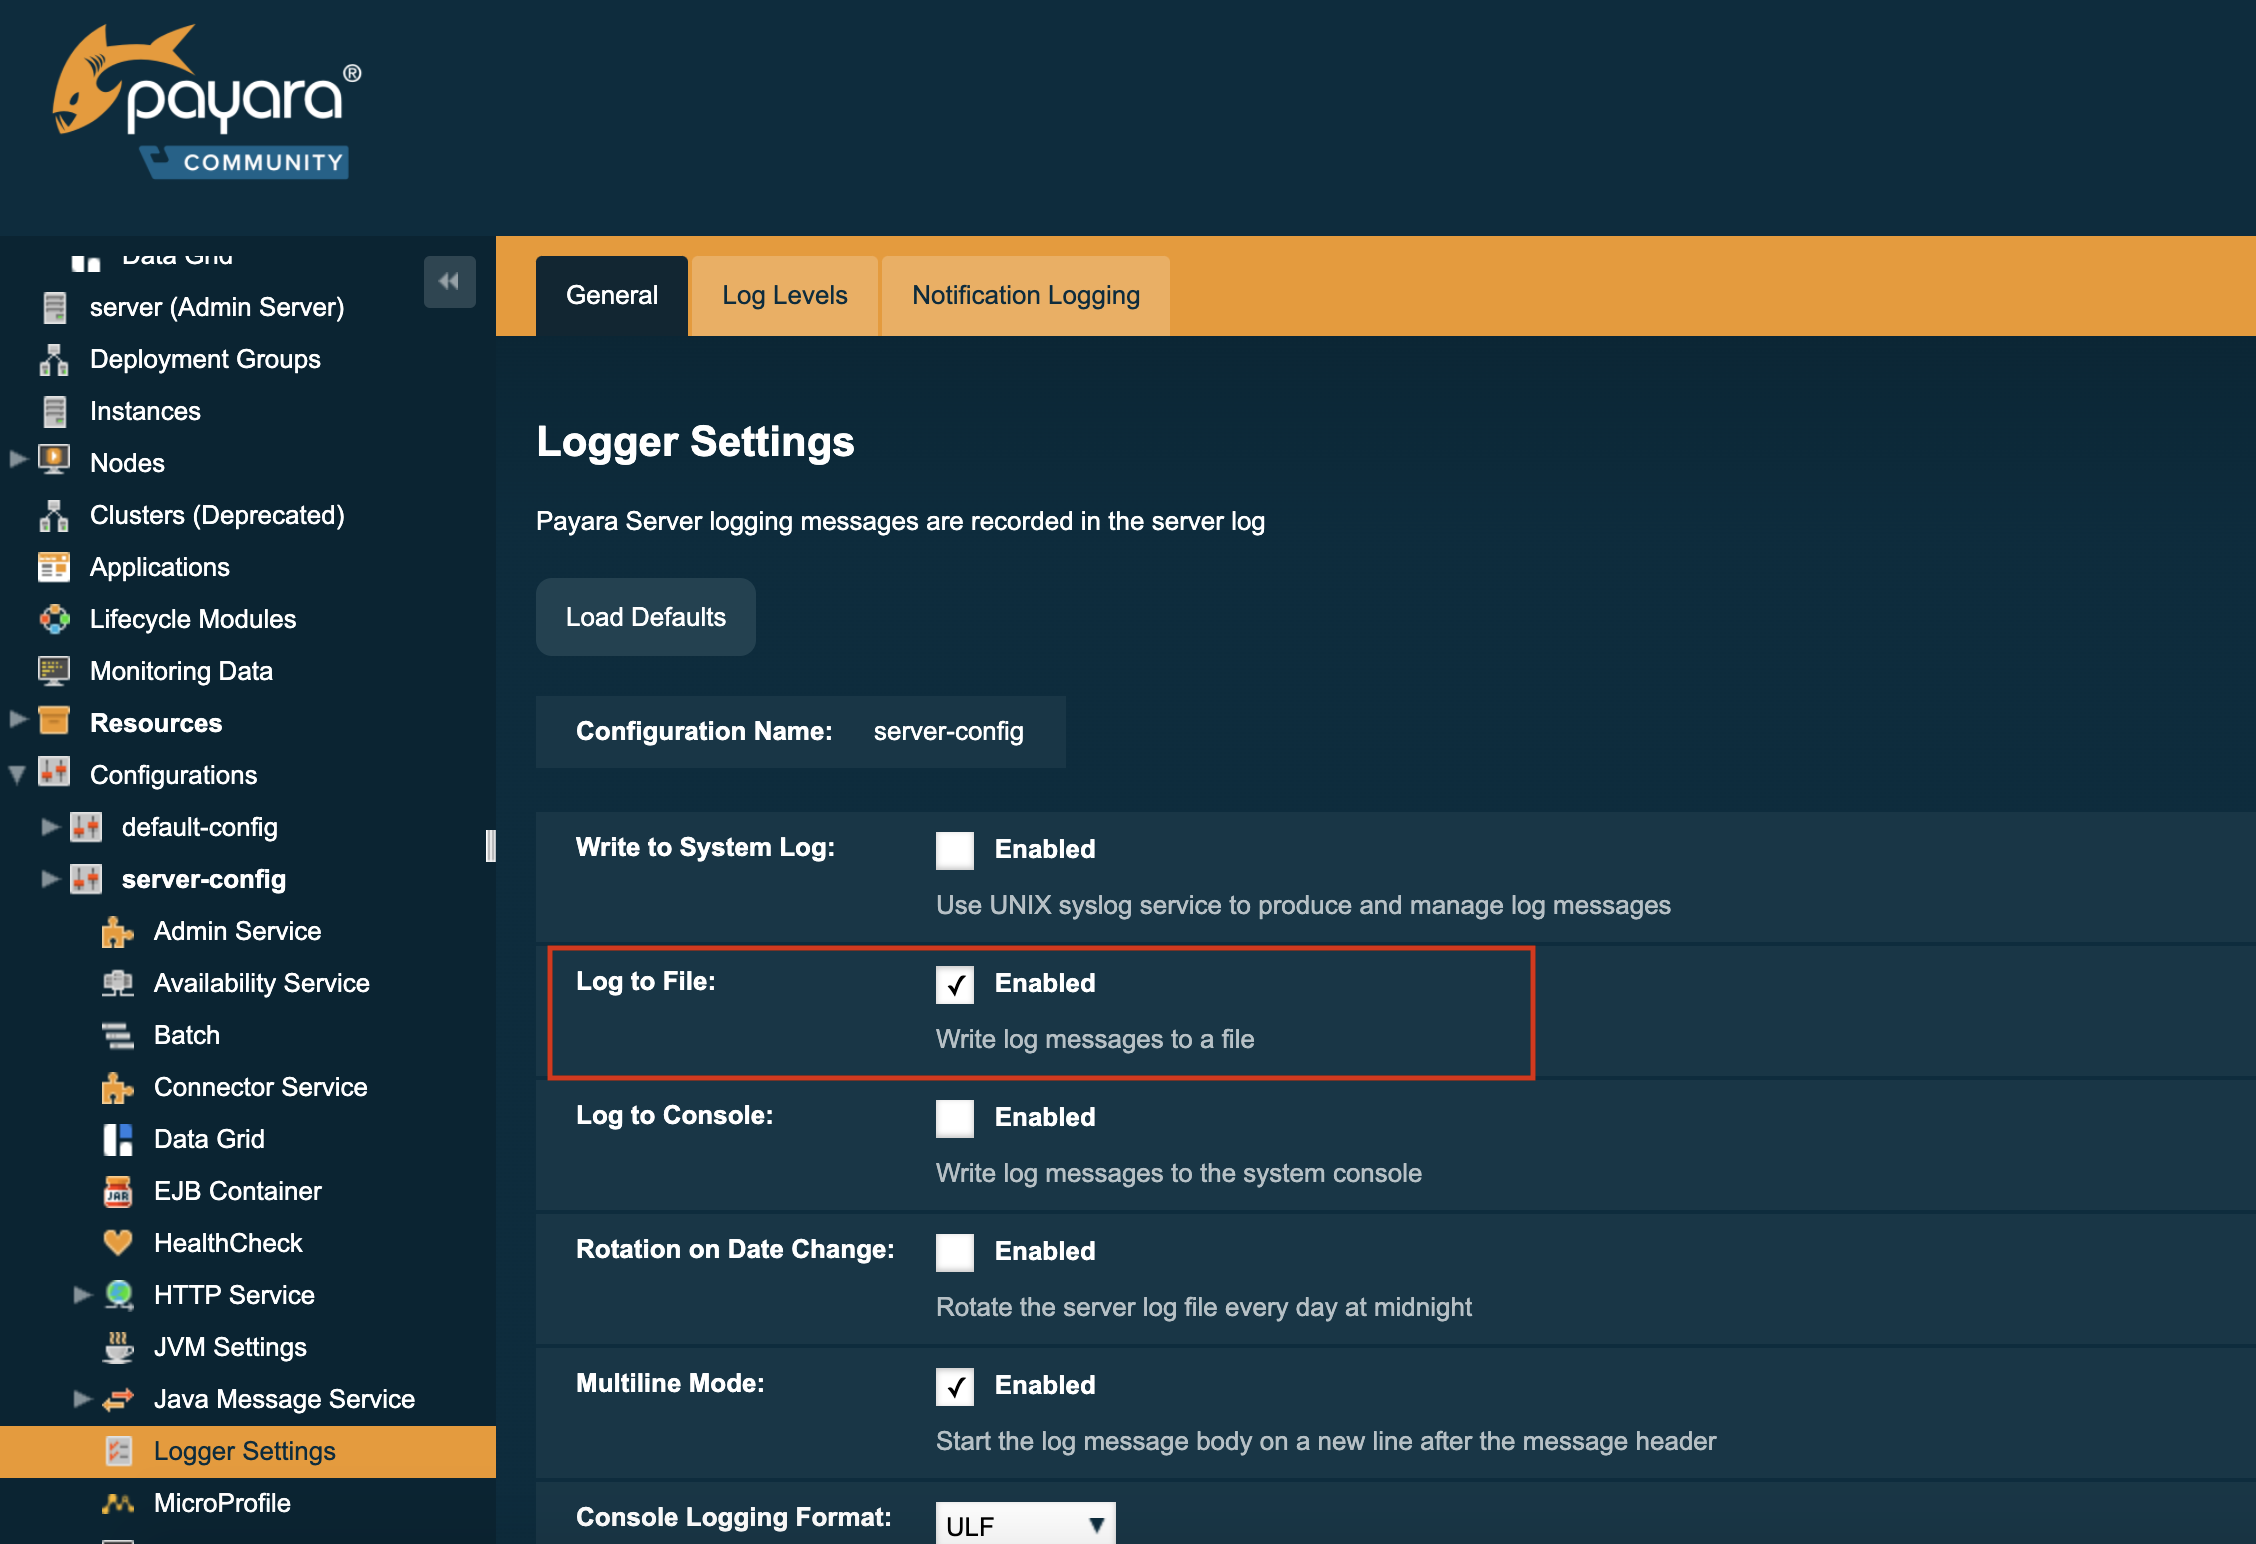
Log to File
The Log to File option allow you to enable and disable the action of logging to a file. When disabled this should help to minimize disk usage.
| This option will be more accommodating if Payara Server is running in cloud environment where disk space is scarce. |
Log To Console
The Log to Console option controls if the server writes the logging entries directly to the console. The property only has an effect when the server or instance is started in verbose mode.
To enable the log to console option you simply have to start the domain or instance using the verbose option:
asadmin start-domain --verboseWhen the server or domain is not started in verbose mode, the java.util.ConsoleHandler will not be active for logging, although it is defined as handler in the logging.properties file because there is no console attached with the corresponding server process.
When in verbose mode, the Log to Console option will also be active, regardless of the initial value set in the logging.properties file as otherwise, no log output would be visible on the console.
|
Once the server is run in verbose mode, you can use either the Admin Console or the Asadmin CLI to modify this setting.
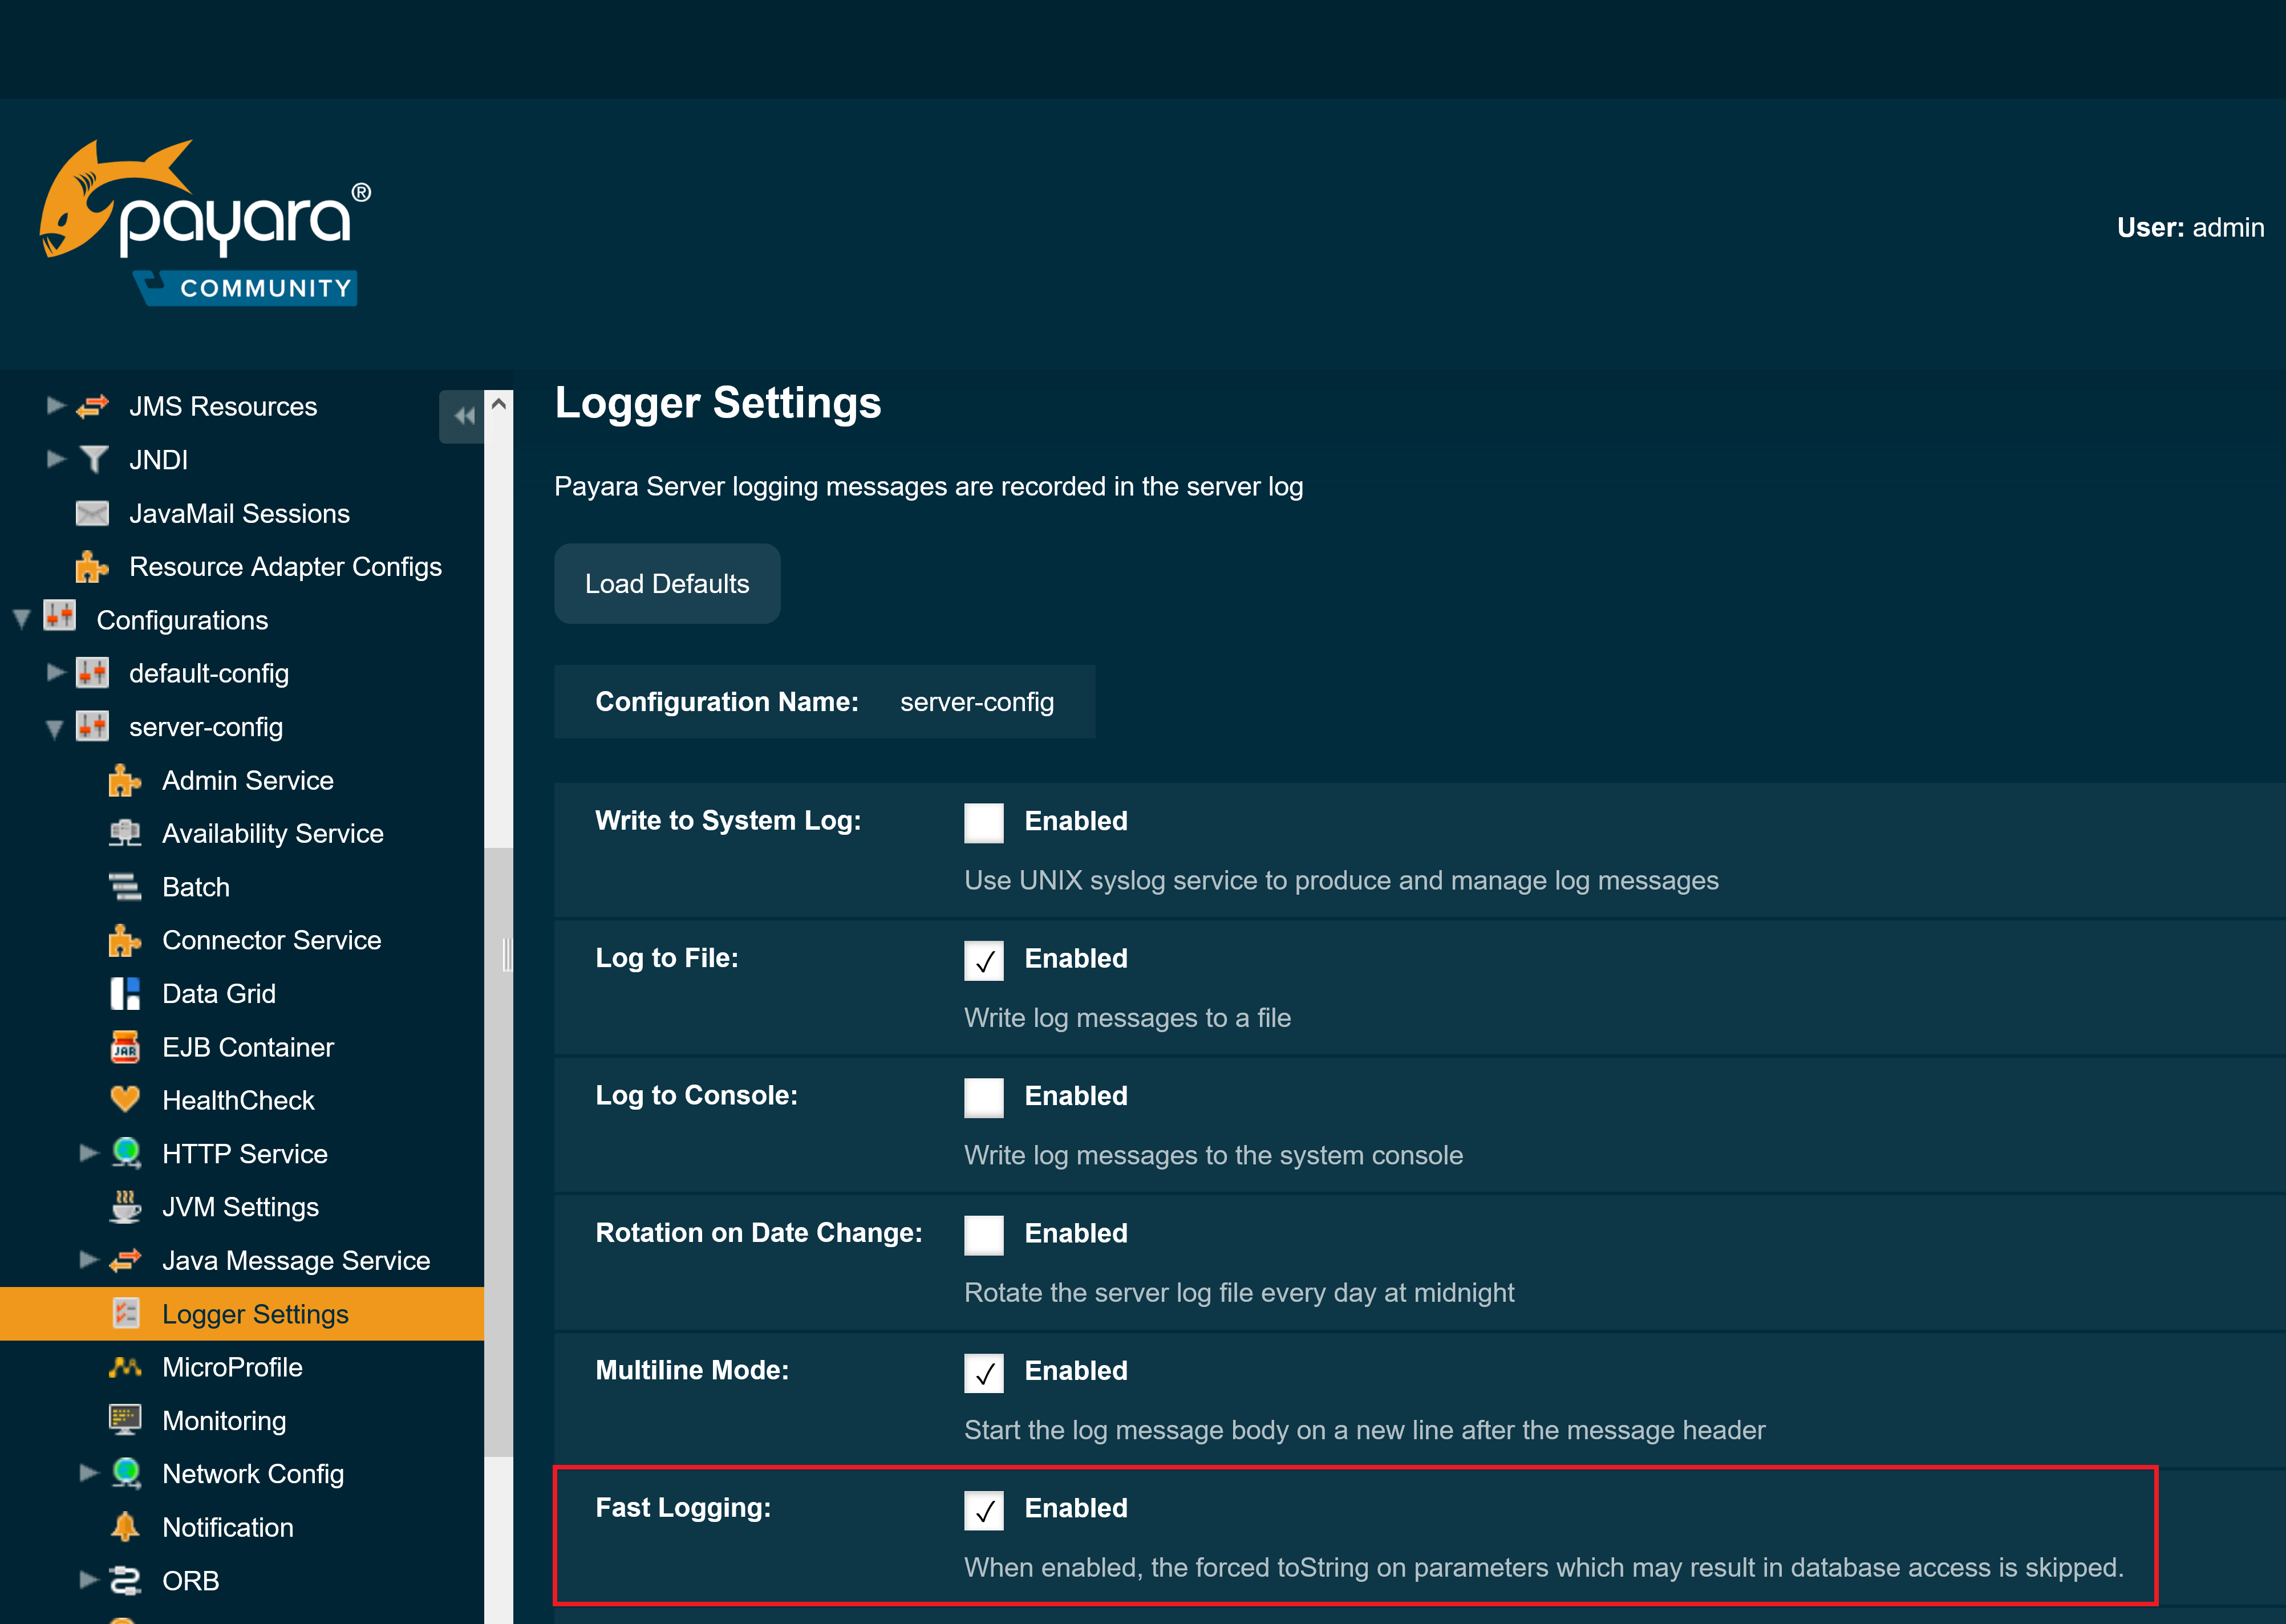
Fast Logging
Whenever logging occurs on an application, if the LogRecord in question contains set parameters, they will undergo a forced transformation by having a toString() method call.
In most cases this is the desirable outcome, but will not provide the best performance. You can enable the Fast Logging setting to skip this forced parameter transformation at runtime.
A common use case of this feature would be to prevent database access done by JPA entities, as it is a common occurrence for entity data to be logged out for auditing purposes.
|
Enabling this setting can cause log entries that contain mutable parameters to be out of sync when they are resolved. Exert caution when using fast logging, as it may cause stale information to be printed out to the log. |
Environment Variable Support
The logging.properties configuration file supports environment variable substitution like in this example:
.level=${ENV=logLevel}Whenever the server starts up or the logging properties are updated, the value for the .level property will be taken from the environment variable logLevel.
Viewing Log Records
The recommended means for general viewing of logging information is to use the Log Viewer in the Administration Console. The Log Viewer simplifies reading, searching, and filtering log file contents. For instructions, see the Administration Console online help.
Payara Server also allows you to collect log files into a ZIP archive, which provides the means to obtain and view log files for an instance or cluster even when it is not currently running.
The following section explains how to collect all available log files for an instance or cluster and compile them into a single ZIP archive, which is done by using the collect-log-files subcommand.
To Collect Log Files into a ZIP Archive
Use the collect-log-files subcommand in remote mode to collect log files into a ZIP archive. The default target of this subcommand is the DAS. Optionally you can target a configuration, server, instance, or cluster.
-
Ensure that the target server or cluster is running.
Remote subcommands require a running server.
-
Use the
collect-log-filessubcommand to create the ZIP archive.The default location in which the ZIP archive is created is the
domain-dir/collected-logsdirectory. Thecollect-log-filessubcommand allows you to specify a non-default directory in which the ZIP archive is to be created by using the--retrieveoption set totrue, followed by the directory name.The name of the ZIP file contains the timestamp, as follows:
log_`yyyy-mm-dd_hh-min-sec.zip`
Example - To Collect Log Files into a .zip Archive
This example shows collecting the log files for the cluster MyCluster and compiling them into a ZIP archive in the /space/output directory.
asadmin collect-log-files --target MyCluster --retrieve true /space/output

Log files are downloaded for ClusterServer1.
Log files are downloaded for ClusterServer2.
Created Zip file under /space/output/log_2011-02-10_13-35-25.zip.

Command collect-log-files executed successfully.
When the ZIP file created by the preceding command is uncompressed, the following directory structure is created:
as-install-parent/
       glassfish/
            domains/
                domain-dir/
                       collected_logs/
                                    logs/
                                       ClusterServer1/
                                                    server.log
                                       ClusterServer2/
                                                    server.log
You can view the full syntax and options of the subcommand by typing asadmin help collect-log-files at the command line.
Listing Loggers
You can list and view information about all public loggers in your distribution of Payara Server.
To List Loggers
Use the list-loggers subcommand in remote mode to list the logger name, subsystem, and description of loggers in your distribution of Payara Server. Internal loggers are not listed.
-
Ensure that the target server or cluster is running.
Remote commands require a running server.
-
List loggers by using the
list-loggerssubcommand.
Example - To List Loggers
This example lists the logger name, subsystem, and description for each logger. Some lines of output are omitted from this example for readability.
asadmin list-loggers

Logger Name                            Subsystem         Logger Description
...
jakarta.enterprise.monitoring            Monitoring        Monitoring Logger
jakarta.enterprise.system.core.ee        AS-CORE           Jakarta EE Core Kernel
jakarta.enterprise.system.jmx            JMX               JMX System Logger
jakarta.enterprise.system.tools.admin    ADMIN             Administration Services
...
Command list-loggers executed successfully.
You can also view the full syntax and options of the subcommand by typing asadmin help list-loggers at the command line.
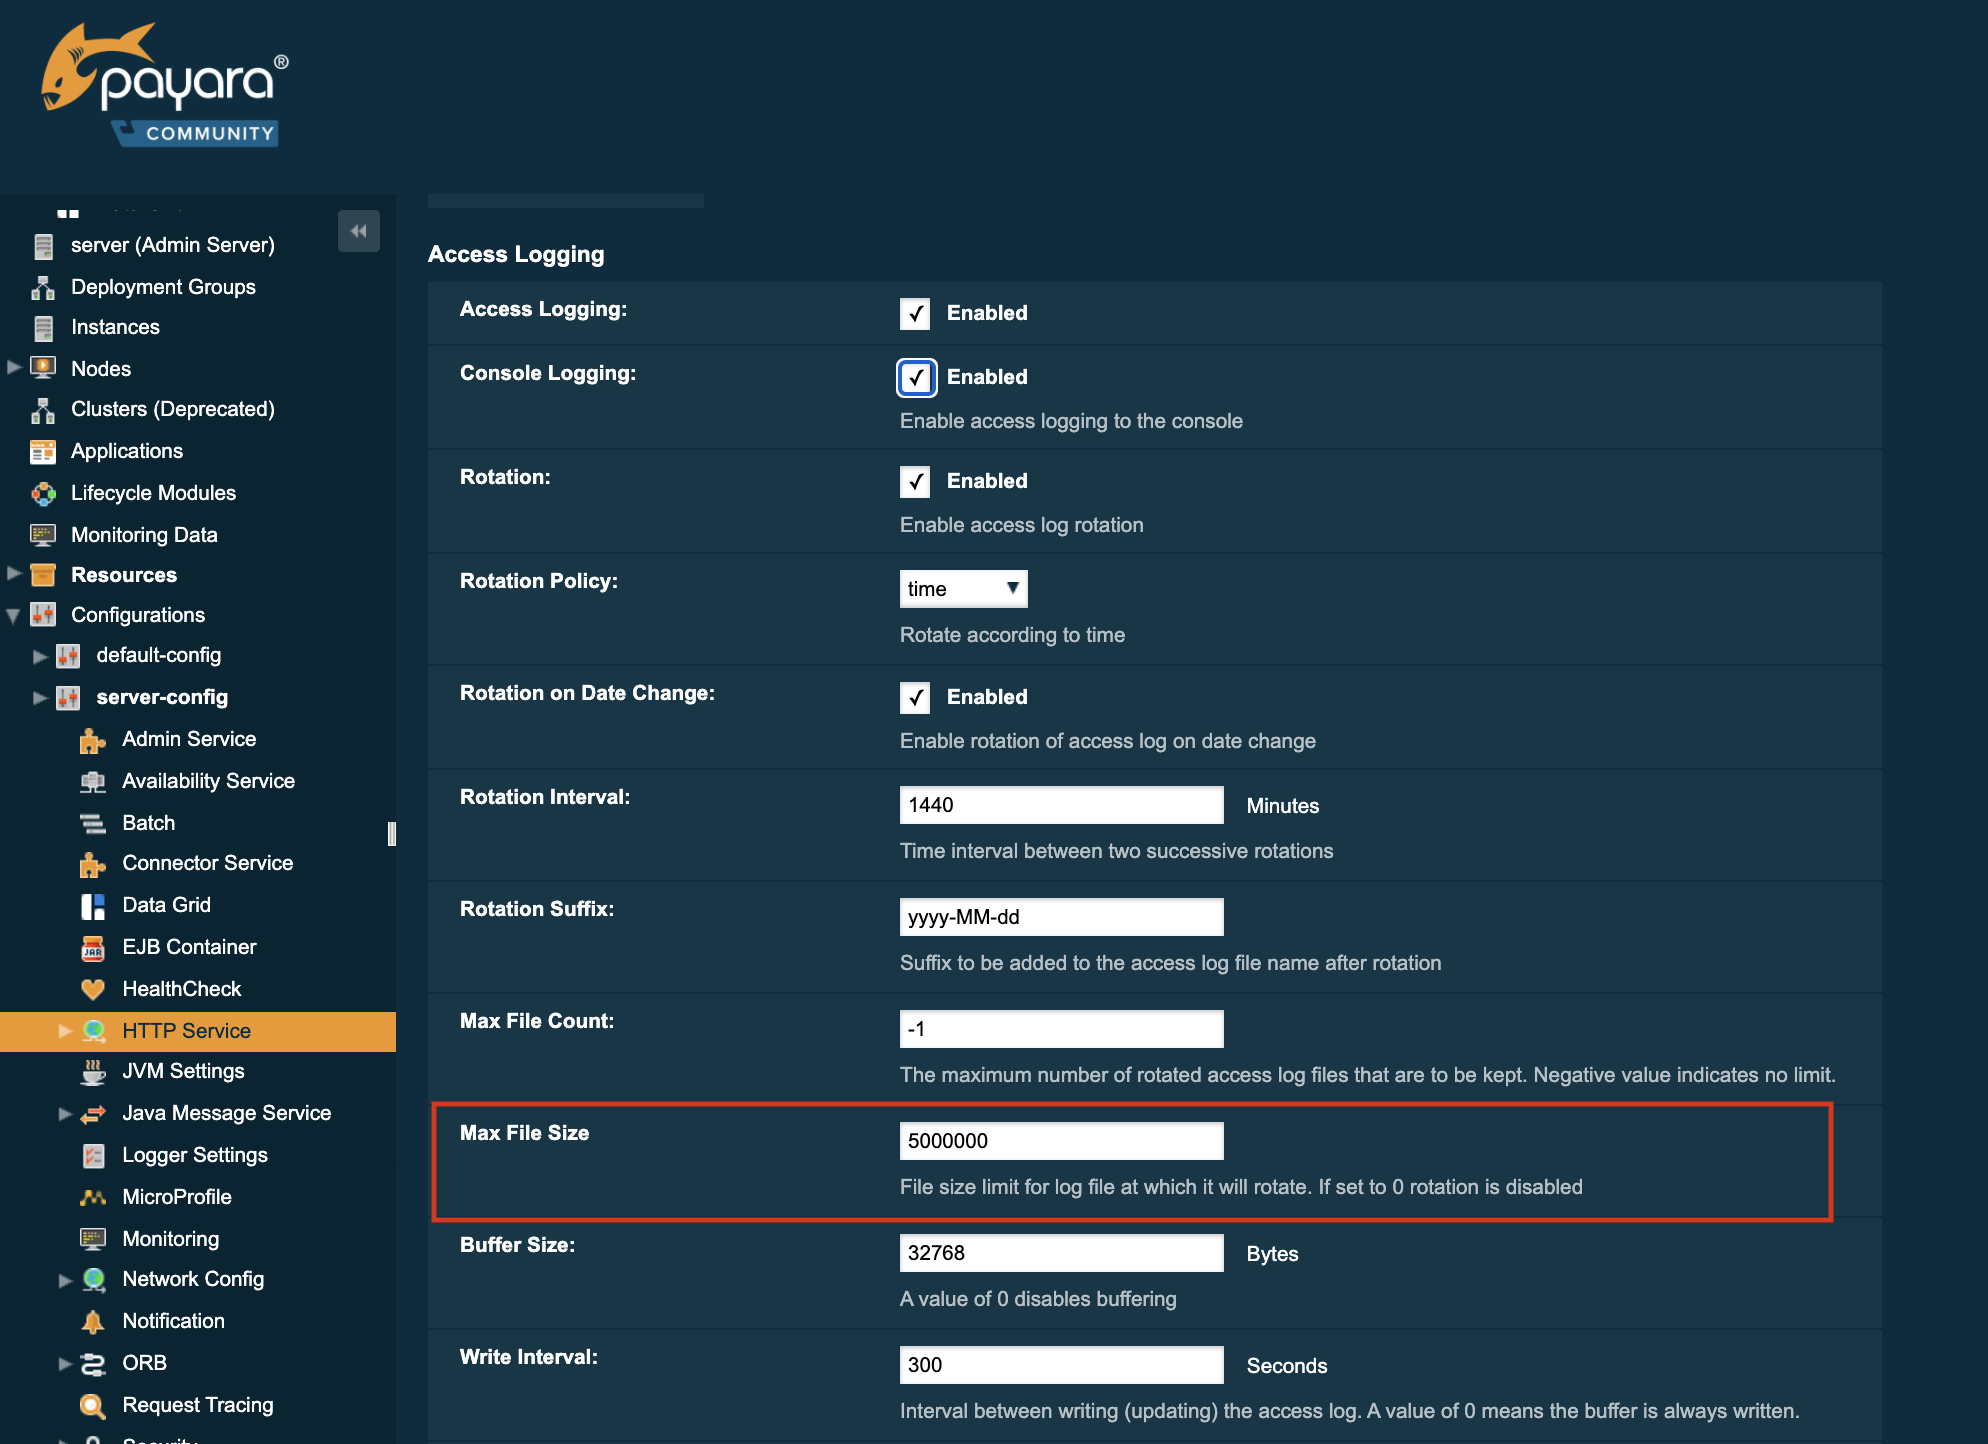
Access Logging Max File Size
Payara Server provides different ways to rotate HTTP access log files. This section will detail the use of the max size of the log file to trigger a rotation.
The Max File Size option provides a way to change the file size at which the server rotates the access log file. This option accepts an integer value specifying the maximum size of the log file, after which a file rotation will occur.
If the value for this option is set to 0, HTTP access log rotation will be disabled.
|
Using the Asadmin CLI
Use the following command to set maximum file size option:
asadmin> set configs.config.server-config.http-service.access-log.maximum-file-size=5000000For more information on how to configure HTTP Access logging, see Administering HTTP Configurations.
Notification Service Logging
The Notification Service captures information about events which come from other services, such as the JMX Monitoring Service, the HealthCheck service or the Request Tracing service and captures this information so that all configured notifiers can redirect these events. The Log Notifier, turned on by default, will print these notifications events in the server’s log.
It is possible to configure the Log Notifier to store its output in a separate log file.
If this setting is enabled, the default log file will be found at domain-dir/logs/notification.log
|
The Notification Logging Service uses its own collection of logging properties which are separate from the standard logging facilities of Payara Server. However, they are stored in the same configuration file.
Configuring the Notification Logging Service
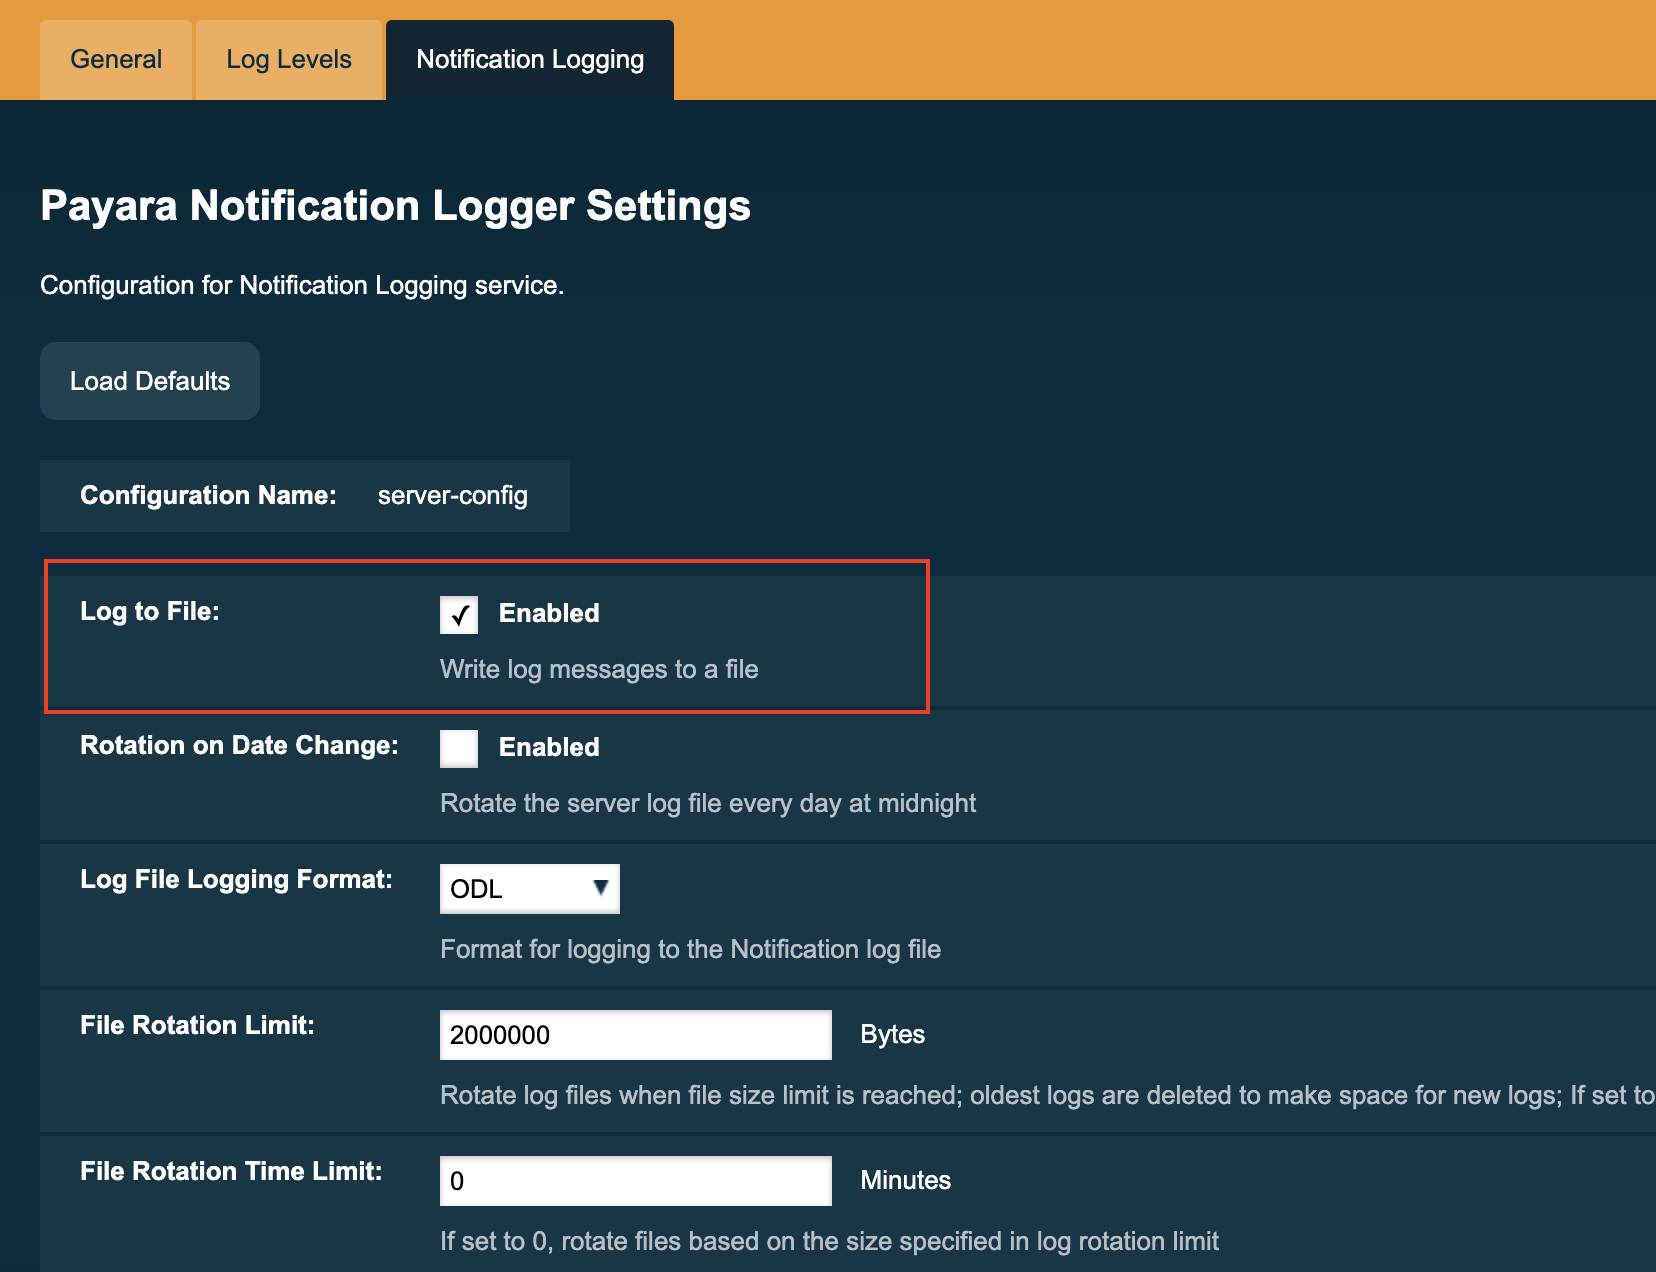
Enabling or Disabling Logging to a File
The Log to File option will provide a way to enable and disable logging to a file of Payara Server Notifications. When disabled this should help to minimize disk usage. This option will be more accommodating if Payara Server is running in cloud environment where disk space is scarce.
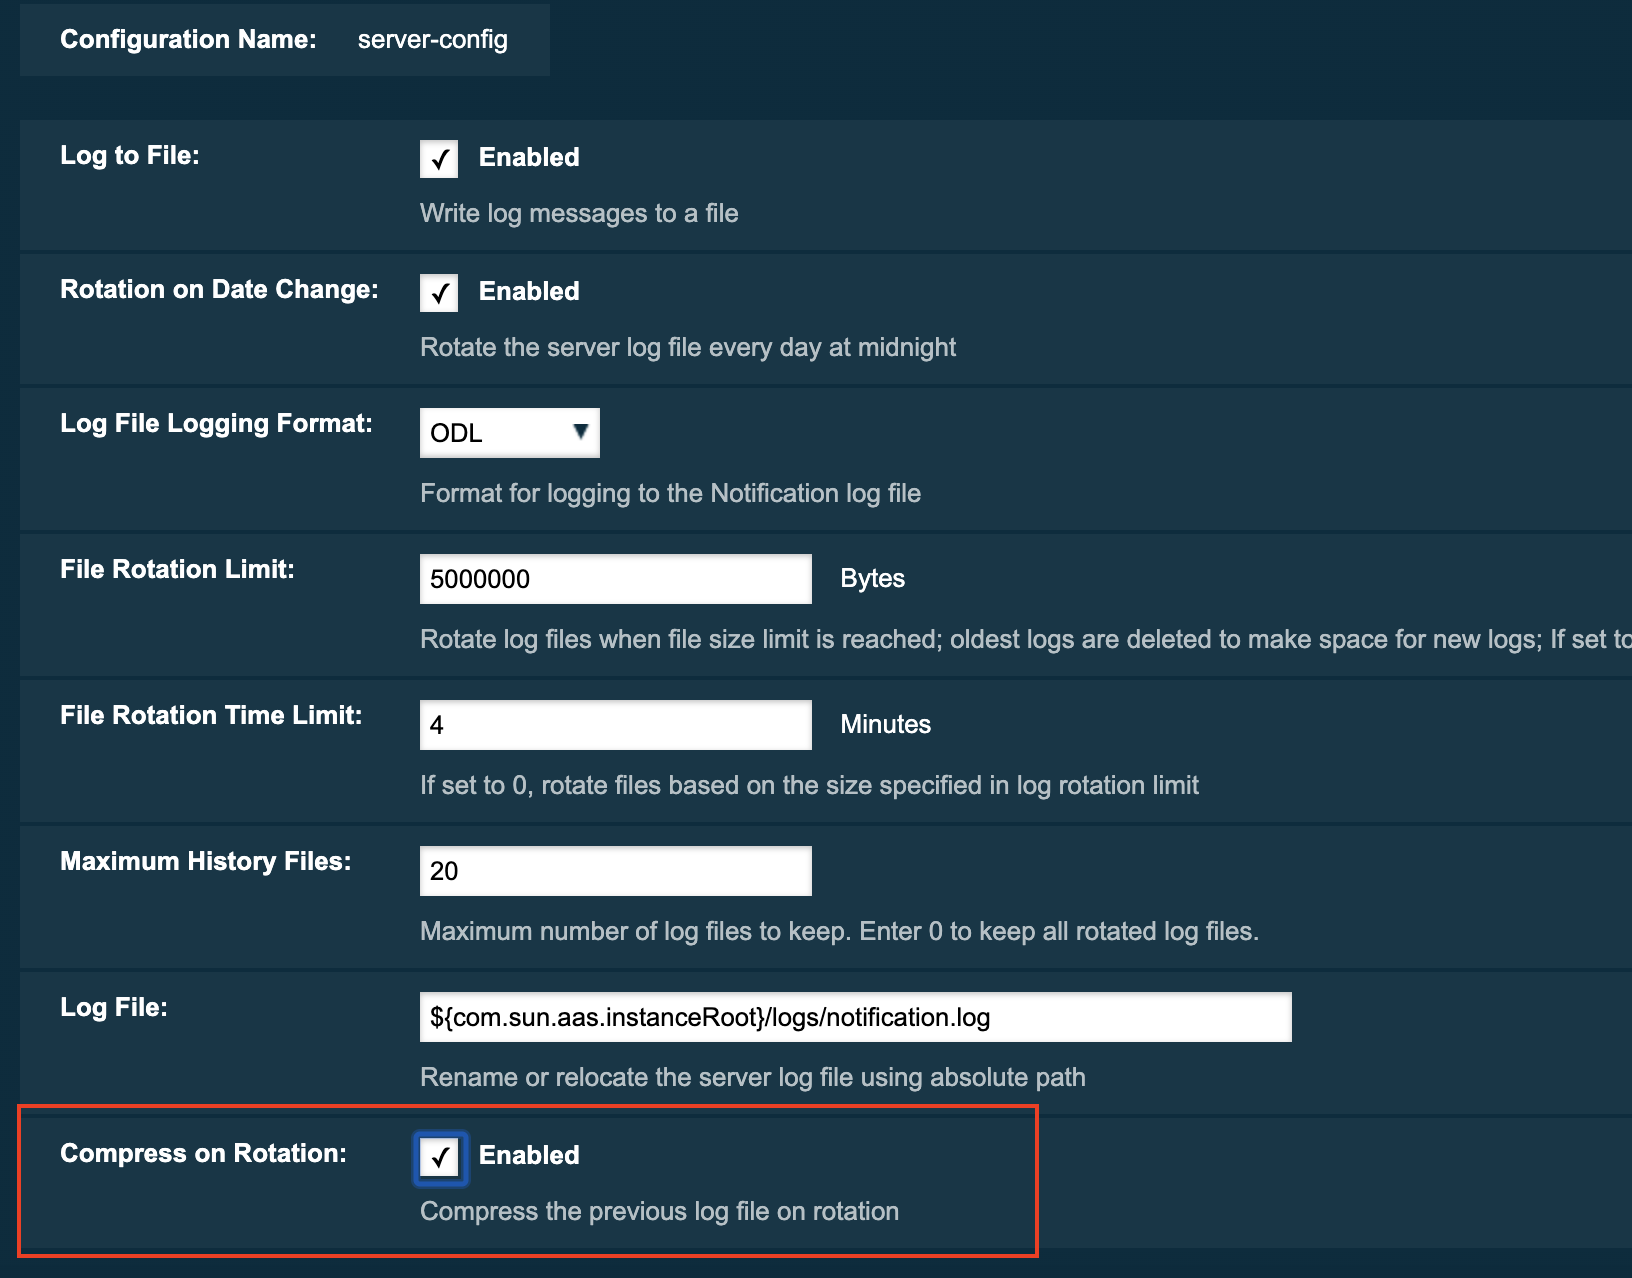
Configuring Log File Rotation
By default, The notification log rotation is set to rotate when the log file reaches 2 Megabytes(MB). Nonetheless, there are number of ways log rotation can be configured.
Size of file at which the log rotates can be changed, it can be set to rotate at date change, rotate when time limit is reached and, finally based on maximum number of history files.
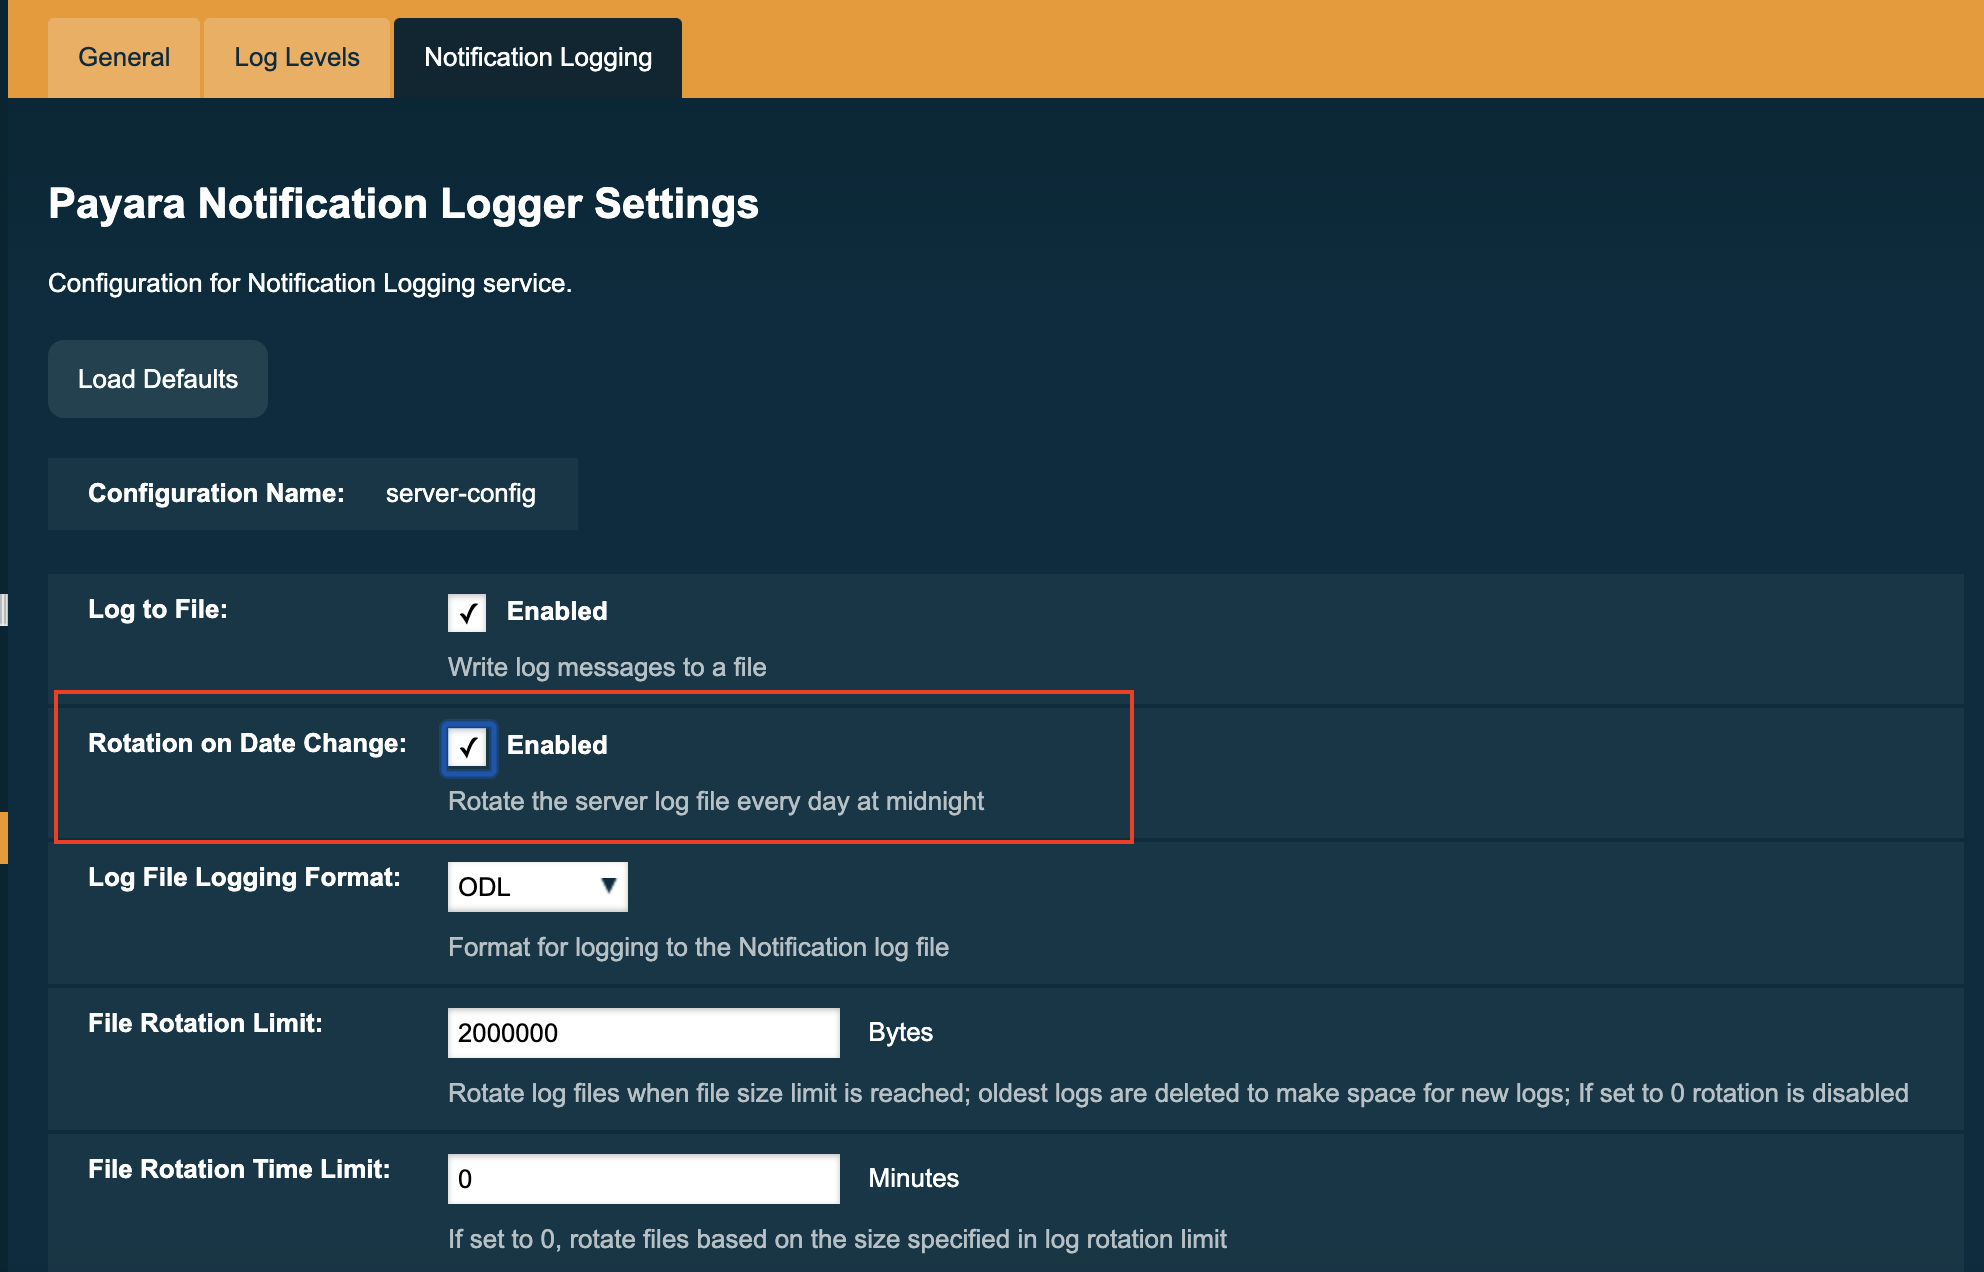
Rotation on Date Change
The Rotation On Date Change option provides a way to set the log rotation when the system date changes (at midnight, by default).
Rotation on File Size
The File Rotation Limit option provides a way to change the file size at which the server triggers the log file rotation. This option accepts an integer value specifying the maximum size of the log file, after which a file rotation will occur.
The minimum size it can be set to is 500KB (500.000 bytes).
If the value for this option is set to 0, log rotation will be disabled.
|

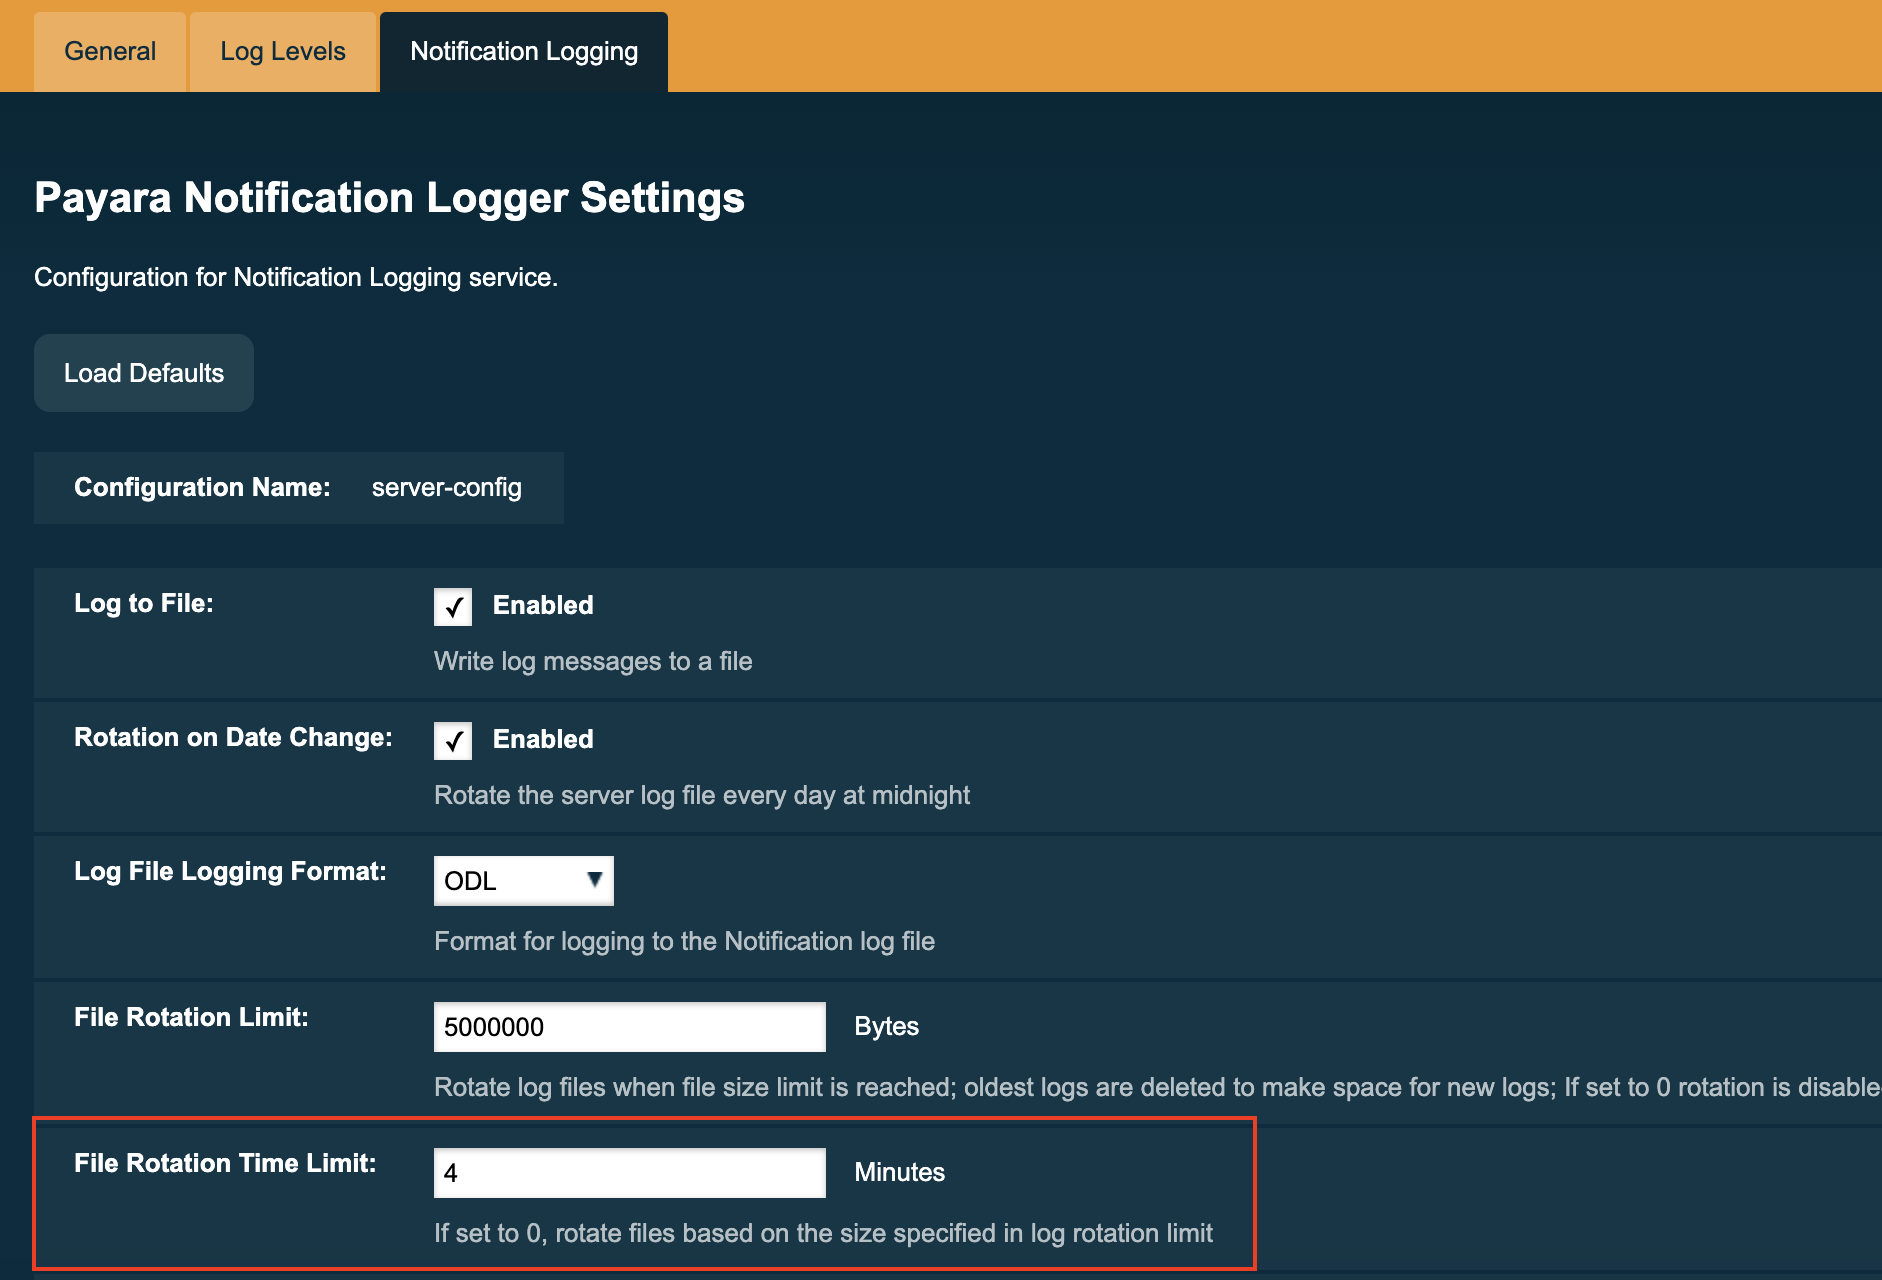
Rotation on Time Limit
The File Rotation Time Limit option provides a way to trigger the notification log file rotation based on a fixed time limit. The value of this setting is an integer that defines the time limit in minutes until the log rotation gets triggered.
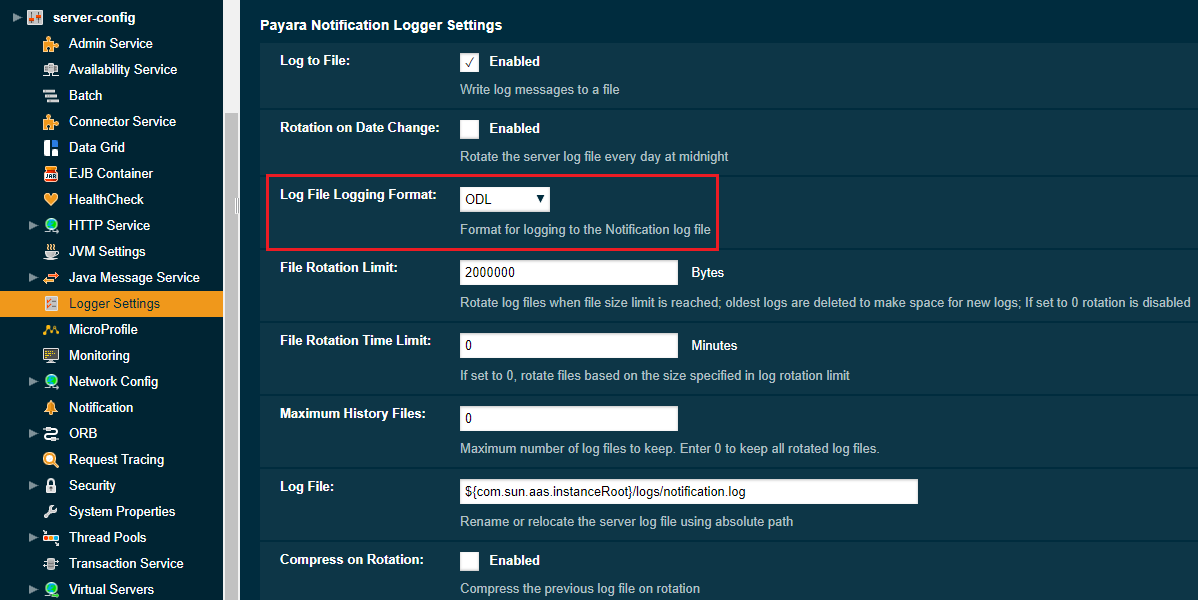
Change the Logging Format
The Log File Logging Format option can be used to change the notification log entries' format. There are 3 logging formats available: ULF, ODL and JSON, each one represented by a specific formatter class present in the Payara Platform API.
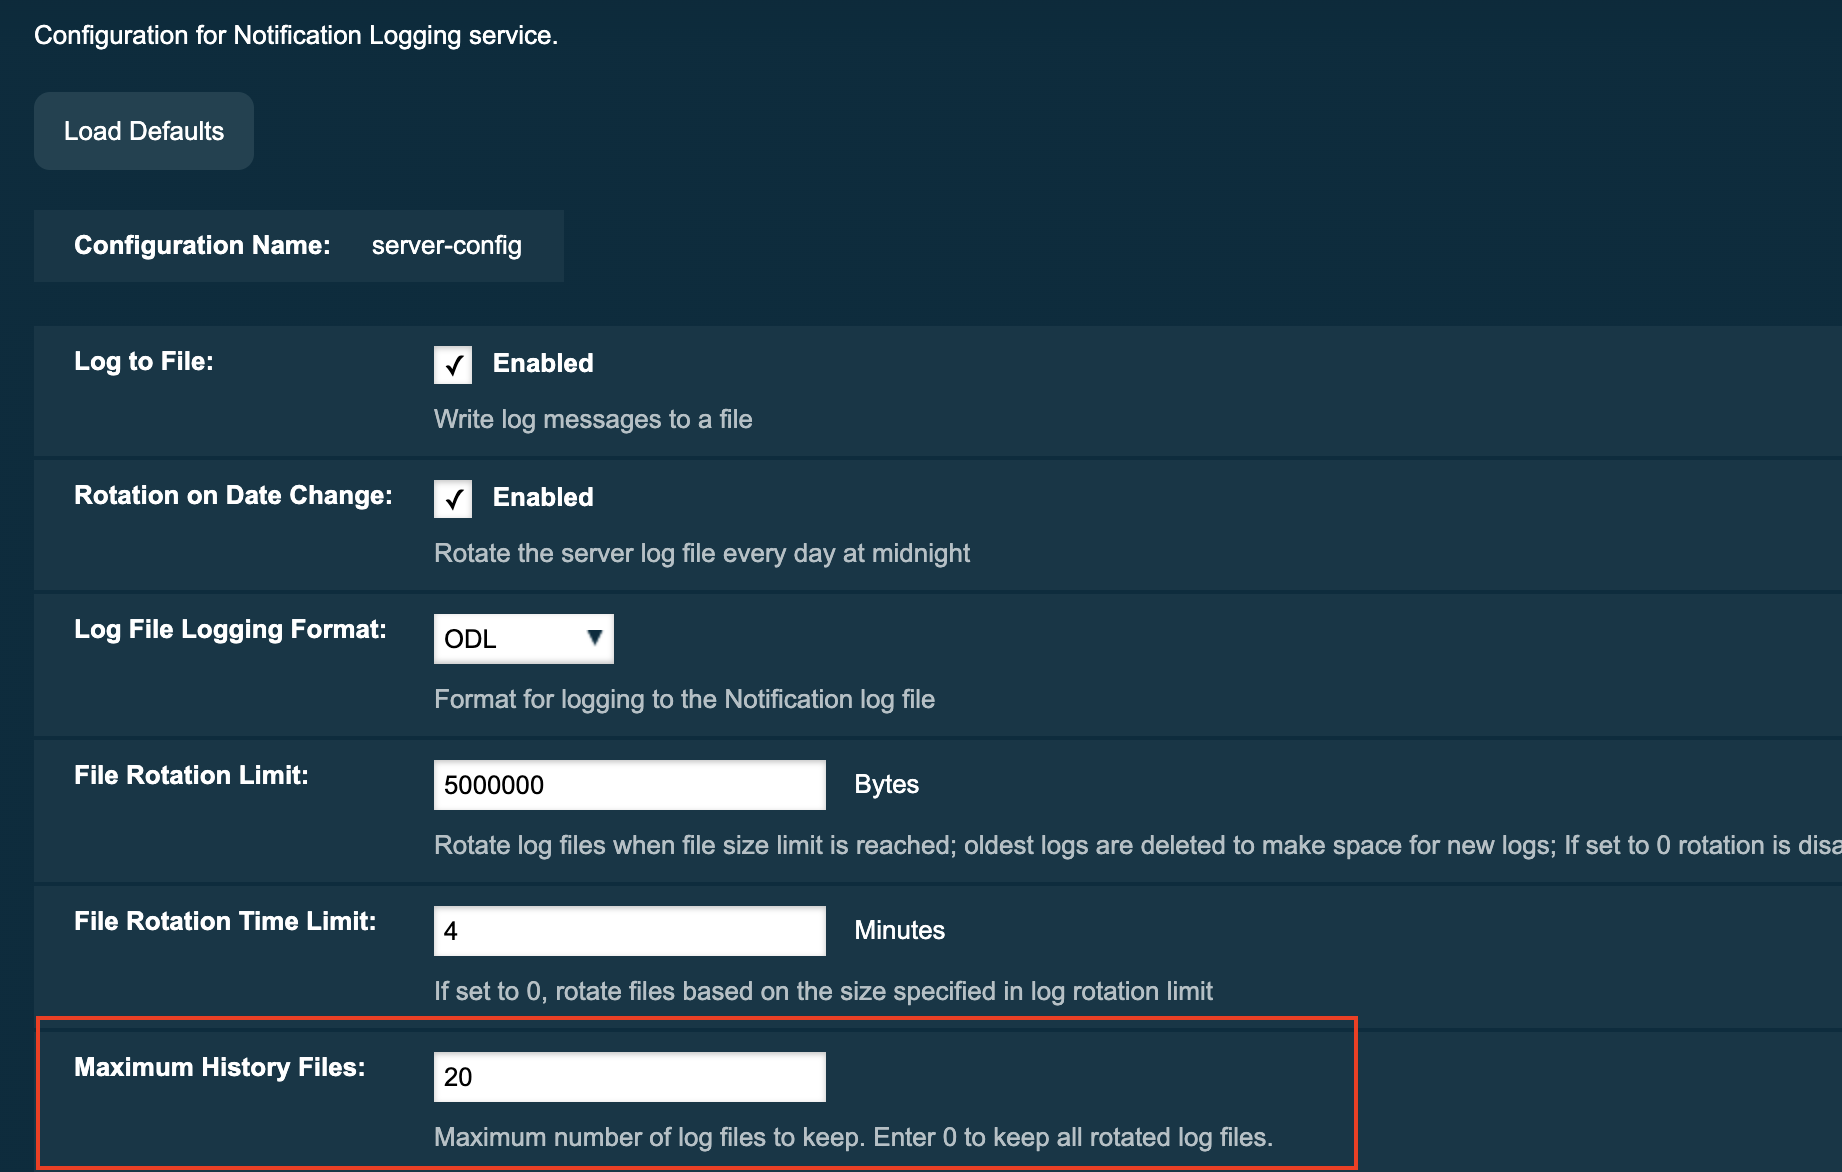
Set the Maximum Number of Historic Files
The Maximum History Files option provides a way to set the limit on the number of notification log files that can be created by Payara Server.
Once the number of files reaches the set limit, the oldest rotated log file is deleted. If the value for this option is set 0, all the rotated log files are preserved.
Change the Name and Location of the Log File
The Log File option provides a way to change the default name and location of the notification log files.
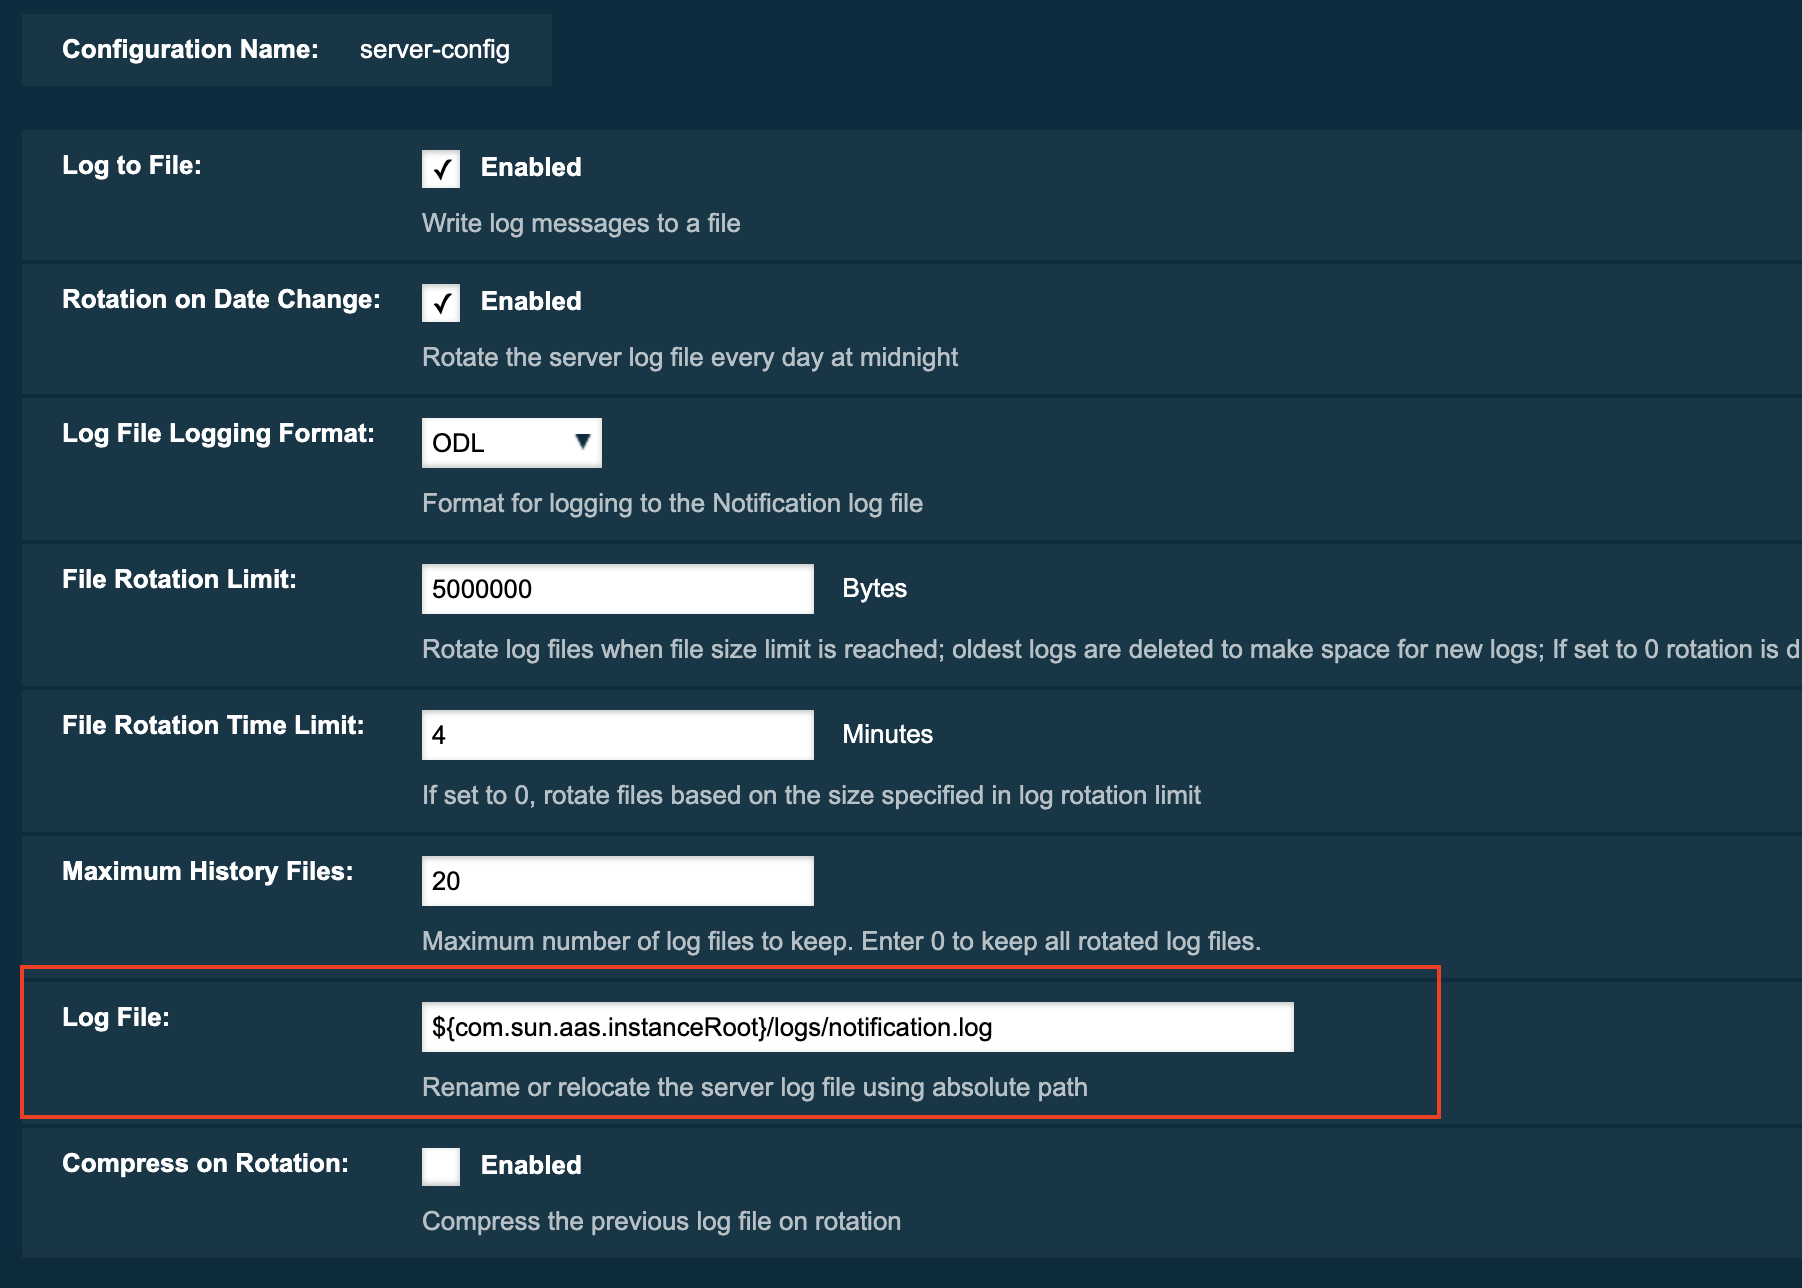
Using the Asadmin CLI
Use the following command to change the default name and location of the server log files:
asadmin set-log-attributes fish.payara.enterprise.server.logging.PayaraNotificationFileHandler.file=${com.sun.aas.instanceRoot}/notification/testNotification.log
As seen in the sample command, you can use the ${com.sun.aas.instanceRoot} system property to reference the current domain directory location.
|