The Request Tracing Service provides tracing facilities for multiple protocols and process communications done by the components of deployed applications.
The service helps users to detect application slowness and performance degradation by logging requests that exceed a given threshold. The trace data from long-running requests gives insight to solving bottlenecks and other performance issues.
The following types of requests are traced if the service is enabled:
-
JAX-RS endpoints (*)
-
JAX-RS client calls (*)
-
MicroProfile REST Client calls (*)
-
Servlets (HTTP requests)
-
SOAP Web Services (*)
-
WebSockets
-
EJB timers execution
-
Inbound JMS messages received by an MDB
-
JBatch jobs creation
-
Tasks executed by injected Managed Executors.
-
Remote Invocations of EJBs (*)
| Traces of request types marked in (*) are using higher-level APIs and are also available as OpenTelemetry Spans. |
Traces have form of nested spans following the model found in modern tracing APIs such as OpenTelemetry and OpenTracing.
The OpenTracing specification, found here, gives a more detailed description of what Spans are and the general trace format. Alternatively you can view a short summary here
The Request Tracing service has the concept of sample rates, affording you extra options to limit the amount of traces processed. The Payara Platform offers two options:
-
Flat probability sampling, which simply applies a percentage chance that a trace will not be traced.
-
An adaptive solution, which allows you to configure a target number of traces to sample over a given time period (e.g. sample 6 traces every 10 minutes).
An option to perform this sampling before or after the threshold checks is offered, allowing you to either determine if a trace should be sampled at its inception, or only after determining that a trace has breached your configured thresholds respectively.
OpenTelemetry Support
As Payara Platform offers support for MicroProfile Telemetry, it is possible to manually instrument your application code for creating spans.
For the full details, see the OpenTelemetry support in the Payara Platform Application Development section.
OpenTracing Support
In-line with Payara Platform’s support for MicroProfile OpenTracing, there’s added support for OpenTracing.io code instrumentation.
| Since OpenTracing is just a wrapper around OpenTelemetry, it is advised to use OpenTelemetry APIs instead. |
Configuration
As with any other services available in Payara Server, the Request Tracing service can be configured by using the Admin Console or via the Asadmin CLI.
Using the Web Administration Console
To configure the Request Tracing Service in the Administration Console, go to Configuration → [instance-configuration (like server-config)] → Request Tracing:
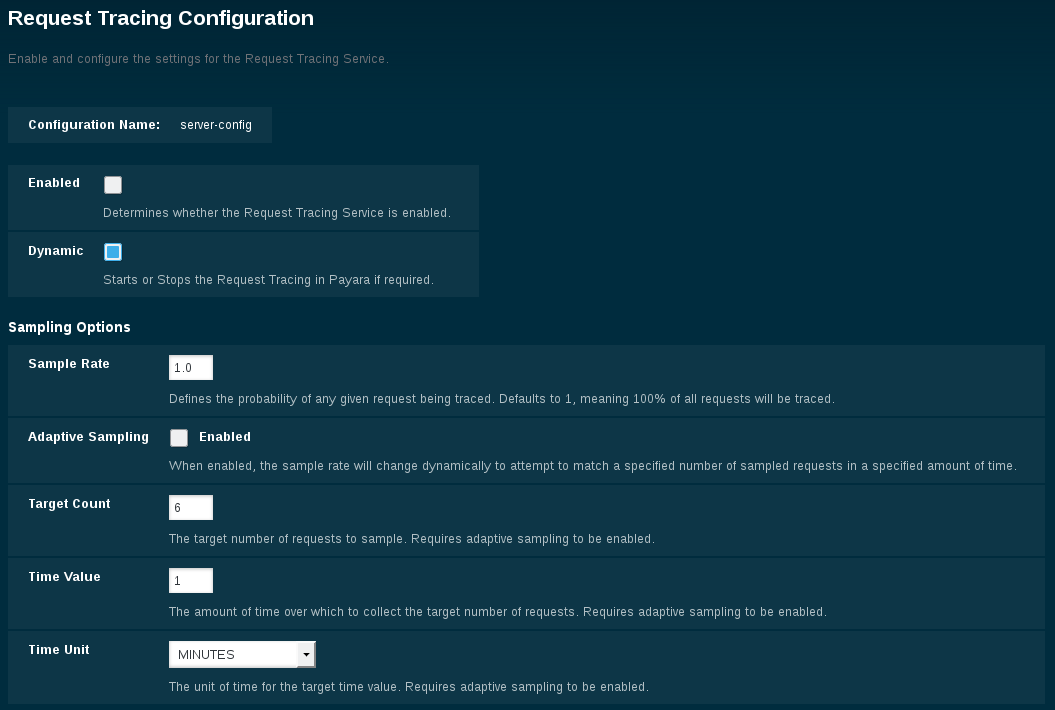
Check the Enabled box (and the Dynamic box too if you don’t want to restart the domain) to switch the request tracing service on.
You can configure the request tracing service settings using the following attributes:
- Sample Rate
-
This defines the percentage chance of a trace being sampled (as in, not discarded). This accepts a value between 0 and 1, with a value of 1 meaning 100% of traces are sampled.
- Adaptive Sampling
-
This option is an alternative to using Sample Rate, allowing the sample rate to change in accordance with how many traces are being sampled over a period of time.
- Target Count
-
This defines the number of sampled traces that the adaptive sampling shall attempt to hit over a period of time.
- Time Value
-
This defines the period of time that the adaptive sampling will try to hit the Target Count in.
- Time Unit
-
This defines the time unit of the Time Value attribute.
- Applications Only
-
When enabled, traces that originate from outside deployed applications (e.g. the Admin Console) will not be sampled.
- Threshold Value
-
This defines the number of units beyond which a request will be traced.
- Threshold Unit
-
This defines the time duration per unit. The accepted options are any valid java.util.concurrent.TimeUnit values. The default value is SECONDS.
- Sample Rate First
-
When enabled, the sample rate will be checked as a trace begins, meaning that traces that would have broken the thresholds are potentially discarded. When disabled, the sample rate is checked after a trace has completed, meaning that you’re only sampling traces that have breached your threshold values. Having this disabled will potentially give more accurate trace data, at the expense of a small extra performance overhead.
- Reservoir Sampling
-
When disabled, the trace stores will contain the longest request traces. When enabled, the chance of any sampled request being in the trace stores becomes constant. Note that this applies to both trace stores in most circumstances it doesn’t make sense to have this enabled if Store Historic Traces is also enabled.
- Trace Store Size
-
The maximum number of traces to be stored in the local rolling trace store. A store shared in a cluster uses the maximum setting of this property of any instance in the cluster with request tracing enabled.
- Trace Store Timeout
-
The timeout value for when traces will be removed from the rolling trace store. This is ignored when reservoir sampling is enabled.
- Store Historic Traces
-
When enabled, a second trace store is created to store the longest historical request traces.
- Historic Trace Store Size
-
Determines the number of historical trace events that can be stored in memory when historical storing is enabled. The default value is 20 records. A store shared in a cluster uses the maximum setting of this property of any instance in the cluster with request tracing enabled.
- Historic Trace Store Timeout
-
Determines how long before Request Tracing messages are removed. This field is specified in the format "%d %h %m %s" where % is an integer. Any of the units can also be omitted.
Aside from this configuration settings, you can also define which notifiers will be used to relay the request tracing events by moving them to the Selected Notifiers box.
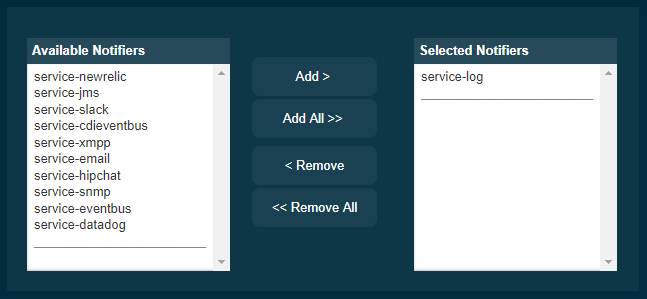
| Keep in mind that for request tracing events to be relayed to the selected notifiers, both the Notification Service and each respective notifier must be enabled first. |
| You don’t need to manually add each notifier on this screen. When enabling a notifier on its configuration screen, the server will automatically add it to the list of selected notifiers for the Request Tracing service. This same result occurs when enabling the notifier using the appropriate asadmin command. |