Payara Server comes with a general Notification service that can be used to log events which come from other services, such as the Monitoring Service, the HealthCheck service or the Request Tracing Service.
Notification Service Configuration Commands
The following Asadmin CLI subcommands can be used to configure the notification service in general:
Notifiers
The Notification service provides the ability to disseminate notification events through various channels or notifiers, which relay them to different destinations.
The following is a list of the default set of notifiers available in Payara Server.
Log Notifier
The log notifier is the only notifier that is enabled by default when the notification service is activated.
The default output for the log notifier is the configured instance’s log file, which is either the server.log file or cluster.log file, depending on the instance configuration.
| The log notifier only handles the output of notifications from the notification service sent to the log and is not responsible for any other log output. |
Configuration
Because the log notifier is the default notifier for the notification service it can be configured on the same page as the notification service, as shown in the image below:
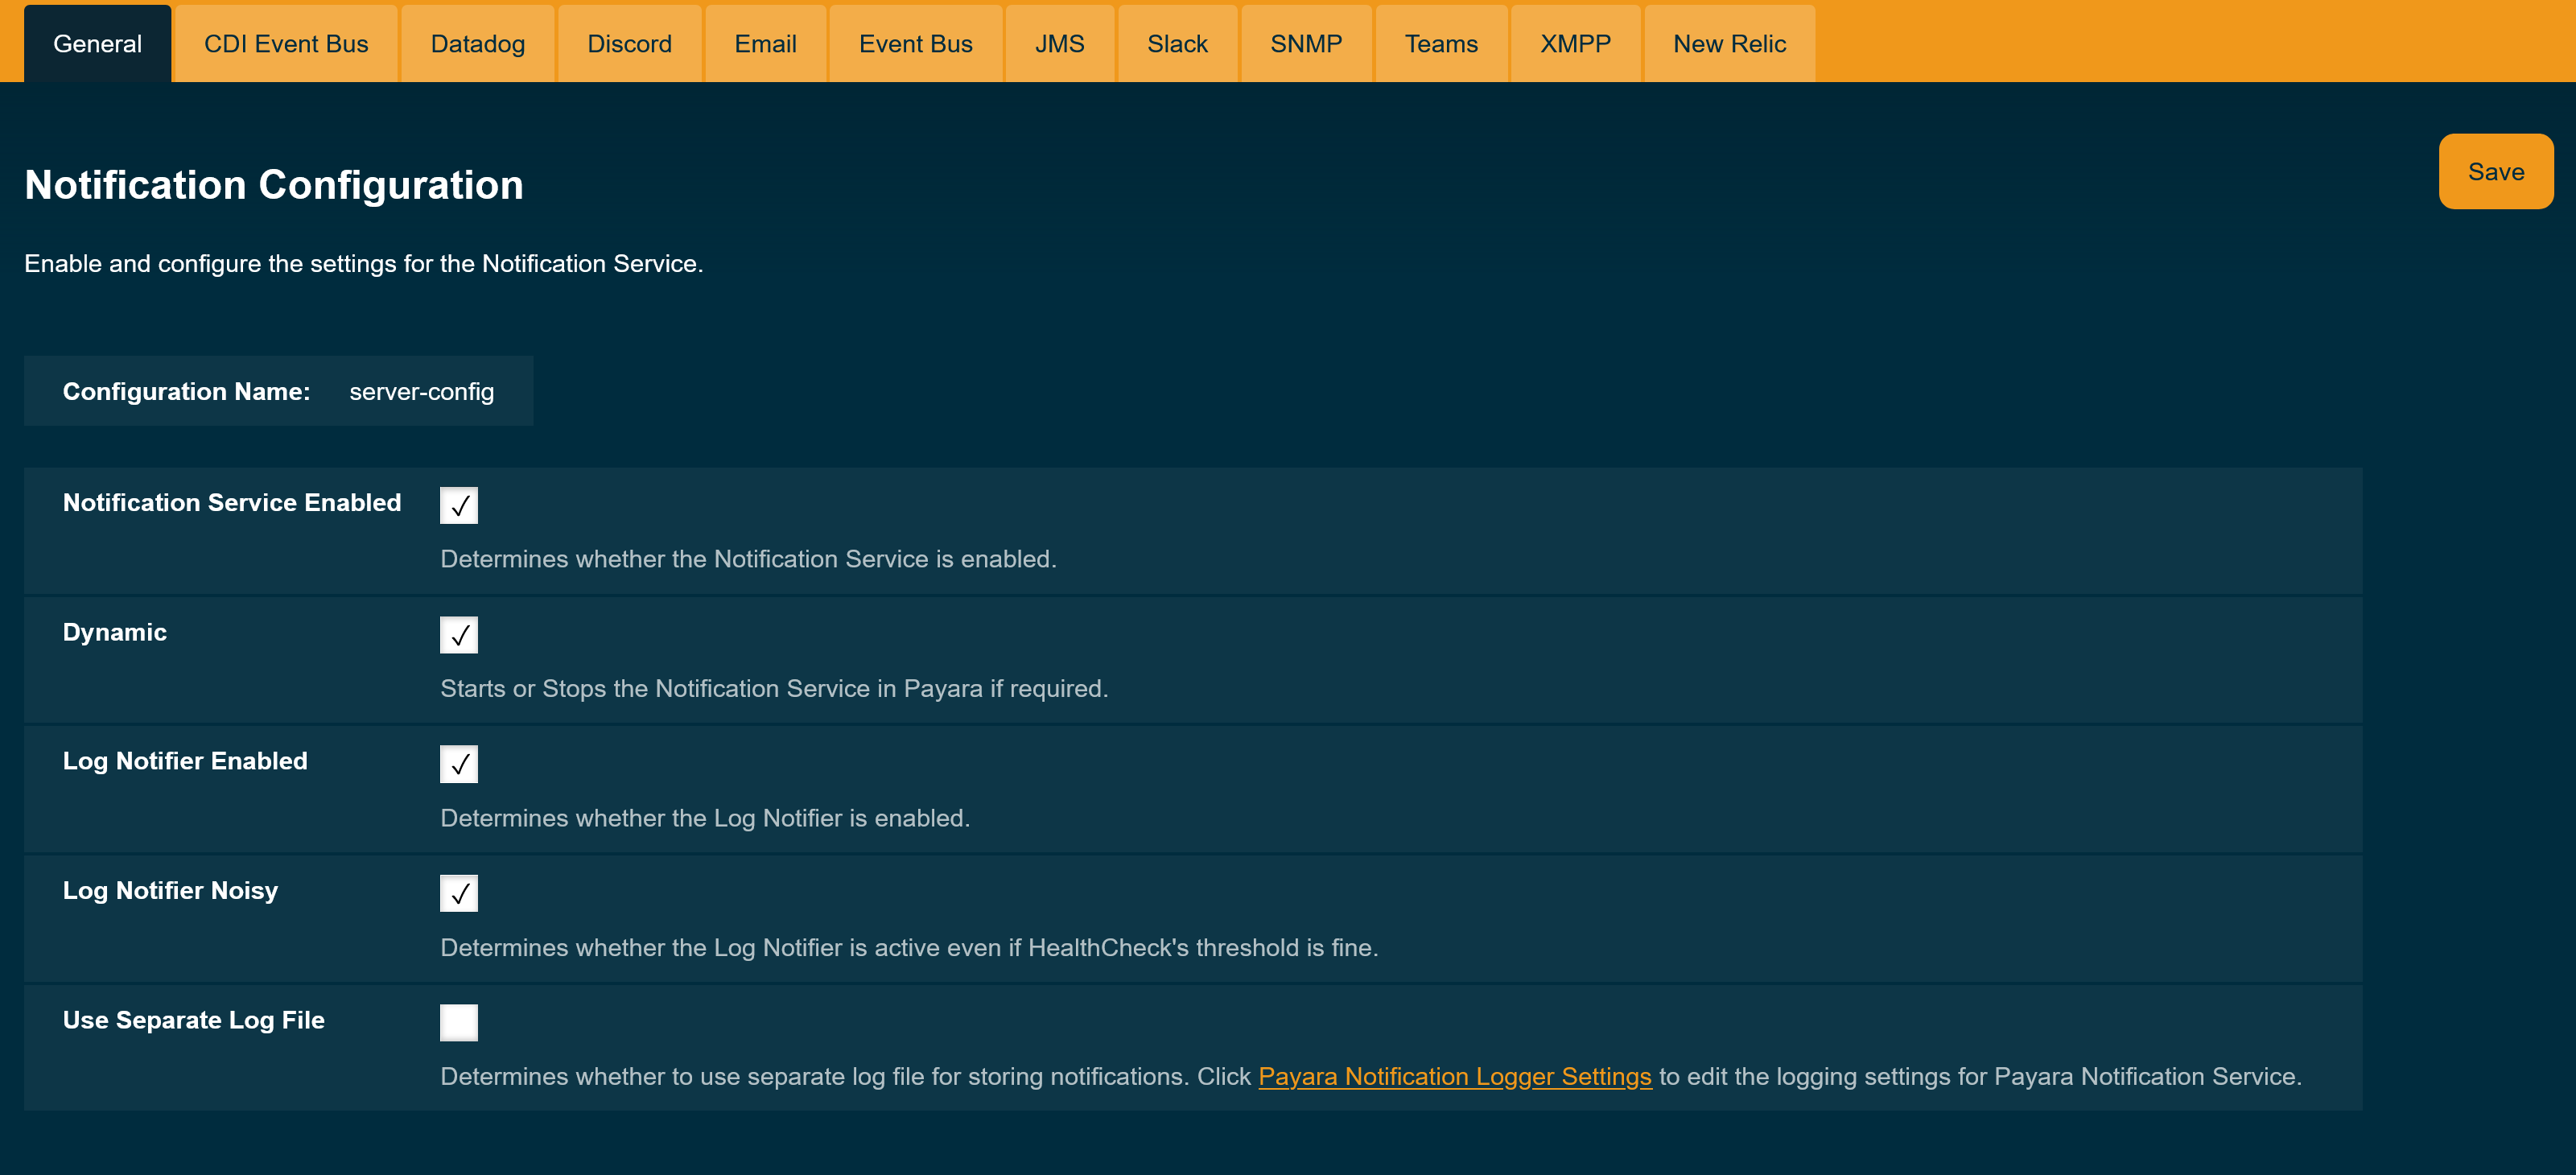
For any new domain, the notification service will be disabled by default. It can be enabled through the admin console as shown above, or via the Asadmin CLI.
To configure the log notifier through the Asadmin CLI, use the set-log-notifier-configuration subcommand:
asadmin> set-log-notifier-configuration --enabled=true --dynamic=trueTo get the current configuration of the log notifier, use the get-log-notifier-configuration subcommand:
asadmin> get-log-notifier-configuration

Enabled  Noisy  Use Separate Log File
true     true   false
Command get-log-notifier-configuration executed successfully.
See Notification Logging for more information on how to configure specific details of the server logging settings.
JMS Notifier
The JMS notifier makes use of a JMS queue to send notification events via standard Java messages. These messages can then be consumed by a Message Driven Bean or any other JMS compatible client implementation.
Requirements
To use JMS as a notification target, you will need the following a JMS-compatible message broker.
| The Payara Server Web Profile distribution does not come with JMS capabilities, so this notifier isn’t supported in this profile. |
| The easiest way to configure the JMS notifier is to use the embedded OpenMQ broker, since Payara Server already comes with it by default. |
JMS Notifier Configuration
The notifier configuration requires following a few steps:
-
Create a new JMS Queue to receive the notification messages from the notifier:
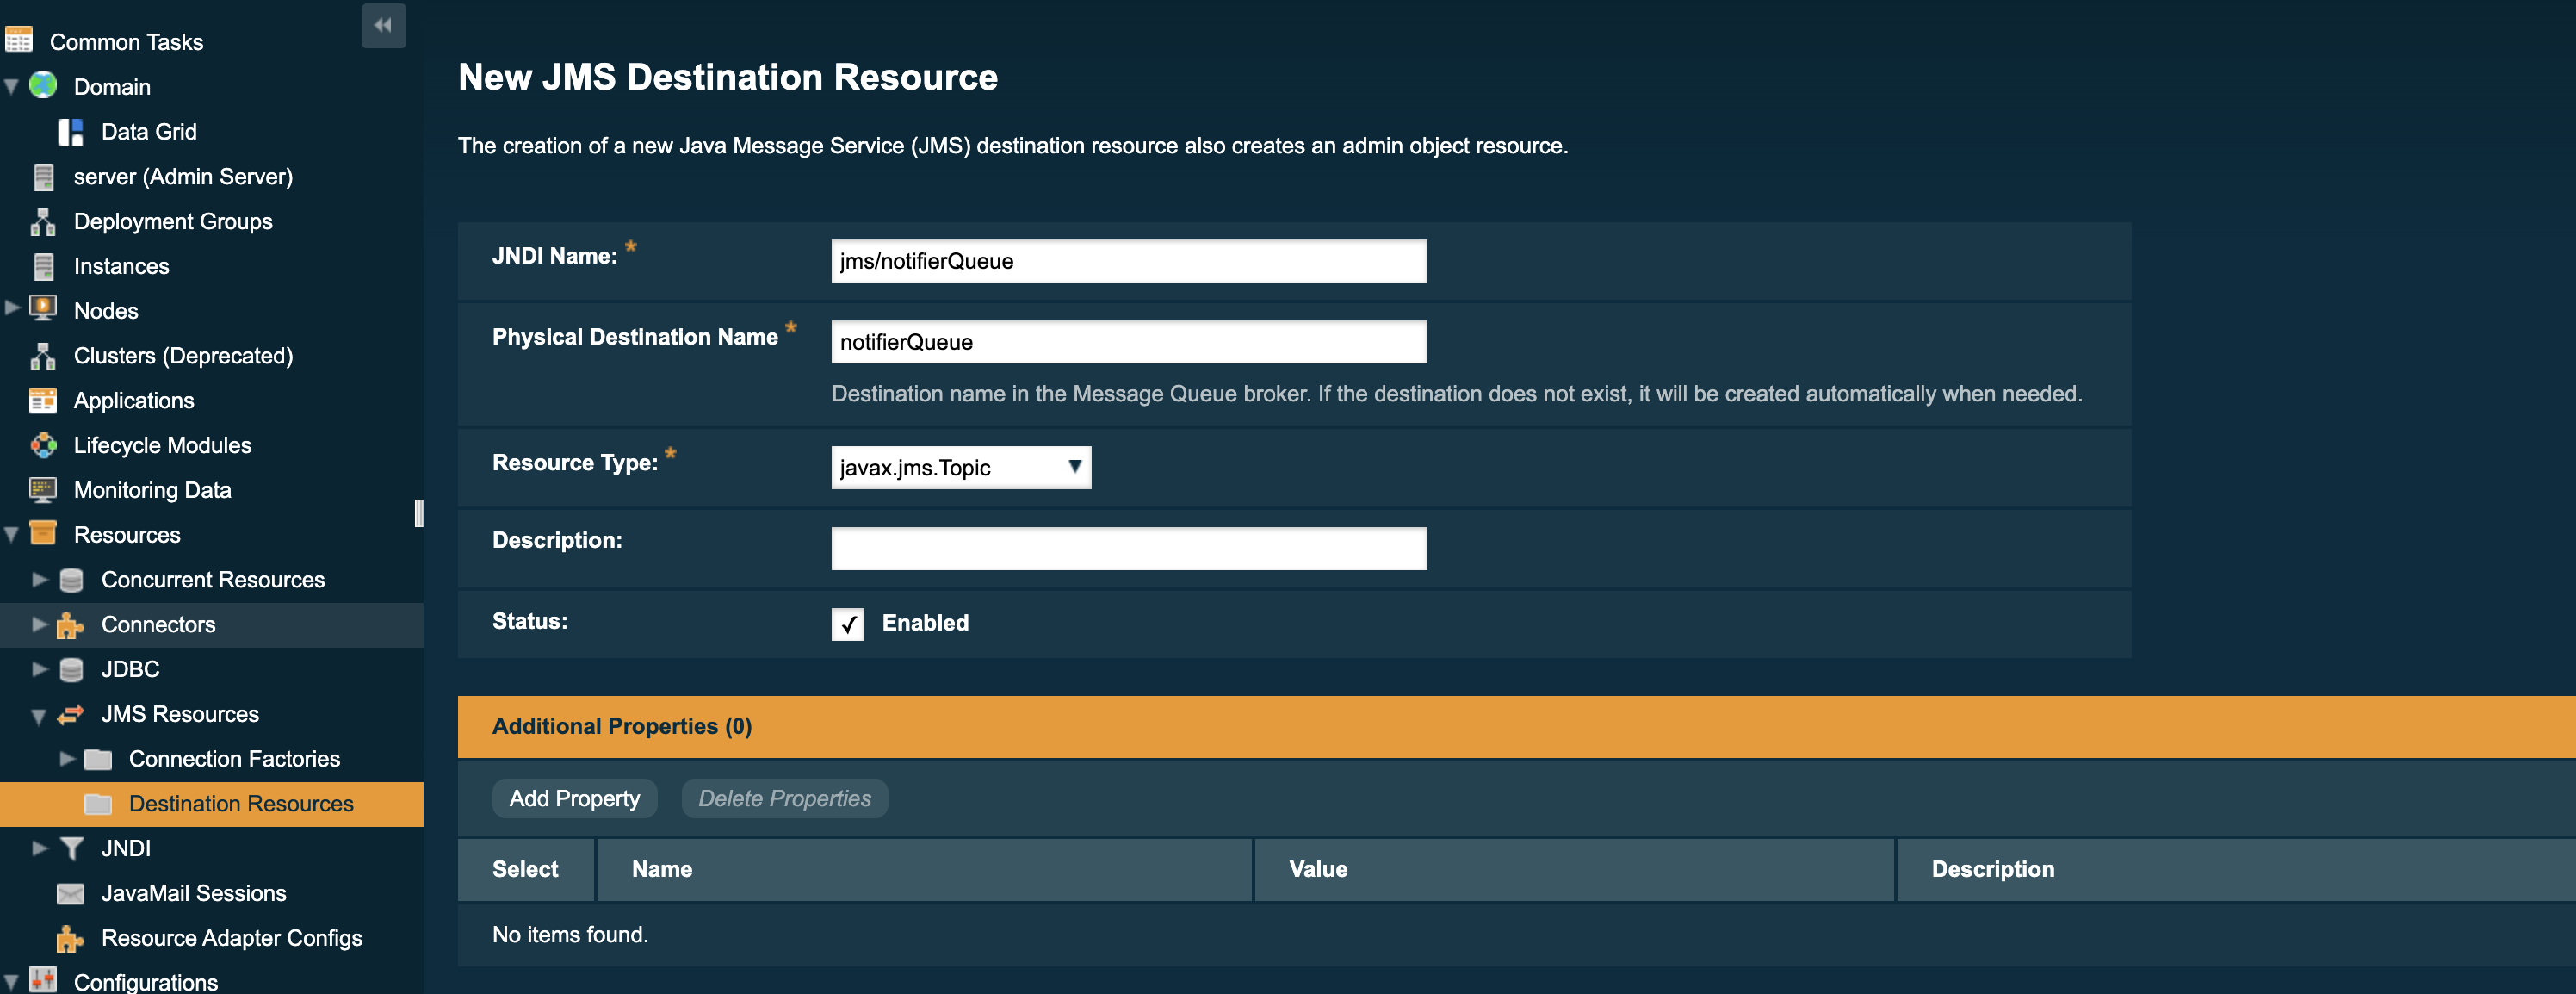
To make this change via the Asadmin CLI, use the following subcommand which mirrors the above screenshot:
asadmin create-jms-resource --enabled=true --property=Name=notifierQueue --restype=jakarta.jms.queue jms/notifierQueue -
Set the JMS Notifier settings:
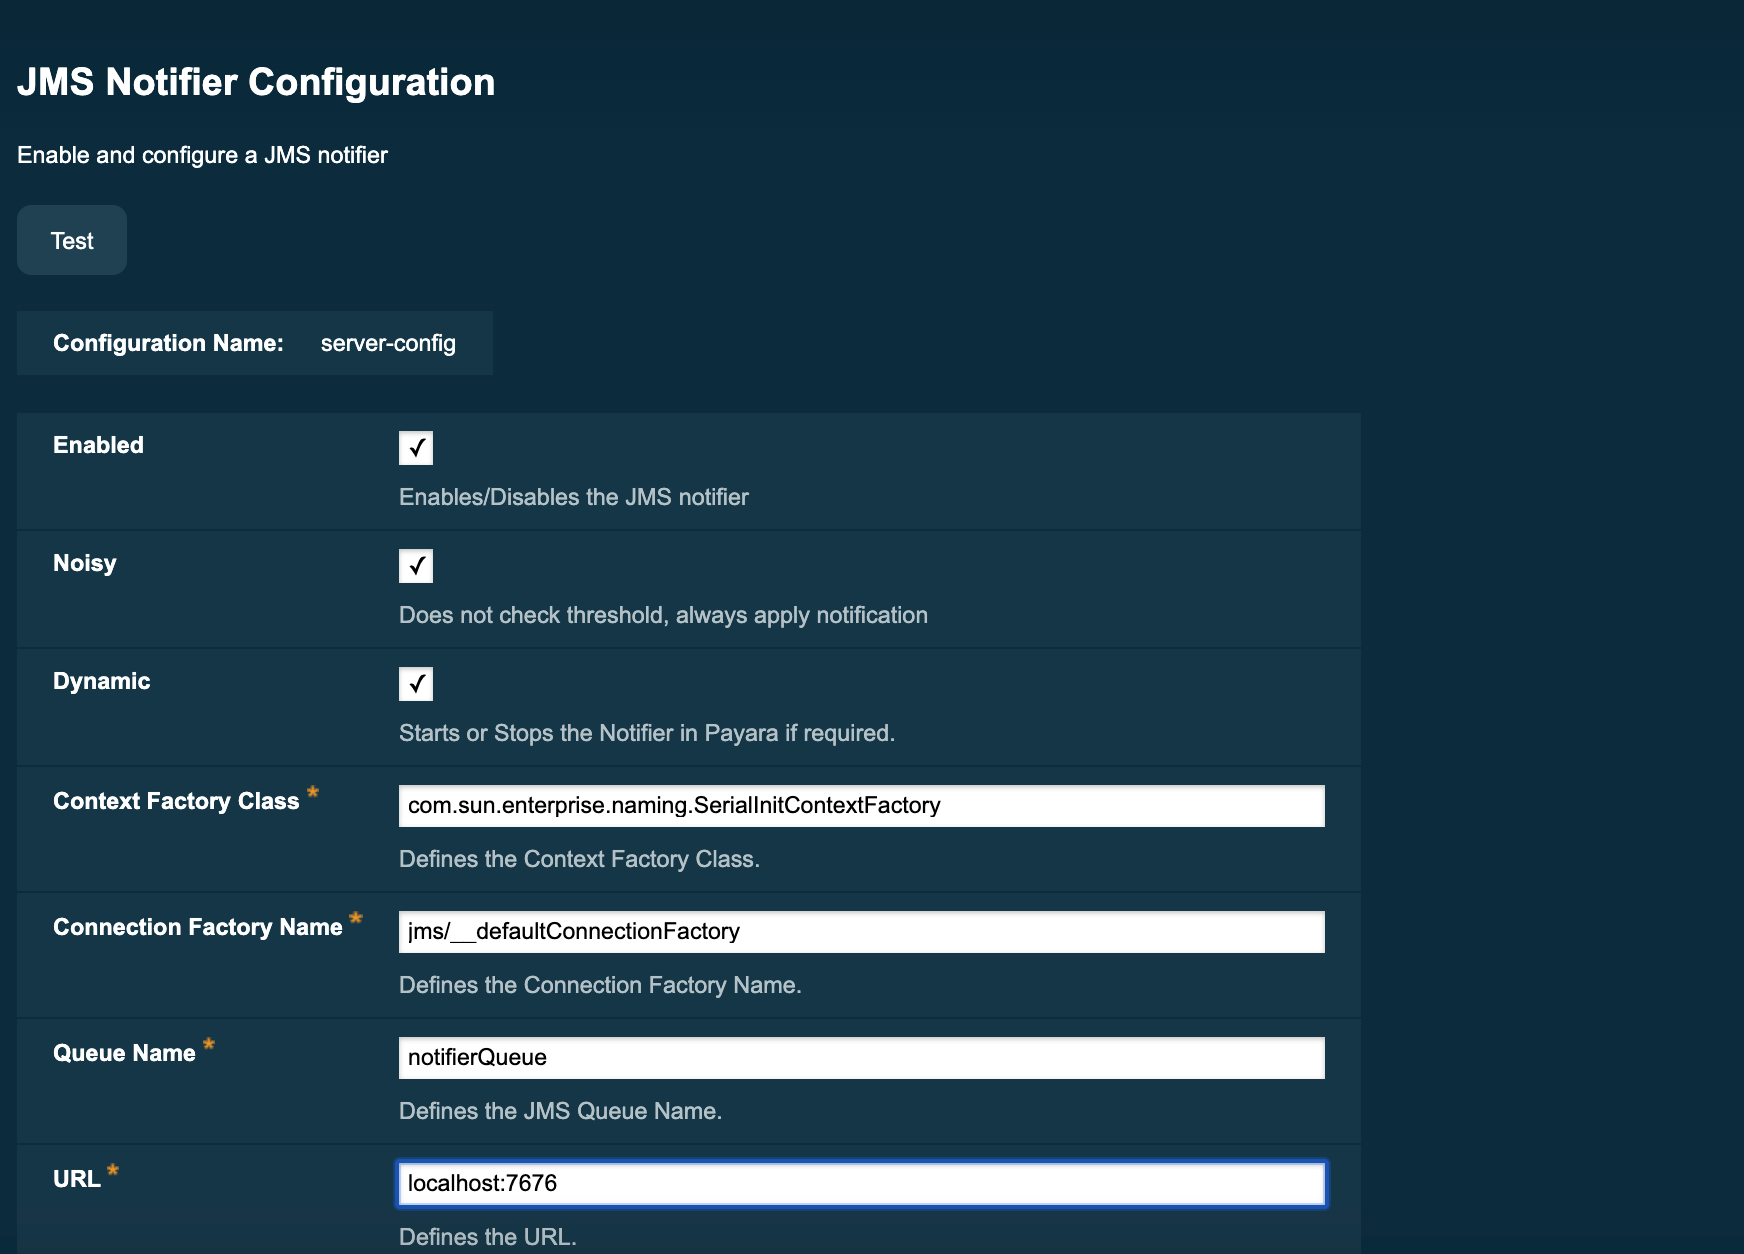
The above example uses the embedded OpenMQ broker’s default configuration.
To make this change via the Asadmin CLI, use the following command which mirrors the above screenshot:
asadmin set-jms-notifier-configuration --dynamic=true --enabled=true --contextFactoryClass=com.sun.enterprise.naming.SerialInitContextFactory --target=server-config --queueName=notifierQueue --url=localhost:7676 --connectionFactoryName=jms/_defaultConnectionFactory
Verifying the Configuration
For verification purposes, it may be useful to enable a service to push notifications through the JMS notifier to demonstrate that it is working. To do this, you will also need to set up a Message-Driven Bean (MDB) to consume the notifications and demonstrate that they are being stored in the queue.
-
First, enable a service to push data through the notifier. For example, the HealthCheck service’s CPU metric can be configured to push CPU metrics to a notifier every 5 seconds:
asadmin healthcheck-configure --enabled=true --dynamic=true --enableNotifiers=jms-notifier

asadmin healthcheck-configure-service --serviceName=healthcheck-cpu --enabled=true --dynamic=true --time=5 --unit=SECONDS
This also configures the HealthCheck service to send notifications to the JMS notifier, which will cause the messages to be sent right away.
-
To consume the messages using a Jakarta Messaging compliant MDB, the following class will work for a pre-configured queue named
notifierQueue:@MessageDriven(activationConfig = { @ActivationConfigProperty(propertyName = "destinationLookup", propertyValue = "jms/notifierQueue"), @ActivationConfigProperty(propertyName = "destinationType", propertyValue = "jakarta.jms.Queue"), @ActivationConfigProperty(propertyName = "destination", propertyValue = "notifierQueue"), }) public class NotificationConsumer implements MessageListener { @Override public void onMessage(Message message) { try { System.out.println("Message received: " + message.getBody(String.class)); } catch (JMSException ex) {} } } -
View the result of the MessageDrivenBean’s
onMessage()command. In this example, the CPU metric of the health check service was configured to notify every 5 seconds, so the result of simply printing toSystem.outis following log entries:[2017-02-24T14:25:02.019+0000] [INFO] [] [fish.payara.nucleus.healthcheck.HealthCheckService] [tid: _ThreadID=151 _ThreadName=admin-thread-pool::admin-listener(9)] [timeMillis: 1487946302019] [levelValue: 800] [[Scheduling Health Check for task: CPUC]] [2017-02-24T14:25:02.019+0000] [INFO] [] [fish.payara.nucleus.healthcheck.HealthCheckService] [tid: _ThreadID=151 _ThreadName=admin-thread-pool::admin-listener(9)] [timeMillis: 1487946302019] [levelValue: 800] [[Payara Health Check Service Started.]] [2017-02-24T14:25:02.376+0000] [INFO] [] [] [tid: _ThreadID=48 _ThreadName=p: thread-pool-1; w: 3] [timeMillis: 1487946302376] [levelValue: 800] [[Message received: Health Check notification with severity level: INFO. (host:mike-payara, server:server, domain:domain1,instance:server) CPUC:Health Check Result:[[status=GOOD, message='CPU%: 1.45, Time CPU used: 3 seconds 797 milliseconds'']']]] [2017-02-24T14:25:02.380+0000] [INFO] [] [] [tid: _ThreadID=50 _ThreadName=p: thread-pool-1; w: 5] [timeMillis: 1487946302380] [levelValue: 800] [[Message received: Health Check notification with severity level: SEVERE. (host:mike-payara, server:server, domain:domain1,instance:server) CPUC:Health Check Result:[[status=CRITICAL, message='CPU%: 109.71, Time CPU used: 7 milliseconds'']']]]
Asadmin Commands
Set the JMS notifier configuration
To set the JMS notifier configuration, the following asadmin command will reflect the configuration done in the previous section:
asadmin set-jms-notifier-configuration --dynamic=true --enabled=true
  --contextFactoryClass=com.sun.enterprise.naming.SerialInitContextFactory
  --connectionFactoryName=jms/__defaultConnectionFactory
  --queueName=notifierQueue
  --url=localhost:7676
  --username=****
  --password=****
  --target=server-config
Get the JMS notifier configuration
To get the JMS notifier configuration using the Asadmin CLI, run the following command:
asadmin> get-jms-notifier-configuration

Enabled  Noisy  Context Factory Class  Connection Factory Name  Queue Name  URL  Username  Password
true     true   com.sun.enterprise.naming.SerialInitContextFactory  jms/__defaultConnectionFactory  notifierQueue  localhost:7676  myusername  mypassword
Command get-jms-notifier-configuration executed successfully.
Troubleshooting
When you have correctly configured the JMS notifier, it can be used to push notifications to your configured queue.
If you do not see any notifications, check the following:
-
Is your MDB or other JMS client correctly configured to consume messages from the correct queue? (e.g. check for typos)
-
Are the JMS queue details correctly set up in the notifier configuration? (check the server.log for errors)
-
Is the JMS queue available? If you have configured your own JMS broker, is it responding? If the broker is remote, check that it is reachable.
-
Is the service using the notifier configured to send notifications frequently enough to observe?
-
Is the service using the notifier correctly configured and also enabled?
Event Bus Notifier
The Event Bus Notifier provides a way to send notifications from the notification service into the internal Payara Server event bus, which is based on Hazelcast distributed topics.
|
Notifications sent to the internal event bus using this notifier are intended to be received by internal server components and not by user applications. Currently, no built-in internal components consume event bus notifications yet and there are no available APIs that allow applications to consume these events. |
| The Data Grid must be enabled for the Event Bus to be available. |
Event Bus Notifier Configuration
This notifier provides only one configuration option, the Topic Name, which is mandatory.
In the Admin Console, simply set the Topic Name to a desired name, which will be used to set up the Hazelcast topic that will receive the notifications.
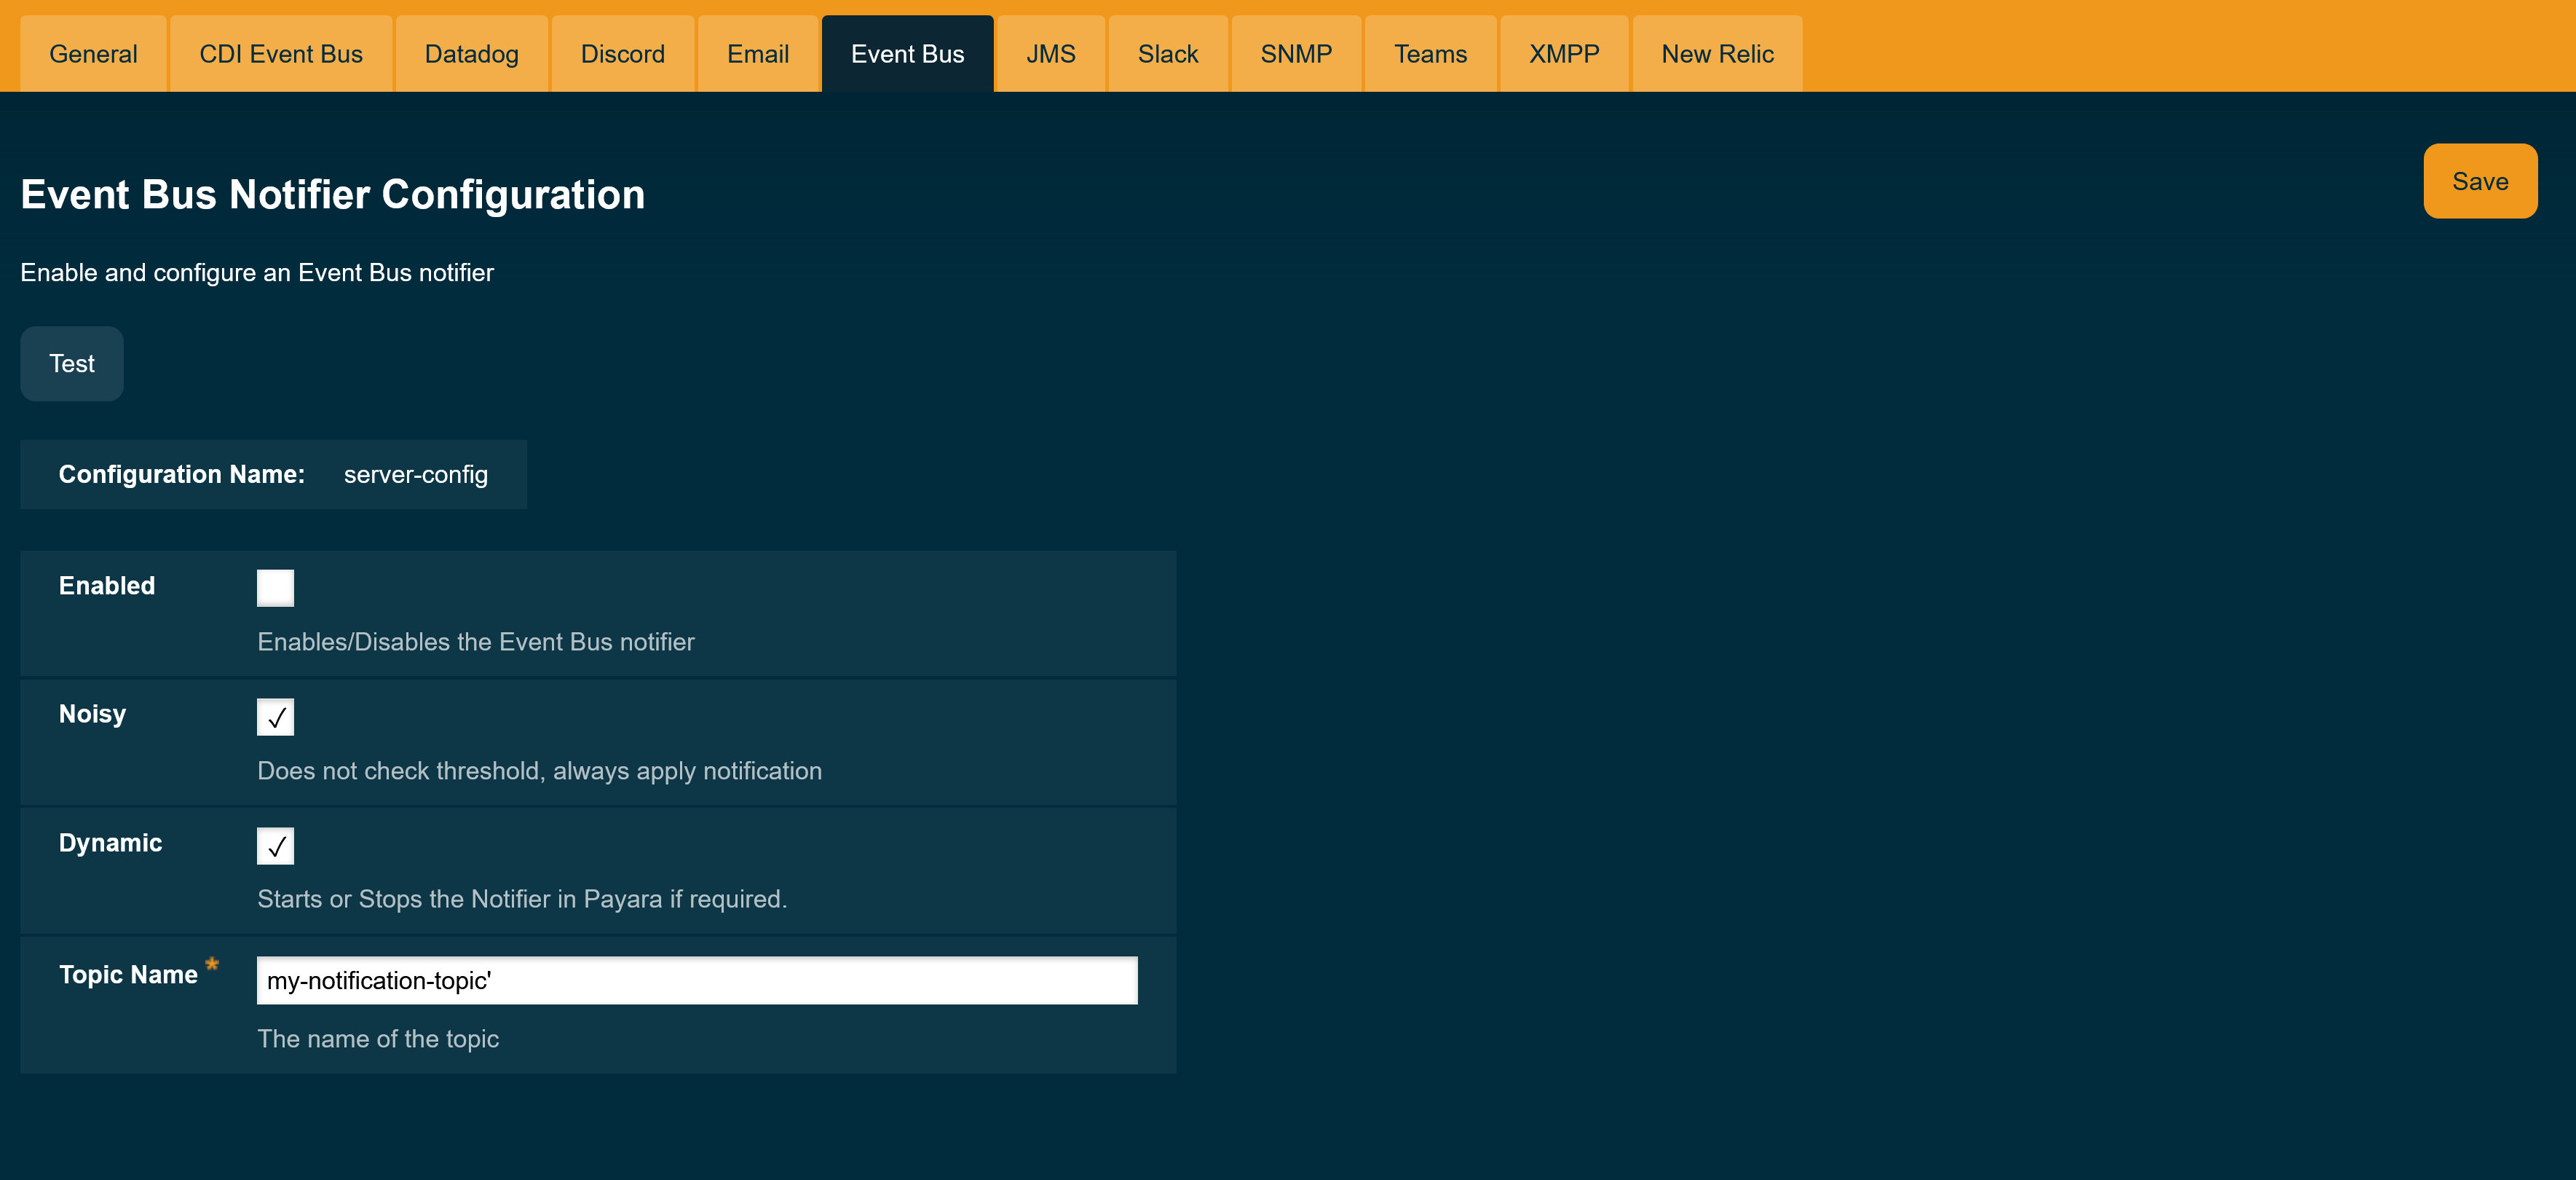
Make sure that the "Enabled" box is ticked so that the notifier will be used. If you would like the changes to take effect without needing a restart, tick the "Dynamic" box as well.
To make these changes via the Asadmin CLI, use the following subcommand:
asadmin set-eventbus-notifier-configuration --topicName=my-topic --dynamic=true --enabled=trueTo check the current applied configuration from asadmin, run the command:
asadmin get-eventbus-notifier-configuration

Enabled  Noisy  Topic Name
false    true   payara.notification.event

Command get-eventbus-notifier-configuration executed successfully.
CDI Event Bus Notifier
The CDI Event Bus notifier provides a way to send notifications from the notification service into the internal Payara Server’s CDI Event bus.
These notifications consist of CDI asynchronous events that can be consumed by user applications with valid CDI beans set up as listeners.
| The Data Grid must be enabled for the CDI Event Bus to be available. |
CDI Event Bus Notifier Configuration
You can configure the CDI Event Bus notifier from the Admin Console like this:
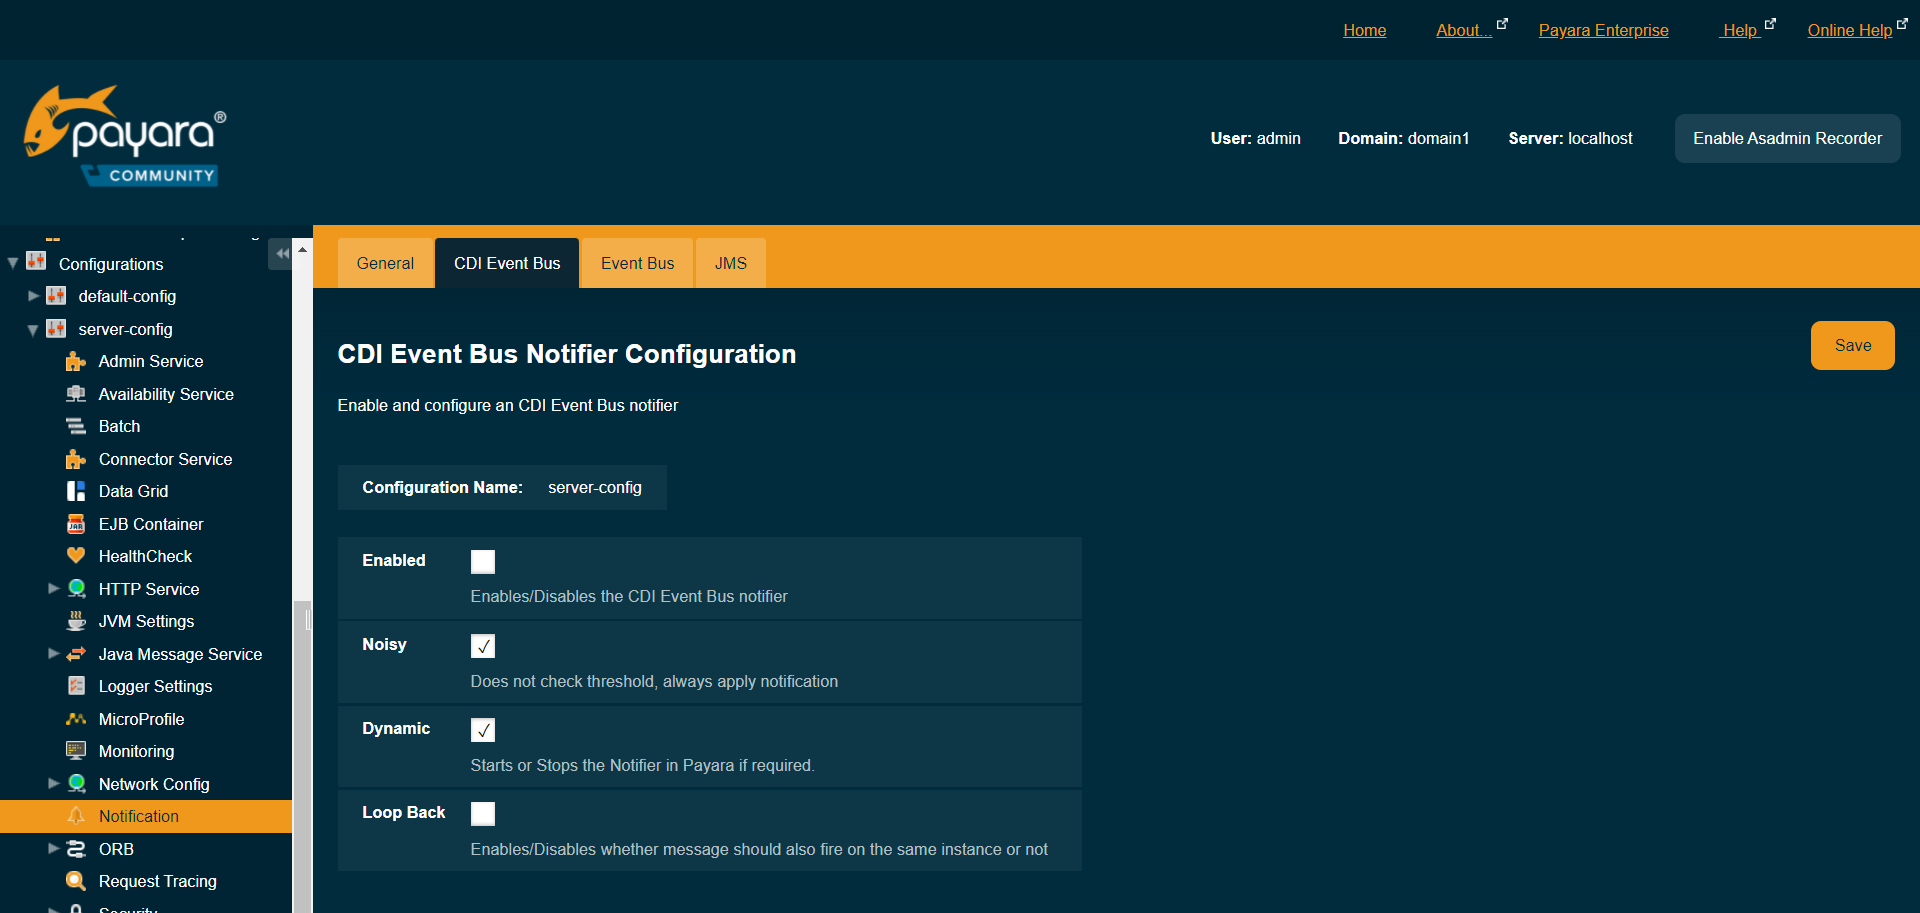
The following options are available:
Enabled-
Enables/disables the notifier.
Dynamic-
Applies changes to the notifier without a server restart.
Loop Back-
Whether events should also be observed on the same instance that triggered the instance or not.
To make these changes via the Asadmin CLI, use the following subcommand:
asadmin> set-cdieventbus-notifier-configuration --loopBack=true --dynamic=true --enabled=true --hazelcastEnabled=trueTo check the current applied configuration from asadmin, run the command:
asadmin get-cdieventbus-notifier-configuration

Enabled  Noisy  Loopback
false    true   false
Command get-cdieventbus-notifier-configuration executed successfully.
Observing Notification Events
Any application deployed to any instance in the Data Grid can observe notification events triggered by the CDI Event bus notifier.
Event messages are instances of the EventbusMessage class, which provides structured data about the specific event type, such as HealthCheckNotificationData or RequestTracingNotificationData. It also provides the same information in a String form in the title and message fields.
Notification events can be observed as a standard @Inbound CDI event of type EventbusMessage or its super-types:
@RequestScoped
public class ObserverBean{

    public void observe(@Observes @Inbound EventbusMessage event) {
        var shortInfo = event.getSubject();
        var detailedMessage = event.getMessage();

        var domainName = event.getDomain();
        var sourceInstanceName = event.getInstance();

        if (event.getData() instanceof HealthCheckNotificationData) {
            Optional<HealthCheckResultEntry> mostCritical = event.getData()
            .as(HealthCheckNotificationData.class).getEntries()
            .stream().sorted().findFirst();
        }
    }
}
For an application to use the Inbound annotation and EventbusMessage class, it will have to define the Payara Public API as a project dependency.
|
Monitoring Service Notifiers Configuration
The Monitoring service can be configured to send notifications using the notification service. This allows you to forward data from exposed MBeans to your configured notifiers.
Configuration
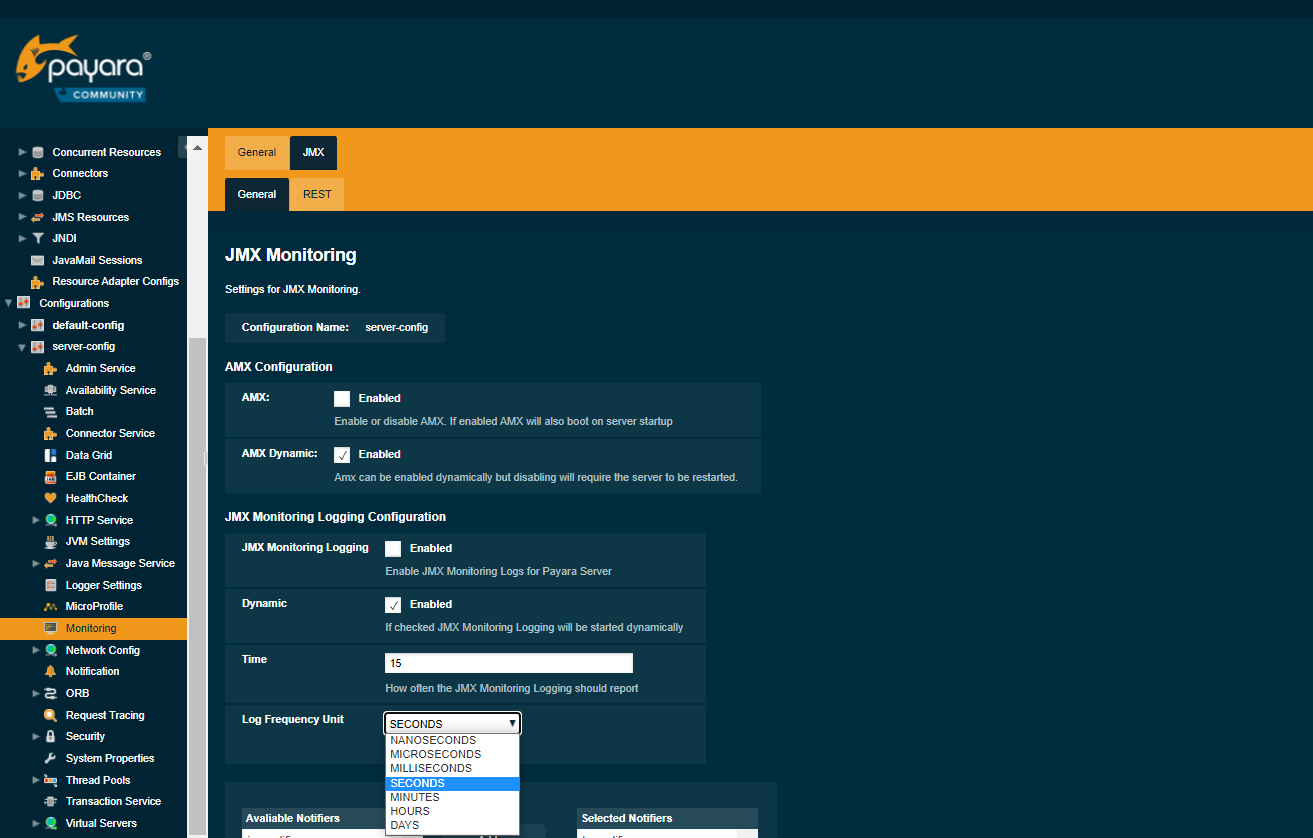
The Monitoring service configuration page can be found under Configurations → <config-name> → Monitoring.
The JMX page allows you to specify the time between notifications, how notifications will be delivered, and the MBeans which will be included within the message.
Enabling Monitoring Service
To configure notification settings for JMX Monitoring, you will need to enable it. Have a look at How To Enable JMX Monitoring
| You will need some MBean attributes configured for anything to be logged by the notifiers. |
JMX monitoring notifications can be done through the Admin Console or asadmin commands.
Configuring JMX Monitoring Time via the Admin Console
To configure the frequency of logged data, enter both the intended frequency of logs and the unit of time.
For example, to log every 30 milliseconds:
Configuring JMX Monitoring Time via Asadmin CLI
To configure the data logging frequency via asadmin, use the following command:
asadmin> set-jmx-monitoring-configuration --logfrequency <frequency> --logfrequencyunit NANOSECONDS|MICROSECONDS|MILLISECONDS|SECONDS|MINUTES|HOURS|DAYSAdding Notifiers via the Admin Console
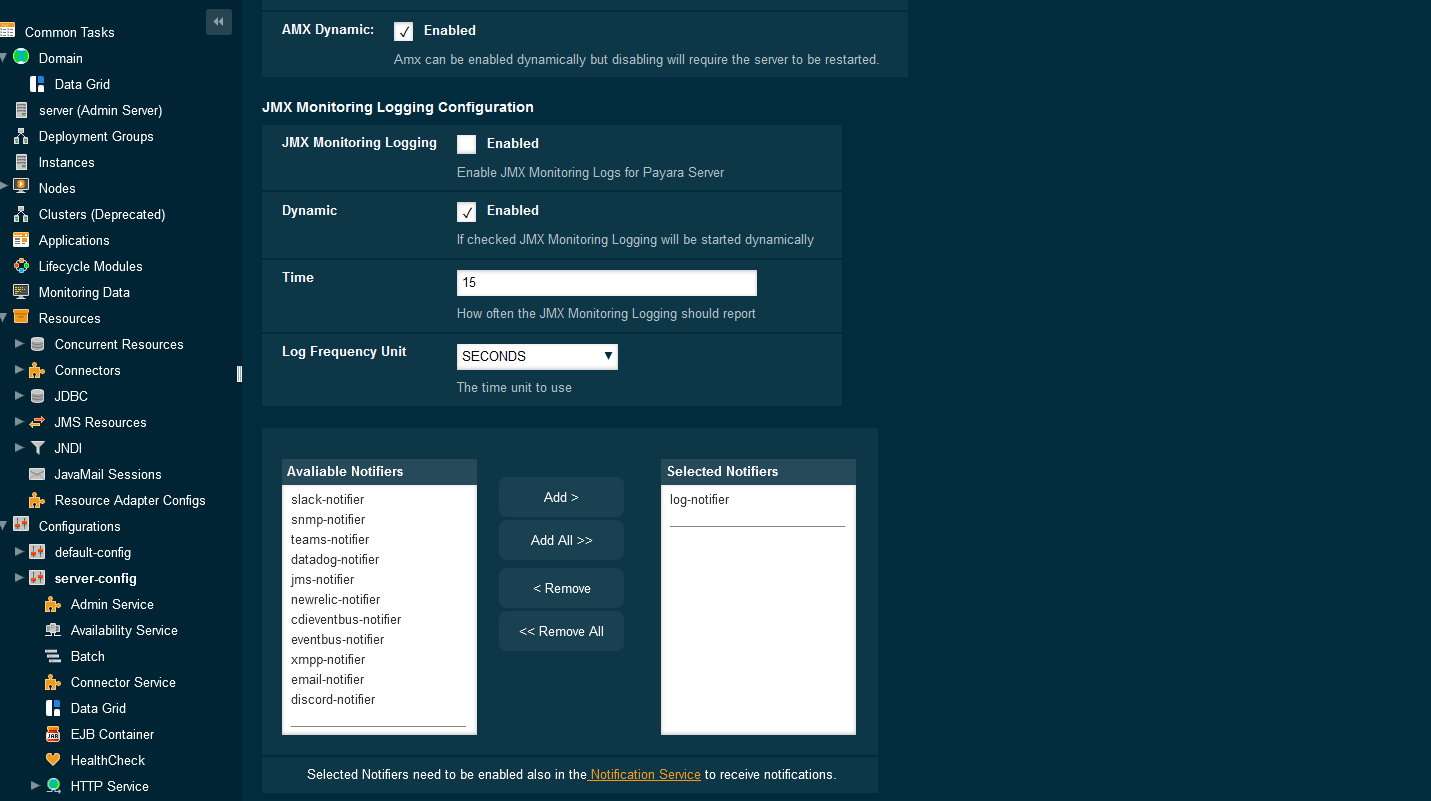
Before you receive notifications from your chosen notifier, please ensure that you have configured the notification service beforehand.
To select notifiers to use for JMX Monitoring, hold the CTRL or SHIFT key
to select multiple notifiers, and then click Add >.
Adding Notifiers via asadmin
For each notifier you wish to enable use the following command:
asadmin set-jmx-monitoring-configuration --setNotifiers=log-notifier,jms-notifier,cdieventbus-notifier --dynamic=trueBy using the setNotifiers option, you can set the current list of notifiers updated by the Monitoring service.
You can get the list of all available notifiers by using the list-notifiers asadmin command.
|