Payara Server includes a HealthCheck Service that is disabled by default. When enabled it can periodically check the following performance metrics:
-
Host CPU Usage
-
Host Memory Usage
-
Payara Server’s JVM Garbage Collections
-
Payara Server’s JVM Heap Usage
-
CPU Usage of individual threads
-
Detects stuck threads
-
Monitors metrics exposed by MicroProfile Metrics
If there is a problem with any of these metrics, and they exceed a configurable threshold then a GOOD, WARNING or CRITICAL event notification is sent to the Notification Service.
This allows operations teams to rapidly detect problems or work out what happened after these problems have occurred.
| It is possible to display metrics produced by HealthCheck service on MicroProfile Health REST endpoints. |
| The Host Memory Usage currently only works on Linux and BSD operating system derivatives. |
If the Log Notifier is enabled, such events will be presented in the server’s log file like in the following sample:
[2016-05-24T03:52:28.690+0000] [Payara 6.2024.5] [INFO] [fish.payara.nucleus.healthcheck.HealthCheckService] [tid: _ThreadID=72 _ThreadName=healthcheck-service-3 [timeMillis: 1464061948690] [levelValue: 800] [[ CPUC:Health Check Result:[[status=WARNING, message='CPU%: 75.6, Time CPU used: 267 milliseconds'']']]] [2016-05-24T21:11:36.579+0000] [Payara 4.1] [SEVERE] [fish.payara.nucleus.healthcheck.HealthCheckService] [tid: _ThreadID=71 _ThreadName=healthcheck-service-3] [timeMillis: 1464124296579] [levelValue: 1000] [[ HOGT:Health Check Result:[[status=CRITICAL, message='Thread with <id-name>: 145-testing-thread-1 is a hogging thread for the last 59 seconds 999 milliseconds'']']]]HealthCheck Service Configuration
As with any other services available in Payara Server, the HealthCheck service can be configured by using the web console or by using administration commands.
Using the Web Administration Console
To configure the HealthCheck Service in the Administration Console, go to Configuration → [instance-configuration (like server-config)] → Healthcheck:
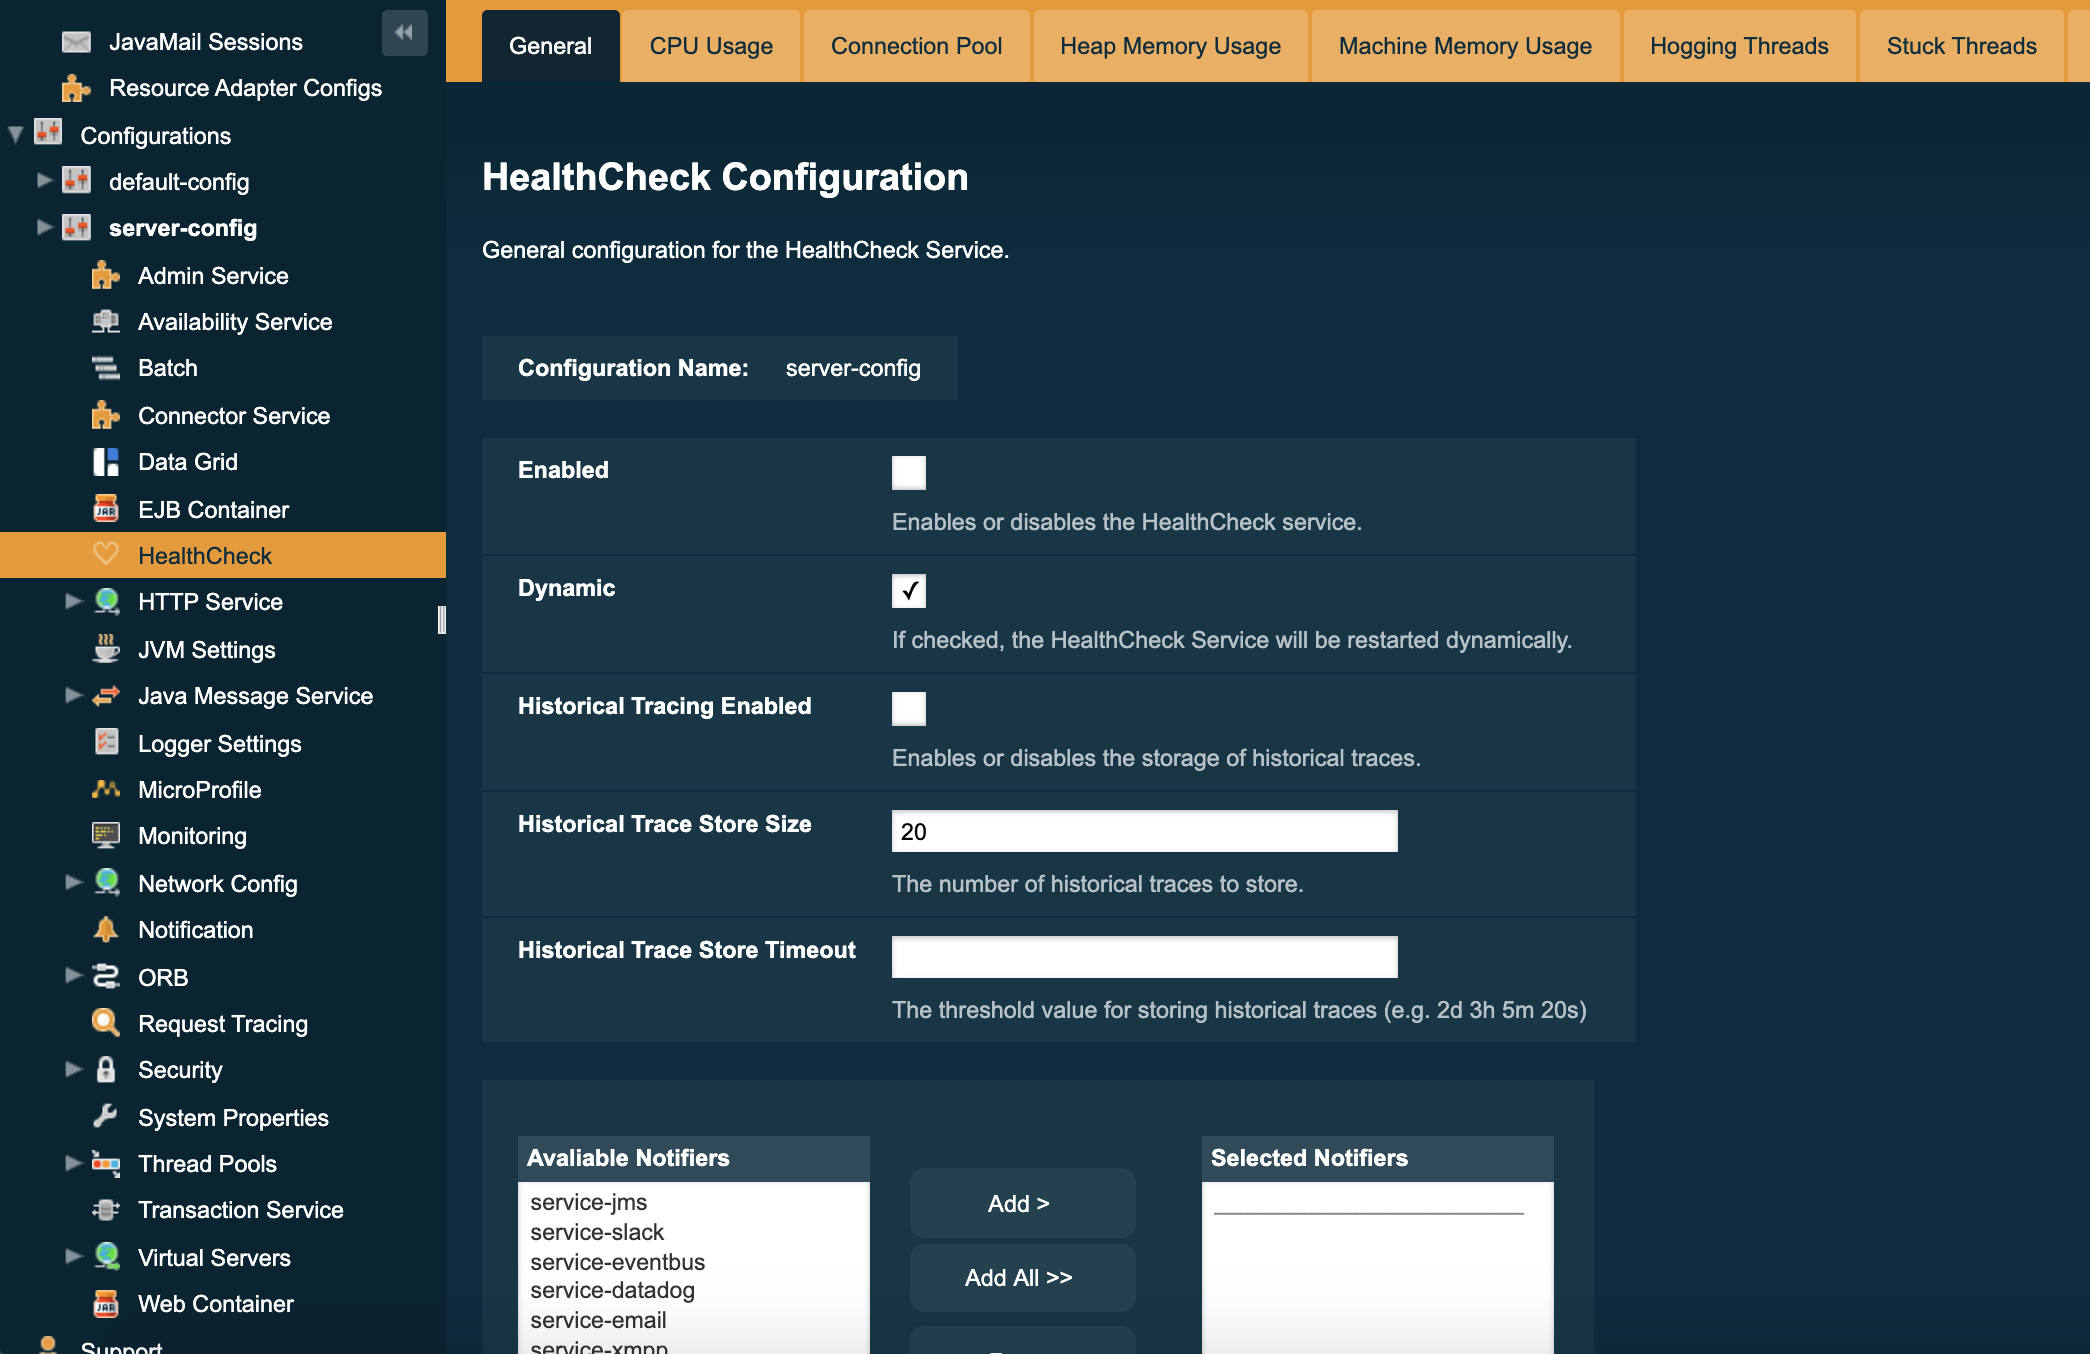
Check the Enabled box (and the Dynamic box too if you don’t want to restart the domain) to switch the HealthCheck service on.
The general settings of the service are:
- Threshold Unit
-
This defines the time duration per unit. The accepted options are any valid java.util.concurrent.TimeUnit values.
The default value is SECONDS. - Threshold Value
-
This defines the number of units beyond which a request will be traced.
- Store Historic Traces
-
When present, enables the storage of the slowest historical request trace events.
- Historic Trace Store Size
-
Determines the number of historical trace events that can be stored in memory when historical storing is enabled. The default value is 20 records
Aside from this configuration settings, you can also define which notifiers will be used to relay the HealthCheck events by moving them to the Active Notifiers box.
| Keep in mind that for HealthCheck events to be relayed to the active notifiers, both the Notification Service and each respective notifier must be enabled first. |
|
You don’t need to manually add each notifier on this screen. When enabling a notifier on its configuration screen, the server will automatically add it to the list of active notifiers for the HealthCheck service. This same result occurs when enabling the notifier using the appropriate asadmin command.
|
Configuring the Available Checkers
Each of the available checkers that are used to determine the server’s health can also be configured separately from each other on the admin console. The list of the available checkers is as follows:
- CPU Usage
-
Calculates the CPU usage and prints out the percentage along with the usage time.
- Connection Pool
-
Calculates the ratio of free/used connections available for all JDBC connections pool and prints the percentage of used connections for each active pool.
- Heap Memory Usage
-
Calculates the heap memory usage and prints out the percentage along with initial and committed heap sizes.
- Machine Memory Usage
-
Calculates the machine memory usage and prints out the percentage along with the total and used physical memory size.
- Hogging Threads
-
Identifies the threads that are hogging the CPU.
- Stuck Threads
-
Identifies the threads that are stuck for a specified period of time.
- Garbage Collector
-
Calculates and prints out how many times GC is executed with its elapsed time. The percentage is the ratio of time spent in GC and total time passed.
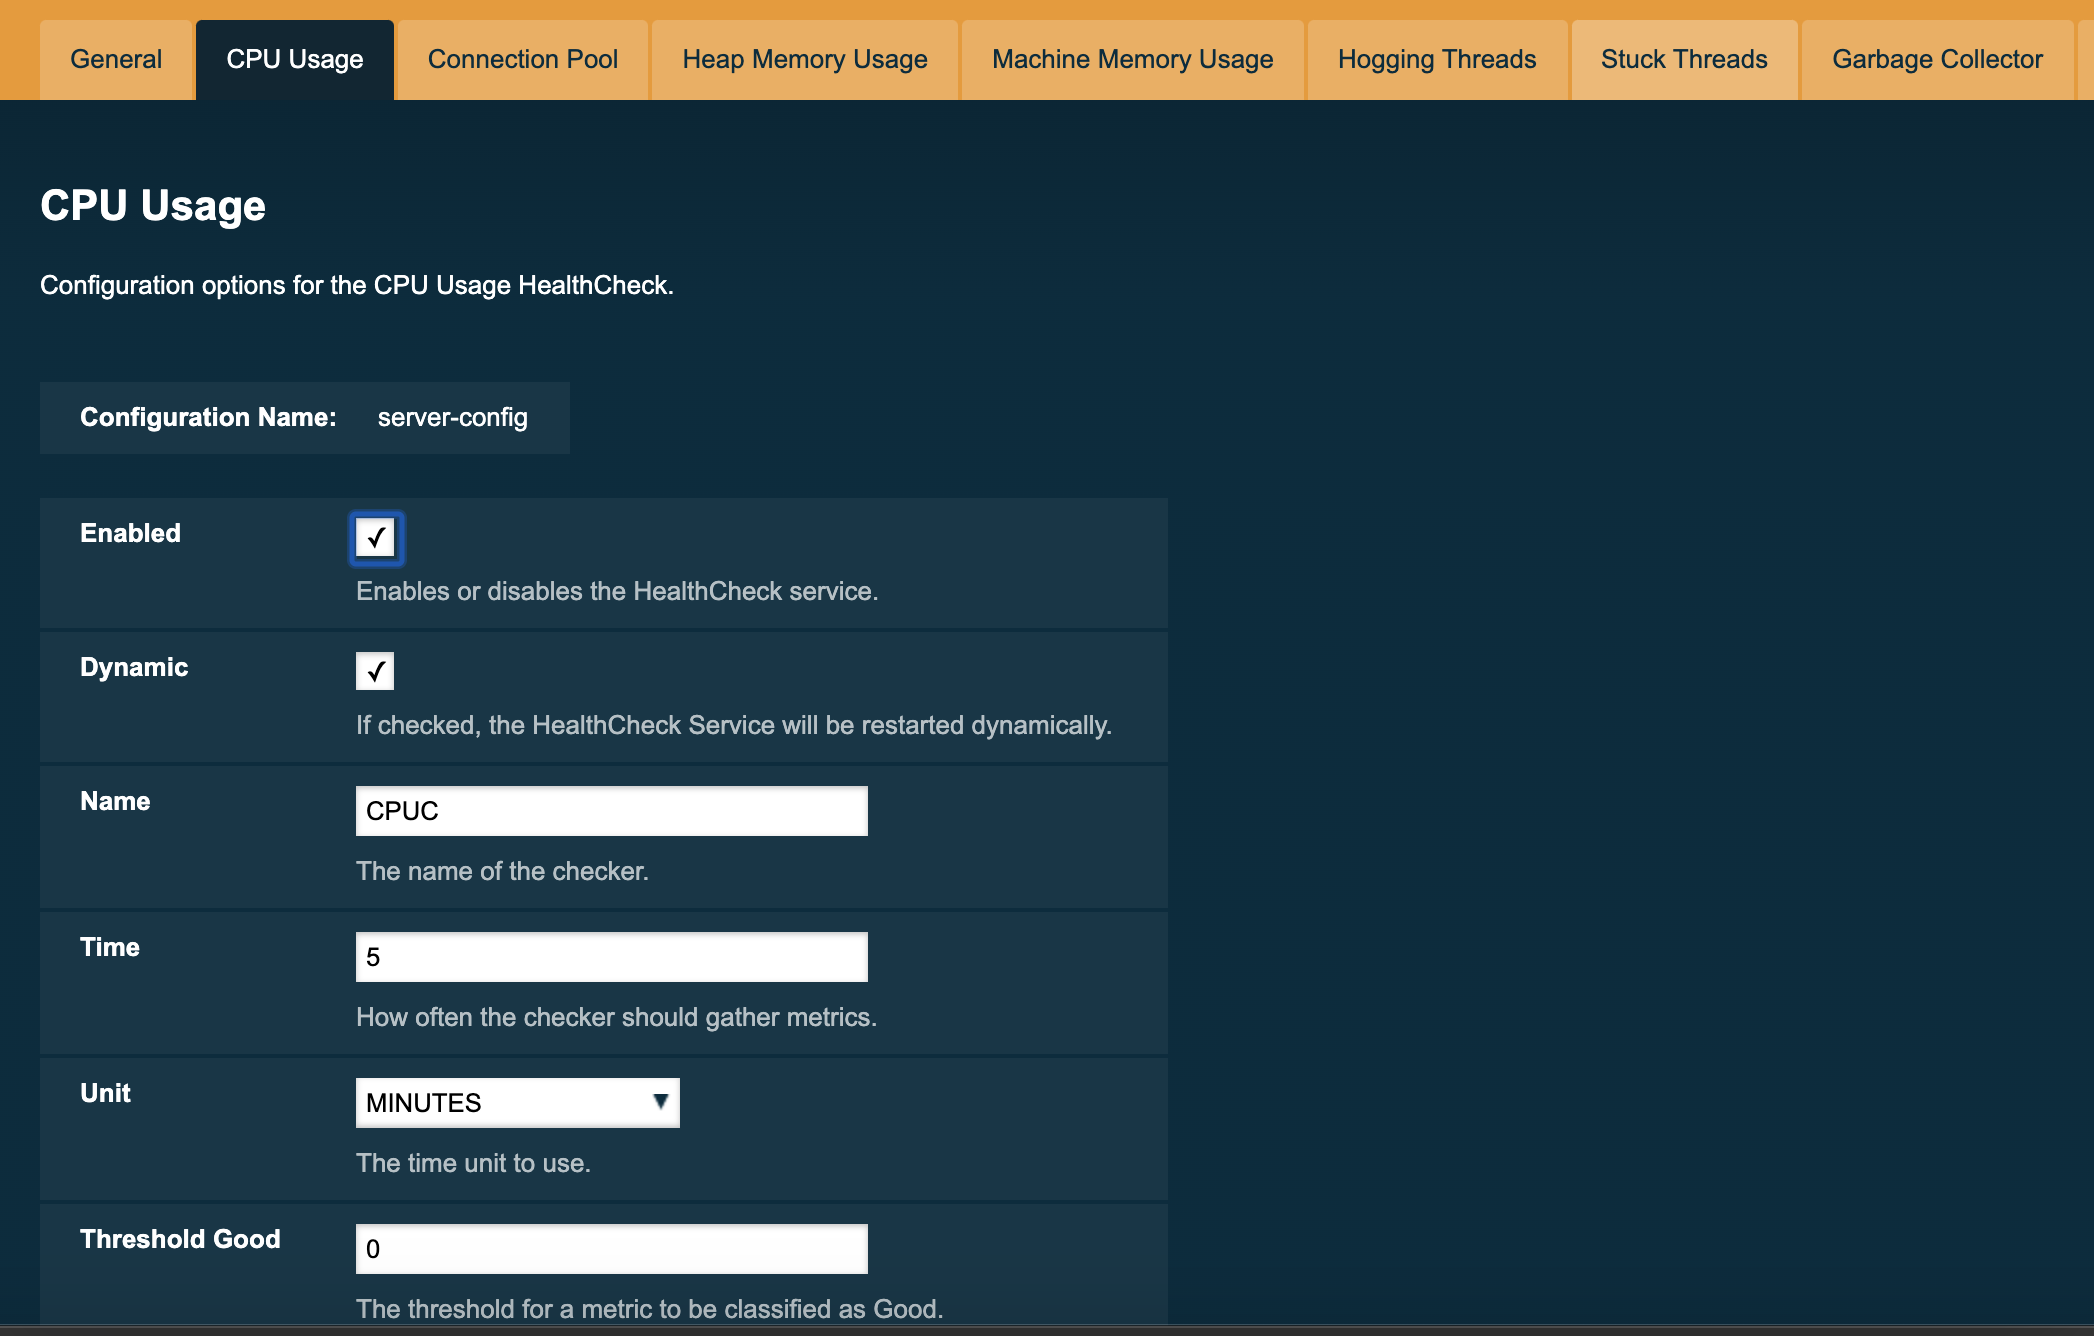
You can configure the settings for each checker on the respective tab in the web console. Here’s a sample image with the current configuration for the CPU Usage checker:
Common HealthCheck Service Checkers Configuration
The following are the configurable attributes available to ALL the HealthCheck Service performance metric checkers:
- Enabled
-
Determines whether the checker is enabled.
- Dynamic
-
Determine whether the changes done to the checker’s configuration are applied immediately or after the server/instance’s restart.
- Name
-
The name or label that the checker will use to identify itself on the notification events. The default names for all checkers are the following:
Checker Default name CPU Usage
CPUCConnection Pool
CONPHeap Memory Usage
HEAPMachine Memory Usage
MEMMHogging Threads
HOGTStuck Threads
STUCKGarbage Collector
GBGC - Time
-
The time interval value (as an
Integer) specified in given unit to execute the checker for the metric. The default value is 5. - Unit
-
This defines the time duration per unit. The accepted options are any valid java.util.concurrent.TimeUnit values.
The default value is MINUTES.
Threshold Range Configuration for HealthCheck Service Checkers
The following attributes are available to the CPU Usage, Connection Pool, Heap Memory Usage, Machine Memory Usage and Garbage Collector checkers:
- Threshold Good
-
The upper numeric boundary (valid
Integer) of the metric used by the checker for the notification event to be classified as GOOD. It has 0 as default value. - Threshold Warning
-
The upper numeric boundary (valid
Integer) of the metric used by the checker for the notification event to be classified as WARNING. It has 50 as default value. - Threshold Critical
-
The upper numeric boundary (valid
Integer) of the metric used by the checker for the notification event to be classified as CRITICAL. It has 80 as default value.
The threshold values range (GOOD - WARNING - CRITICAL) are used to correctly warn users of the health of a specific metric depending on their value when they are measured based on the checking frequency.
For example, if the CPU Usage checker is configured with the default threshold values, and at measuring time, the CPU is performing at 76,8%. Then this notification event would be generated:
Health Check notification with severity level: WARNING - CPUC:Health Check Result:[[status=WARNING, message='CPU%: 76.8, Time CPU used: 171 milliseconds'']']Special HealthCheck Service Checkers Configuration
The Hogging Threads and the Stuck Threads checkers are special on their configuration.
They do not have a threshold range configuration, instead opting for different attributes.
Here’s a configuration sample of the Hogging Threads checker:
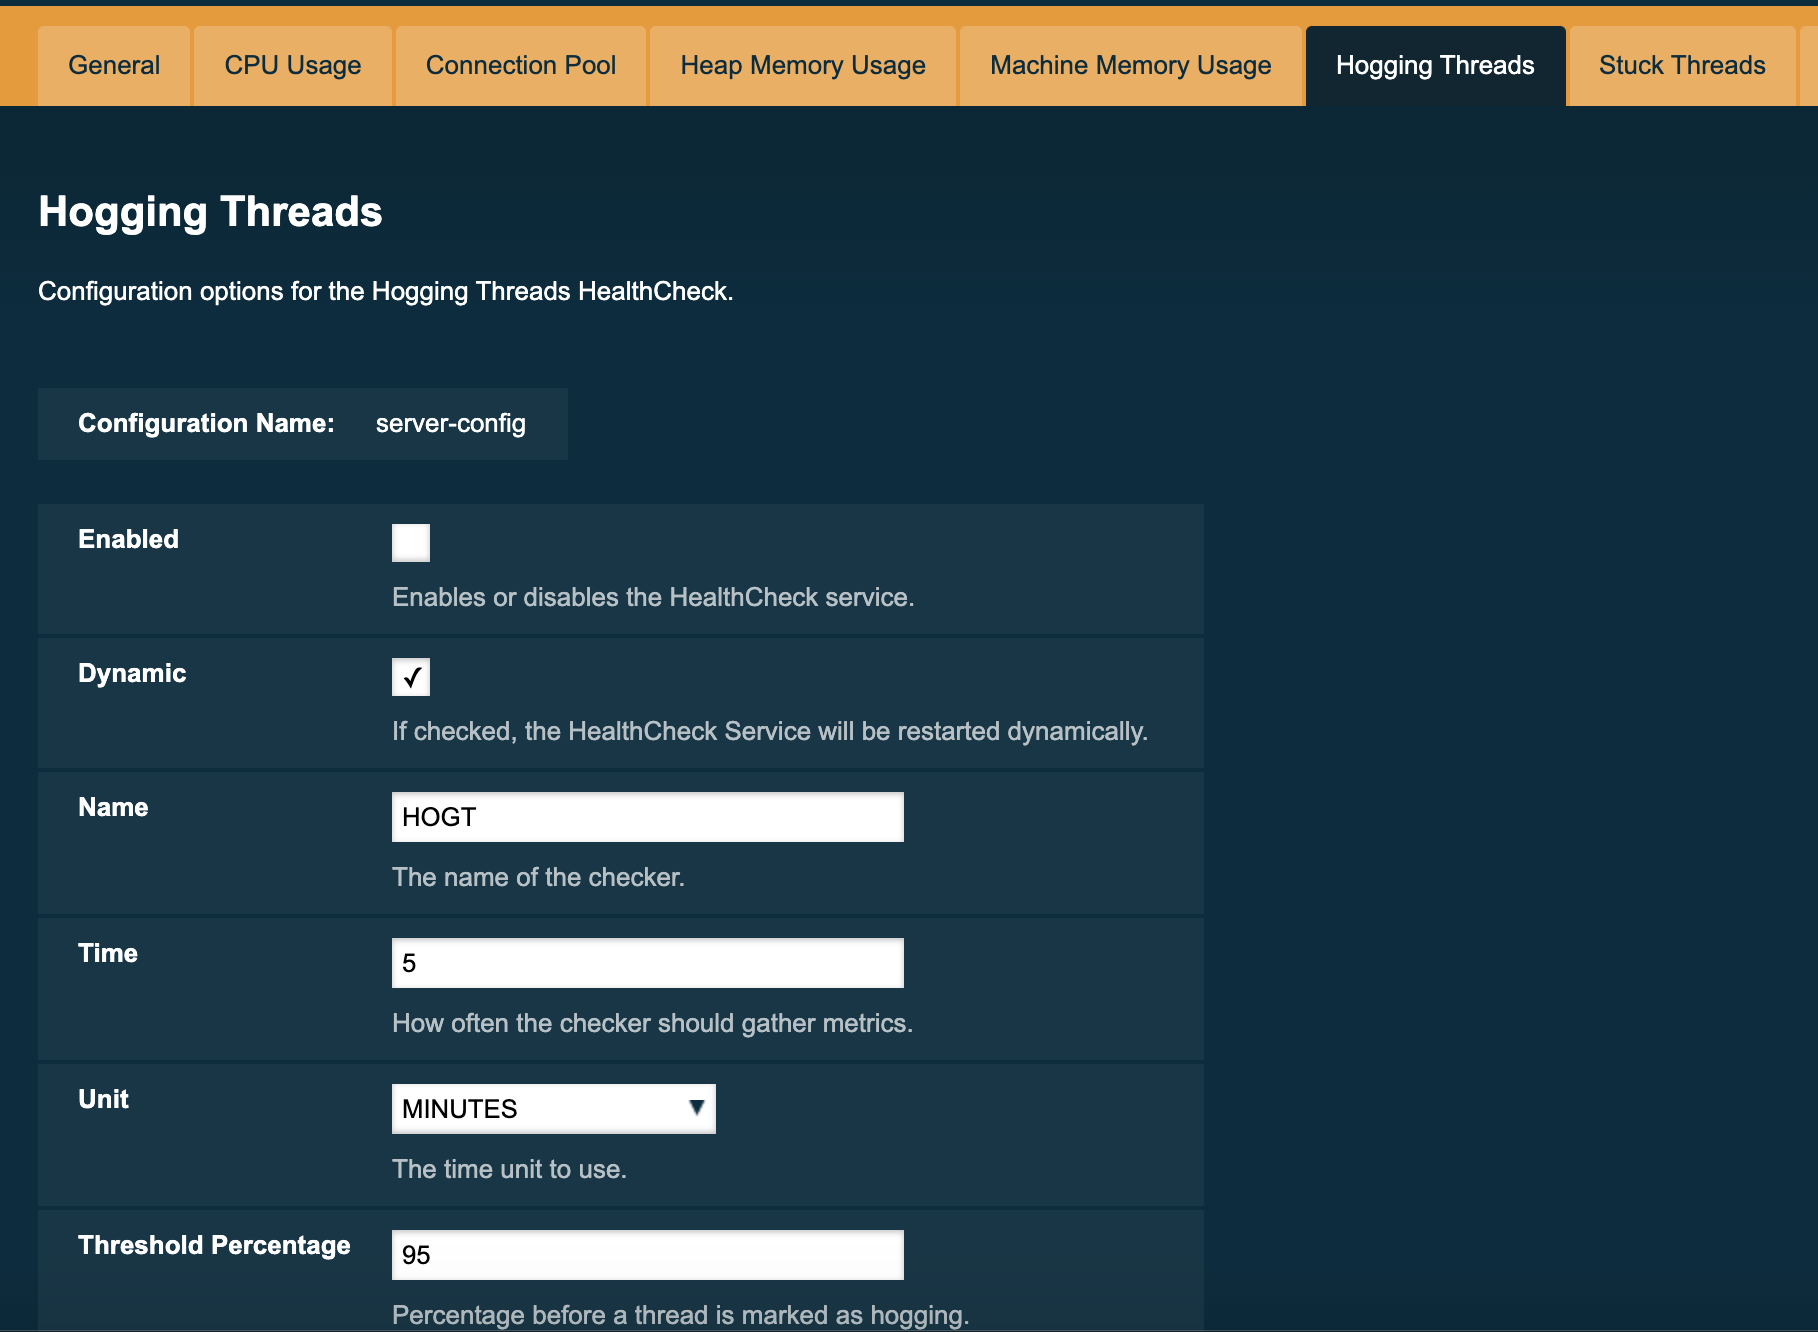
The following are the attributes used to configure this checker:
- Threshold Percentage
-
Defines the minimum percentage needed to decide if the thread is hogged CPU-wise. The percentage is calculated with the ratio of elapsed CPU time to checker execution interval. Its default value is 95.
- Retry Count
-
Represents the count value that should be reached by the hogged thread in order for the service to send notifications. Its default value is 3
And here’s a configuration sample for the Stuck Threads checker:
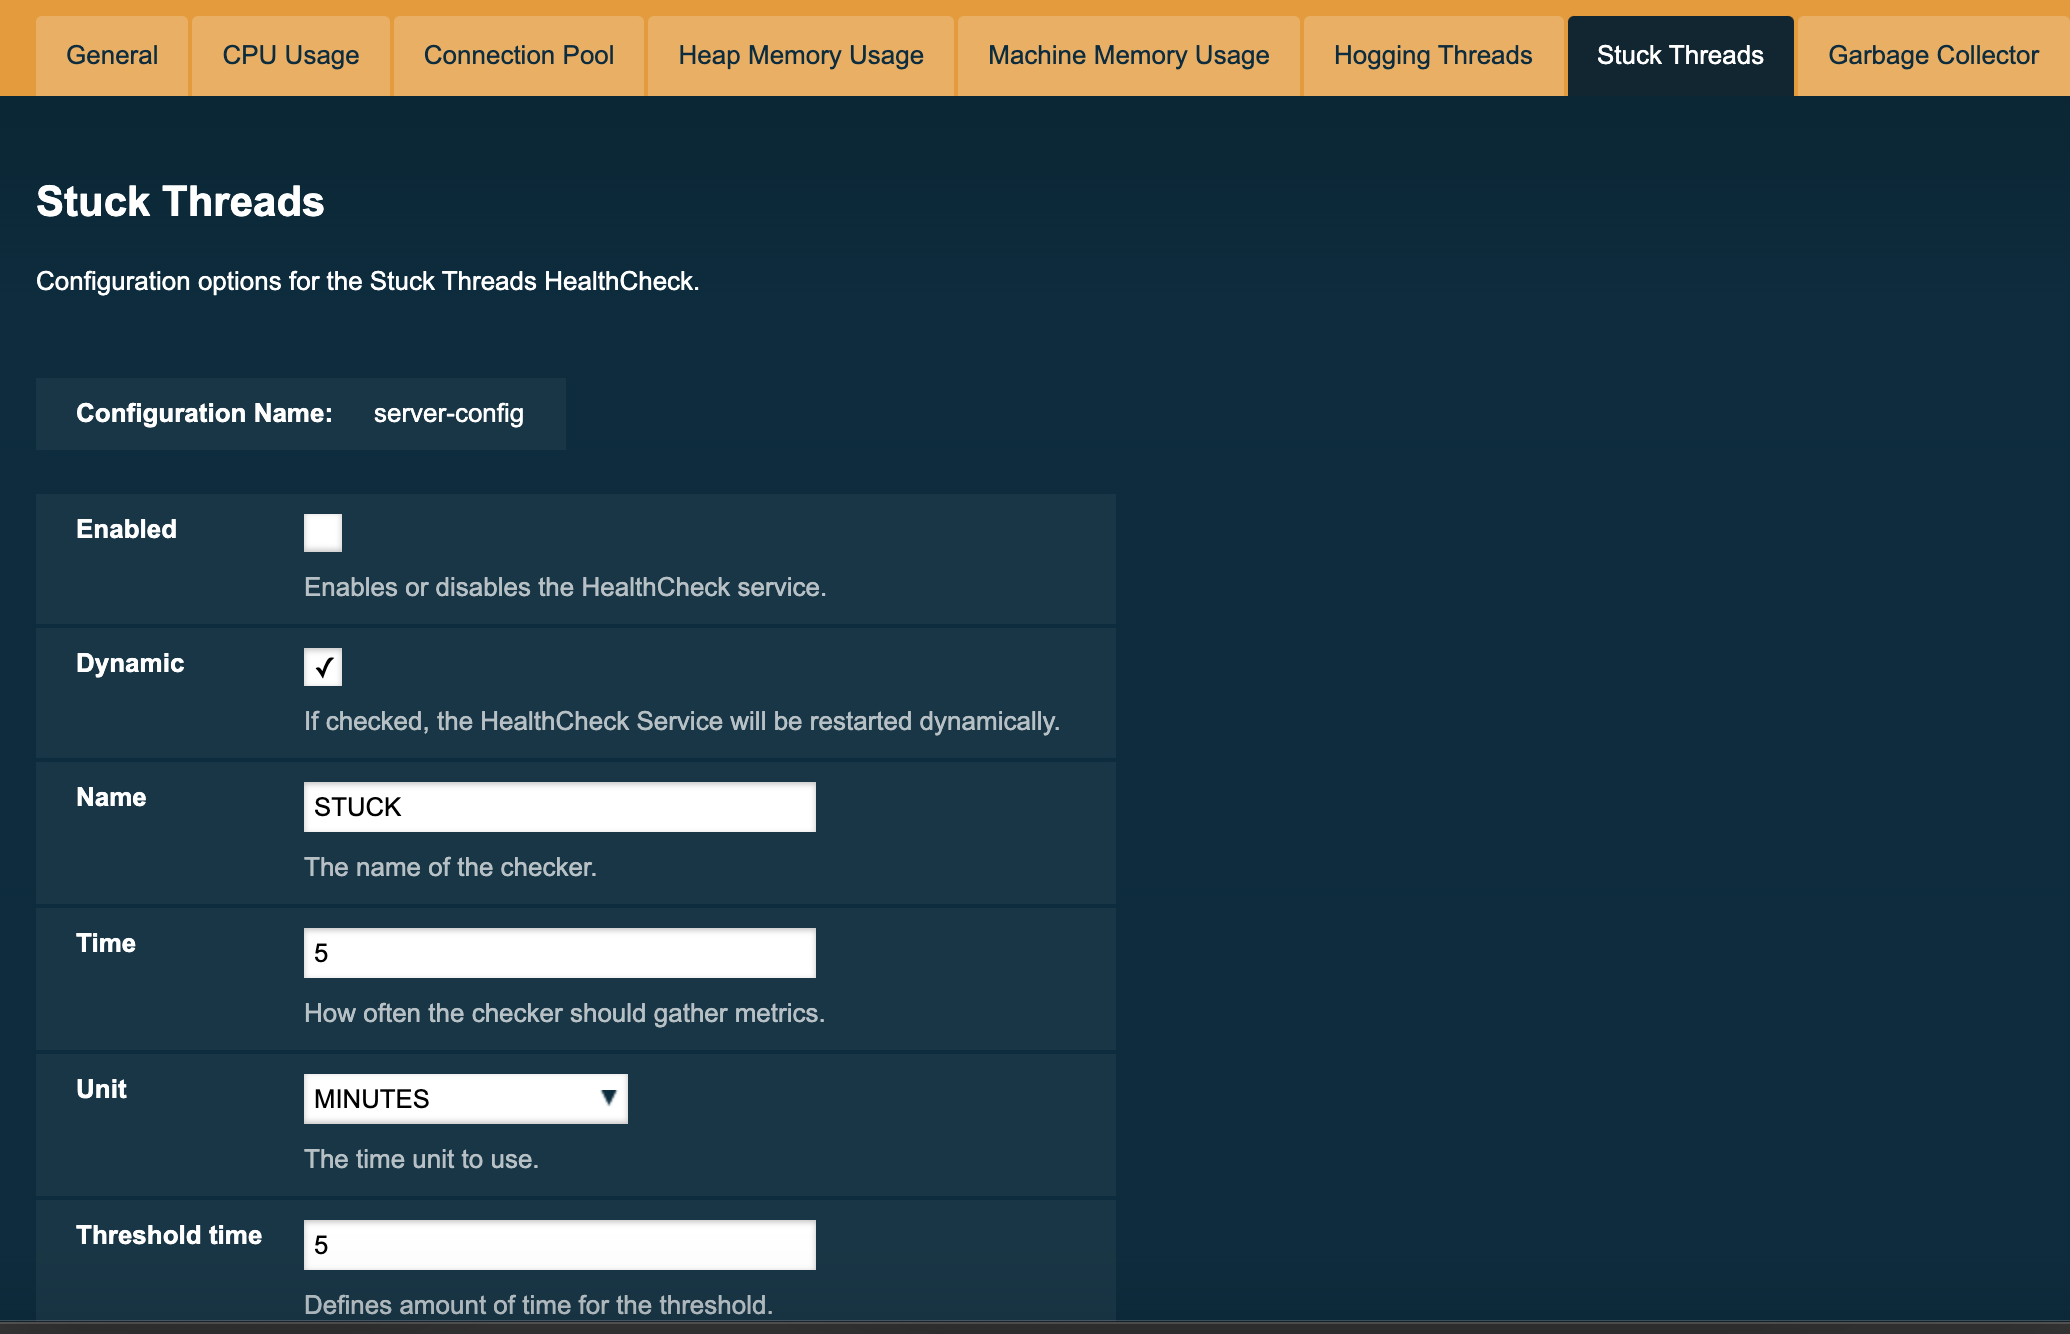
The following are the attributes used to configure this checker:
- Threshold Time
-
Defines the time value for which a thread can be non-responsive before it is considered stuck. It’s default value is 5.
- Threshold Unit
-
Defines the time unit for the value of the Threshold Time field. It’s default value is Minutes.
From the Command Line
You can configure the HealthCheck Service by using the corresponding Asadmin CLI commands.
To enable and configure the general settings of the Healthcheck service, use the set-healthcheck-configuration command. For example, to enable the service such that it will only activate from the next time the server is restarted and to configure the historic trace settings and notifiers used by it run the following command:
asadmin set-healthcheck-configuration --enabled=true --dynamic=true --historic-trace-enabled=true --historic-trace-store-size=20 --set-notifiers=log-notifier,jms-notifiersTo configure specific settings of the various performance metric service checkers, use the set-healthcheck-service-configuration. This command has multiple settings to configure a specific checker’s sampling frequency, threshold values (where applicable) and other specific criteria to each checker service.
As an example, the following command will enable the Garbage Collector checker service and activate it without needing a server restart would be as follows:
asadmin set-healthcheck-service-configuration --enabled=true --service=gc --dynamic=trueA more complex example would be the following command that configures the stuck threads checker to check every 30 seconds for any threads which have been stuck for more than 5 minutes:
asadmin set-healthcheck-service-configuration --service=st --enabled=true --dynamic=true --time=30 --time-unit=SECONDS --stuck-threads-threshold=5 --stuck-threads-threshold-unit=MINUTESFor more information and examples for how to use these Asadmin CLI commands, see the set-healthcheck-configuration and set-healthcheck-service-configuration entries in the Command Reference section.