This chapter explains how to monitor the Payara Server components and services by using the asadmin command-line utility. Instructions for configuring JConsole to monitor Payara Server resources are also provided.
Instructions for monitoring by using the Administration Console are contained in the Administration Console online help.
About Monitoring
Monitoring is the process of reviewing the statistics of a system to improve performance or solve problems. The monitoring service can track and display operational statistics, such as the number of requests per second, the average response time, and the throughput. By monitoring the state of various components and services deployed in Payara Server, you can identify performance bottlenecks, predict failures, perform root cause analysis, and ensure that everything is functioning as expected.Data gathered by monitoring can also be useful in performance tuning and capacity planning.
For this release of Payara Server, monitoring is exposed in a modular way so that many client modules can access and display the monitoring statistics. These clients include the Administration Console, the asadmin utility, AMX, and REST interfaces.
How the Monitoring Tree Structure Works
A monitorable object is a component, subcomponent, or service that can be monitored. Payara Server uses a tree structure to track monitorable objects. Because the tree is dynamic, the tree changes as Payara Server components are added or removed.
In the tree, a monitorable object can have child objects (nodes) that represent exactly what can be monitored for that object. All child objects are addressed using the dot (.) character as a separator. These constructed names are referred to as dotted names. Detailed information on dotted names is available in the dotted-names(5ASC) help page.
The following command lists the monitorable child objects of the instance server:
asadmin> list --monitor "server.*"

server.applications
server.connector-service
server.http-service
server.jms-service
server.jvm
server.network
server.orb
server.resources
server.security
server.thread-pool
server.transaction-service
server.web
Each object is represented by a dotted name. Dotted names can also address specific attributes in monitorable objects. For example, the jvm object has a memory attribute with a statistic called maxheapsize. The following dotted name addresses the attribute:
server.jvm.memory.maxheapsizeAlthough an object is monitorable, it is not necessarily being actively monitored. For instructions on activating monitoring, see Configuring Monitoring.
Tree Structure of Monitorable Objects
Each monitorable object has a hierarchical tree structure. In the tree, a replaceable such as *statistics represents the name of the attribute that you can show statistics for.
Applications Tree Hierarchy
The applications tree contains the following nodes:
server.applications
   |--- application1
   |    |--- ejb-module-1
   |    |        |--- ejb1 *
   |    |                  |--- bean-cache (for entity/sfsb) *
   |    |                  |--- bean-pool (for slsb/mdb/entity) *
   |    |                  |--- bean-methods
   |    |                       |---method1 *
   |    |                       |---method2 *
   |    |                  |--- timers (for s1sb/entity/mdb) *
   |    |--- web-module-1
   |    |        |--- virtual-server-1 *
   |    |                       |---servlet1  *
   |    |                       |---servlet2  *
   |--- standalone-web-module-1
   |    |        |----- virtual-server-2 *
   |    |                       |---servlet3 *
   |    |                       |---servlet4 *
   |    |        |----- virtual-server-3 *
   |    |                       |---servlet3 *(same servlet on different vs)
   |    |                       |---servlet5 *
   |--- standalone-ejb-module-1
   |    |        |--- ejb2 *
   |    |                  |--- bean-cache (for entity/sfsb) *
   |    |                  |--- bean-pool (for slsb/mdb/entity) *
   |    |                  |--- bean-methods
   |    |                       |--- method1 *
   |    |                       |--- method2 *
   |    |                  |--- timers (for s1sb/entity/mdb) *
   |--- jersey-application-1
   |    |--- jersey
   |    |        |--- resources
                           resource-0
                               hitcount
                                    *statistic
   |--- application2
An example dotted name might be:
server.applications.hello.server.request.maxtimeAn example dotted name under the EJB method node might be:
server.applications.ejbsfapp1.ejbsfapp1ejbmod1\.jar.SFApp1EJB1An example Jersey dotted name might be:
server.applications.helloworld-webapp.jersey.resources.resource-0.hitcount.resourcehitcount-countFor available statistics, see EJB Statistics, Jersey Statistics, and Web Statistics.
Connector Service Tree Hierarchy
The connector-service tree holds monitorable attributes for pools such as the connector connection pool. The connector-service tree contains the following nodes:
server.connector-service
        resource-adapter-1
             connection-pools
                  pool-1
             work-management
An example dotted name might be server.connector-service.resource-adapter-1.connection-pools.pool-1. For available statistics, see JMS/Connector Service Statistics.
HTTP Service Tree Hierarchy
The http-service tree contains the following nodes:
server.http-service
       virtual-server
           request
               *statistic
       _asadmin
           request
               *statistic
An example dotted name under the virutal-server node might be server.http-service.virtual-server1.request.requestcount. For available statistics, see HTTP Service Statistics.
JMS/Container Service Tree Hierarchy
The jms-service tree holds monitorable attributes for connection factories (connection pools for resource adapters) and work management (for Message Queue resource adapters). The jms-service tree contains the following nodes:
server.jms-service
        connection-factories
             connection-factory-1
        work-management
An example dotted name under the connection-factories node might be server.jms-service.connection-factories.connection-factory-1 which shows all the statistics for this connection factory. For available statistics, see JMS/Connector Service Statistics.
JVM Tree Hierarchy
The jvm tree contains the following nodes:
server.jvm
           class-loading-system
           compilation-system
           garbage-collectors
           memory
           operating-system
           runtime
An example dotted name under the memory node might be server.jvm.memory.maxheapsize. For available statistics, see JVM Statistics.
Network Tree Hierarchy
The network statistics apply to the network listener, such as admin-listener, http-listener-1, ttp-listener-2. The network tree contains the following nodes:
server.network
          type-of-listener
              keep-alive
                    *statistic
              file-cache
                    *statistic
              thread-pool
                    *statistic
              connection-queue
                     *statistic
An example dotted name under the network node might be server.network.admin-listener.keep-alive.maxrequests-count. For available statistics, see Network Statistics.
ORB Tree Hierarchy
The orb tree holds monitorable attributes for connection managers. The orb tree contains the following nodes:
server.orb
    transport
        connectioncache
            inbound
                *statistic
            outbound
                *statistic
An example dotted name might be server.orb.transport.connectioncache.inbound.connectionsidle-count. For available statistics, see ORB Statistics (Connection Manager).
Resources Tree Hierarchy
The resources tree holds monitorable attributes for pools such as the JDBC connection pool and connector connection pool. The resources tree contains the following nodes:
server.resources
       connection-pool
           request
               *statistic
An example dotted name might be server.resources.jdbc-connection-pool1.numconnfree.count. For available statistics, see Resource Statistics (Connection Pool).
Security Tree Hierarchy
The security tree contains the following nodes:
server.security
       ejb
          *statistic
       web
          *statistic
       realm
          *statistic
An example dotted name might be server.security.realm.realmcount-starttime. For available statistics, see Security Statistics.
Thread Pool Tree Hierarchy
The thread-pool tree holds monitorable attributes for connection managers, and contains the following nodes:
server.thread-pool
                orb
                    threadpool
                            thread-pool-1
                                *statistic
An example dotted name might be server.thread-pool.orb.threadpool.thread-pool-1.averagetimeinqueue-current. For available statistics, see Thread Pool Statistics.
Transactions Service Tree Hierarchy
The transaction-service tree holds monitorable attributes for the transaction subsystem for the purpose of rolling back transactions. The transaction-service tree contains the following nodes:
server.transaction-service
         statistic
An example dotted name might be server.tranaction-service.activeids. For available statistics, see Transaction Service Statistics.
Web Tree Hierarchy
The web tree contains the following nodes:
server.web
           jsp
              *statistic
           servlet
              *statistic
           session
              *statistic
           request
              *statistic
An example dotted name for the servlet node might be server.web.servlet.activeservletsloadedcount. For available statistics, see Web Module Common Statistics.
About Monitoring for Add-on Components
An add-on component typically generates statistics that Payara Server can gather at runtime. Adding monitoring capabilities enables an add-on component to provide statistics to Payara Server in the same way as components that are supplied in the Payara Server distributions. As a result, you can use the same administrative interfaces to monitor statistics from any installed Payara Server component, regardless of the origin of the component.
Tools for Monitoring Payara Server
The following asadmin subcommands are provided for monitoring the ervices and components of Payara Server:
-
The
enable-monitoring,disable-monitoring, or thegetand `set`subcommands are used to turn monitoring on or off. For instructions, see Configuring Monitoring. -
The
monitortypesubcommand is used to display basic data for a particular type of monitorable object. For instructions, see Viewing Common Monitoring Data. -
The
list--monitorsubcommand is used to display the objects that can be monitored with themonitorsubcommand. For guidelines and instructions, see Guidelines for Using thelistandgetSubcommands for Monitoring. -
The
getsubcommand is used to display comprehensive data, such as the attributes and values for a dotted name. Thegetsubcommand used with a wildcard parameter displays all available attributes for any monitorable object. For additional information, see Guidelines for Using thelistandgetSubcommands for Monitoring.
Configuring Monitoring
By default, the monitoring service is enabled for Payara Server, but monitoring for the individual modules is not. To enable monitoring for a module, you change the monitoring level for that module to LOW or HIGH, You can choose to leave monitoring OFF for objects that do not need to be monitored.
-
LOW. Simple statistics, such as create count, byte count, and so on -
HIGH. Simple statistics plus method statistics, such as method count, duration, and so on -
OFF. No monitoring, no impact on performance
To Enable Monitoring
Use the enable-monitoring subcommand to enable the monitoring service itself, or to enable monitoring for individual modules. Monitoring is immediately activated, without restarting Payara Server.
You can also use the set subcommand to enable monitoring for a module. Using the set command is not a dynamic procedure, so you need to restart Payara Server for your changes to take effect.
-
Determine which services and components are currently enabled for monitoring.
asadmin> get server.monitoring-service.module-monitoring-levels.*This example output shows that the HTTP service is not enabled (OFF for monitoring), but other objects are enabled:
configs.config.server-config.monitoring-service.module-monitoring-levels.web-container=HIGH configs.config.server-config.monitoring-service.module-monitoring-levels.http-service=OFF configs.config.server-config.monitoring-service.module-monitoring-levels.jvm=HIGH -
Enable monitoring by using the
enable-monitoringsubcommand. Server restart is not required.
Example - Enable Monitoring
This example enables the monitoring service without affecting monitoring for individual modules.
asadmin> enable-monitoring
Command enable-monitoring executed successfully
Example - Configure Monitoring
This example enables the monitoring service and enables the use of MBeans (JMX Monitoring) and the AMX subsystem in one command:
asadmin> set-monitoring-service-configuration --enabled=true --mbeansenabled=true --amxenabled=true --target=server
Command set-monitoring-service-configuration executed successfully
Example - Enable Monitoring Levels
This example enables monitoring for the HTTP service by setting the monitoring level to HIGH (you must restart the server for changes to take effect).
asadmin> set server.monitoring-service.module-monitoring-levels.http-service=HIGH
Command set executed successfully
An alternative to the previous command that doesn’t require a server restart is the following:
asadmin> set-monitoring-level --module=http-service --level=HIGH --target=serverThe set-monitoring-level command can be used to configure the monitoring levels of multiple modules as well:
asadmin> set-monitoring-level --module=jvm,http-service --level=HIGH --target=serverTo Disable Monitoring
Use the disable-monitoring subcommand to disable the monitoring service itself, or to disable monitoring for individual modules. Monitoring is immediately stopped, without restarting Payara Server.
You can also use the set-monitoring-level subcommand to disable monitoring for a module. To do this, set its --level option to OFF.
-
Determine which modules are enabled for monitoring using the
get-monitoring-levelcommand:asadmin get-monitoring-level --target=server Module Monitoring Level cloud OFF cloud-elasticity OFF cloud-orchestrator OFF cloud-tenant-manager OFF cloud-virt-assembly-service OFF connector-connection-pool OFF connector-service OFF deployment OFF ejb-container OFF http-service LOW jdbc-connection-pool OFF jersey OFF jms-service OFF jpa OFF jvm HIGH orb OFF security OFF thread-pool OFF transaction-service OFF web-container OFF web-services-container OFF Command get-monitoring-level executed successfully.As the io
-
Disable monitoring for a service or module by using the
disable-monitoringsubcommand.
Server restart is not required.
Viewing Common Monitoring Data
Use the monitor subcommand to display basic data on commonly-monitored objects.
To View Common Monitoring Data
Use the --type option of the monitor subcommand to specify the object for which you want to display data, such as httplistener, jvm, webmodule. If you use the monitor subcommand without specifying a type, an error message is displayed.
Output from the subcommand is displayed continuously in a tabular format. The --interval option can be used to display output at a particular interval (the default is 30 seconds).
Before You Begin
A monitorable object must be configured for monitoring before you can display data on the object. See To Enable Monitoring.
-
Determine which type of monitorable object you want to monitor.
Your choices for 5.0 arejvm,httplistener, andwebmodule. -
Request the monitoring data by using the
monitorsubcommand.
Example 8-6 View Common Monitoring Data
This example requests common data for type jvm on instance server.
asadmin> monitor --type jvm server

UpTime(ms)                          Heap and NonHeap Memory(bytes)
current                   min        max        low        high       count

9437266                   8585216    619642880  0          0          93093888
9467250                   8585216    619642880  0          0          93093888
You can also view the full syntax and options of the subcommand by typing asadmin help monitor at the command line.
Common Monitoring Statistics
*HTTP Listener Common Statistics
The statistics available for the httplistener type are shown in the following table.
Table 8-1 HTTP Listener Common Monitoring Statistics
| Statistic | Description |
|---|---|
|
Error count. Cumulative value of the error count |
|
Maximum time. Longest response time for a request; not a cumulative value, but the largest response time from among the response times |
|
Processing time. Cumulative value of the times taken to process each request, with processing time being the average of request processing times over request |
|
Request count. Cumulative number of requests processed so far |
Table 8-2 JVM Common Monitoring Statistics
| Statistic | Description |
|---|---|
|
Amount of memory (in bytes) that is guaranteed to be available for use by the JVM machine |
|
Retained for compatibility with other releases |
|
Retained for compatibility with other releases |
|
The maximum amount of memory that can be used for memory management. |
|
Initial amount of memory (in bytes) that the JVM machine requests from the operating system for memory management during startup |
|
Number of milliseconds that the JVM machine has been running since it was last started |
Web Module Common Statistics
The statistics available for the webmodule type are shown in the following table.
Table 8-3 Web Module Common Monitoring Statistics
| Statistic | Description |
|---|---|
|
Number of active JavaServer Pages (JSP) technology pages that are loaded |
|
Current active sessions |
|
Number of active servlets that are loaded |
|
Total active sessions |
|
Maximum number of JSP pages that are loaded |
|
Maximum number of servlets that are loaded |
|
Total rejected sessions |
|
Total sessions |
|
Total number of JSP pages that are loaded |
|
Total number of servlets that are loaded |
Viewing Comprehensive Monitoring Data
By applying the list and get subcommands against the tree structure using dotted names, you can display more comprehensive monitoring data, such as a description of each of the statistics and its unit of measurement.
Guidelines for Using the list and get Subcommands for Monitoring
The underlying assumptions for using the list and get subcommands with dotted names are:
-
A
listsubcommand that specifies a dotted name that is not followed by a wildcard (*) lists the current node’s immediate children. For example, the following subcommand lists all immediate children belonging to theservernode:list --monitor server -
A
listsubcommand that specifies a dotted name followed by a wildcard of the form.*lists a hierarchical tree of child nodes from the specified node. For example, the following subcommand lists all children of theapplicationsnode, their subsequent child nodes, and so on:list --monitor server.applications.* -
A
listsubcommand that specifies a dotted name preceded or followed by a wildcard of the form *dottedname or dotted * name or dottedname * lists all nodes and their children that match the regular expression created by the specified matching pattern. -
A
getsubcommand followed by a.or agets the set of attributes and their values that belong to the node specified.
For example, the following table explains the output of the list and get subcommands used with the dotted name for the resources node.
Table 8-4 Example Resources Level Dotted Names
| Subcommand | Dotted Name | Output |
|---|---|---|
|
|
List of pool names. |
|
|
No attributes, but a message saying "Use |
|
|
List of attributes and values corresponding to connection pool attributes. |
For detailed information on dotted names, see the dotted-names help page.
To View Comprehensive Monitoring Data
Although the monitor subcommand is useful in many situations, it does not offer the complete list of all monitorable objects. To work with comprehensive data for an object type, use the list monitor and the`get` monitor subcommands followed by the dotted name of a monitorable object.
Before You Begin
A monitorable object must be configured for monitoring before you can display information about the object. See To Enable Monitoring if needed.
-
List the objects that are enabled for monitoring by using the
listsubcommand.
For example, the following subcommand lists all components and services that have monitoring enabled for instanceserver.asadmin> list --monitor "*" server.web server.connector-service server.orb server.jms-serviceserver.jvm server.applications server.http-service server.thread-pools -
Get data for a monitored component or service by using the
getsubcommand.
Example 8-7 Viewing Attributes for a Specific Type
This example gets information about all the attributes for object type jvm on instance server.
asadmin> get --monitor server.jvm.*
server.jvm.class-loading-system.loadedclasscount = 3715
server.jvm.class-loading-system.totalloadedclasscount = 3731
server.jvm.class-loading-system.unloadedclasscount = 16
server.jvm.compilation-system.name-current = HotSpot Client Compiler
server.jvm.compilation-system.totalcompilationtime = 769
server.jvm.garbage-collectors.Copy.collectioncount = 285
server.jvm.garbage-collectors.Copy.collectiontime = 980
server.jvm.garbage-collectors.MarkSweepCompact.collectioncount = 2
server.jvm.garbage-collectors.MarkSweepCompact.collectiontime = 383
server.jvm.memory.committedheapsize = 23498752
server.jvm.memory.committednonheapsize = 13598720
server.jvm.memory.initheapsize = 0
server.jvm.memory.initnonheapsize = 8585216
server.jvm.memory.maxheapsize = 66650112
server.jvm.memory.maxnonheapsize = 100663296
server.jvm.memory.objectpendingfinalizationcount = 0
server.jvm.memory.usedheapsize = 19741184
server.jvm.memory.usednonheapsize = 13398352
server.jvm.operating-system.arch-current = x86
server.jvm.operating-system.availableprocessors = 2
server.jvm.operating-system.name-current = Windows XP
server.jvm.operating-system.version-current = 5.1
server.jvm.runtime.classpath-current = glassfish.jar
server.jvm.runtime.inputarguments-current = []
server.jvm.runtime.managementspecversion-current = 1.0
server.jvm.runtime.name-current = 4372@ABBAGANI_WORK
server.jvm.runtime.specname-current = Java Virtual Machine Specification
server.jvm.runtime.specvendor-current = Sun Microsystems Inc.
server.jvm.runtime.specversion-current = 1.0
server.jvm.runtime.uptime = 84813
server.jvm.runtime.vmname-current = Java HotSpot(TM) Client VM
server.jvm.runtime.vmvendor-current = Sun Microsystems Inc.
server.jvm.runtime.vmversion-current = 1.5.0_11-b03
Example 8-8 Viewing Monitorable Applications
This example lists all the monitorable applications for instance server.
asadmin> list --monitor server.applications.*
server.applications.app1
server.applications.app2
server.applications.app1.virtual-server1
server.applications.app2.virtual-server1
Example 8-9 Viewing Attributes for an Application
This example gets information about all the attributes for application hello.
asadmin> get --monitor server.applications.hello.*
server.applications.hello.server.activatedsessionstotal = 0
server.applications.hello.server.activejspsloadedcount = 1
server.applications.hello.server.activeservletsloadedcount = 1
server.applications.hello.server.activesessionscurrent = 1
server.applications.hello.server.activesessionshigh = 1
server.applications.hello.server.errorcount = 0
server.applications.hello.server.expiredsessionstotal = 0
server.applications.hello.server.maxjspsloadedcount = 1
server.applications.hello.server.maxservletsloadedcount = 0
server.applications.hello.server.maxtime = 0
server.applications.hello.server.passivatedsessionstotal = 0
server.applications.hello.server.persistedsessionstotal = 0
server.applications.hello.server.processingtime = 0.0
server.applications.hello.server.rejectedsessionstotal = 0
server.applications.hello.server.requestcount = 0
server.applications.hello.server.sessionstotal =
server.applications.hello.server.totaljspsloadedcount = 0
server.applications.hello.server.totalservletsloadedcount = 0
Example 8-10 Viewing a Specific Attribute
This example gets information about the jvm attribute runtime.vmversion-current on instance server.
asadmin> get --monitor server.jvm.runtime.vmversion-current
server.jvm.runtime.vmversion-current = 10.0-b23
Comprehensive Monitoring Statistics
You can get comprehensive monitoring statistics by forming a dotted name that specifies the statistic you are looking for. For example, the following dotted name will display the cumulative number of requests for the HTTP service on virtual-server1:
server.http-service.virtual-server1.request.requestcount
EJB Statistics
EJBs fit into the tree of objects as shown in Applications Tree Hierarchy. Use the following dotted name pattern to get EJB statistics for an application:
server.applications.appname.ejbmodulename.ejbname.bean-cache.statistic| EJB statistics for an application are available after the application is executed. If the application is deployed but has not yet been executed, all counts will show default values. When the application is undeployed, all its monitoring data is lost. |
EJB Cache Statistics
Use the following dotted name pattern for EJB cache statistics:
server.applications.appname.ejbmodulename.bean-cache.ejbname.statisticThe statistics available for EJB caches are listed in the following table.
Table 8-5 EJB Cache Monitoring Statistics
| Statistic | Data Type | Description |
|---|---|---|
|
RangeStatistic |
The number of times a user request does not find a bean in the cache. |
|
RangeStatistic |
The number of times a user request found an entry in the cache. |
|
RangeStatistic |
The number of beans in the cache. This is the current size of the cache. |
|
CountStatistic |
Number of passivated beans. Applies only to stateful session beans. |
|
CountStatistic |
Number of errors during passivation. Applies only to stateful session beans. |
|
CountStatistic |
Number of expired sessions removed by the cleanup thread. Applies only to stateful session beans. |
|
CountStatistic |
Number of times passivation completed successfully. Applies only to stateful session beans. |
EJB Container Statistics
Use the following dotted name pattern for EJB container statistics:
server.applications.appname.ejbmodulename.container.ejbnameThe statistics available for EJB containers are listed in the following table.
Table 8-6 EJB Container Monitoring Statistics
| Statistic | Data Type | Description |
|---|---|---|
|
CountStatistic |
Number of times an EJB’s |
|
CountStatistic |
Number of messages received for a message-driven bean. |
|
RangeStatistic |
Number of stateful or stateless session beans that are in the |
|
RangeStatistic |
Number of stateful session beans that are in |
|
RangeStatistic |
Number of entity beans in pooled state. |
|
RangeStatistic |
Number of entity beans in ready state. |
|
CountStatistic |
Number of times an EJB’s |
EJB Method Statistics
Use the following dotted name pattern for EJB method statistics:
server.applications.appname.ejbmodulename.bean-methods.ejbname.statisticThe statistics available for EJB method invocations are listed in the following table.
Table 8-7 EJB Method Monitoring Statistics
| Statistic | Data Type | Description |
|---|---|---|
|
CountStatistic |
Time, in milliseconds, spent executing the method for the last successful/unsuccessful attempt to run the operation. This is collected for stateless and stateful session beans and entity beans if monitoring is enabled on the EJB container. |
|
TimeStatistic |
Number of times an operation is called; the total time that is spent during the invocation, and so on. |
|
CountStatistic |
Number of times the method execution resulted in an exception. This is collected for stateless and stateful session beans and entity beans if monitoring is enabled for the EJB container. |
|
CountStatistic |
Number of times the method successfully executed. This is collected for stateless and stateful session beans and entity beans if monitoring enabled is true for EJB container. |
EJB Pool Statistics
Use the following dotted name pattern for EJB pool statistics:
server.applications.appname.ejbmodulename.bean-pool.ejbname.statisticThe statistics available for EJB pools are listed in the following table.
Table 8-8 EJB Pool Monitoring Statistics
| Statistic | Data Type | Description |
|---|---|---|
|
CountStatistic |
The maximum number of messages to load into a JMS session at one time for a message-driven bean to serve. Default is 1. Applies only to pools for message driven beans. |
|
RangeStatistic |
Number of EJBs in the associated pool, providing information about how the pool is changing. |
|
RangeStatistic |
Number of threads waiting for free beans, giving an indication of possible congestion of requests. |
|
CountStatistic |
Number of beans created in associated pool since the gathering of data started. |
|
CountStatistic |
Number of beans destroyed from associated pool since the gathering of data started. |
Timer Statistics
Use the following dotted name pattern for timer statistics:
server.applications.appname.ejbmodulename.timers.ejbname.statisticThe statistics available for timers are listed in the following table.
Table 8-9 Timer Monitoring Statistics
| Statistic | Data Type | Description |
|---|---|---|
|
CountStatistic |
Number of timers created in the system. |
|
CountStatistic |
Number of timers delivered by the system. |
|
CountStatistic |
Number of timers removed from the system. |
HTTP Service Statistics
The HTTP service fits into the tree of objects as shown in HTTP Service Tree Hierarchy.
HTTP Service Virtual Server Statistics
Use the following dotted name pattern for HTTP service virtual server statistics:
server.http-service.virtual-server.request.statisticThe HTTP service statistics for virtual servers are shown in the following table.
Table 8-10 HTTP Service Virtual Server Monitoring Statistics
| Statistic | Data Type | Description |
|---|---|---|
|
CountStatistic |
Number of responses with a status code equal to 200 |
|
CountStatistic |
Number of responses with a status code in the 2xx range |
|
CountStatistic |
Number of responses with a status code equal to 302 |
|
CountStatistic |
Number of responses with a status code equal to 304 |
|
CountStatistic |
Number of responses with a status code equal in the 3xx range |
|
CountStatistic |
Number of responses with a status code equal to 400 |
|
CountStatistic |
Number of responses with a status code equal to 401 |
|
CountStatistic |
Number of responses with a status code equal to 403 |
|
CountStatistic |
Number of responses with a status code equal to 404 |
|
CountStatistic |
Number of responses with a status code equal in the 4xx range |
|
CountStatistic |
Number of responses with a status code equal to 503 |
|
CountStatistic |
Number of responses with a status code equal in the 5xx range |
|
CountStatistic |
Number of responses with a status code outside the 2xx, 3xx, 4xx, and 5xx range |
|
CountStatistic |
Cumulative value of the error count, with error count representing the number of cases where the response code was greater than or equal to 400 |
|
StringStatistic |
The host (alias) names of the virtual server |
|
CountStatistic |
Longest response time for a request; not a cumulative value, but the largest response time from among the response times |
|
CountStatistic |
Cumulative value of the times taken to process each request, with processing time being the average of request processing times over the request count |
|
CountStatistic |
Cumulative number of requests processed so far |
|
StringStatistic |
The state of the virtual server |
Jersey Statistics
Jersey fits into the tree of objects as shown in Applications Tree Hierarchy.
Use the following dotted name pattern for Jersey statistics:
server.applications.jersey-application.jersey.resources.resource-0.hitcount.statisticThe statistics available for Jersey are shown in the following table.
Table 8-11 Jersey Statistics
| Statistic | Data Type | Description |
|---|---|---|
|
CountStatistic |
Number of hits on this resource class |
|
CountStatistic |
Number of hits on this root resource class |
JMS/Connector Service Statistics
The JMS/Connector Service fits into the tree of objects as shown in JMS/Container Service Tree Hierarchy.
Connector Connection Pool Statistics (JMS)
Use the following dotted name pattern for JMS/Connector Service connection pool statistics:
server.connector-service.resource-adapter-1.connection-pool.statisticJMS/Connector Service statistics available for the connector connection pools are shown in the following table.
| In order to improve system performance, connection pools are initialized lazily; that is, a pool is not initialized until an application first uses the pool or the pool is explicitly pinged. Monitoring statistics for a connection pool are not available until the pool is initialized. |
Table 8-12 Connector Connection Pool Monitoring Statistics (JMS)
| Statistic | Data Type | Description |
|---|---|---|
|
CountStatistic |
Average wait time of connections before they are serviced by the connection pool. |
|
RangeStatistic |
The longest and shortest wait times of connection requests. The current value indicates the wait time of the last request that was serviced by the pool. |
|
CountStatistic |
Total number of connections in the connection pool that failed validation from the start time until the last sample time. |
|
RangeStatistic |
Total number of connections that are currently being used, as well as information about the maximum number of connections that were used (the high watermark). |
|
RangeStatistic |
Total number of free connections in the pool as of the last sampling. |
|
CountStatistic |
Total number of connections in the pool that timed out between the start time and the last sample time. |
|
CountStatistic |
Number of physical connections, in milliseconds, that were created since the last reset. |
|
CountStatistic |
Number of physical connections that were destroyed since the last reset. |
|
CountStatistic |
Number of logical connections acquired from the pool. |
|
CountStatistic |
Number of logical connections released to the pool. |
|
CountStatistic |
Number of connection requests in the queue waiting to be serviced. |
Connector Work Management Statistics (JMS)
Use the following dotted name pattern for JMS/Connector Service work management statistics:
server.connector-service.resource-adapter-1.work-management.statisticJMS/Connector Service statistics available for connector work management are listed in the following table.
Table 8-13 Connector Work Management Monitoring Statistics (JMS)
| Statistic | Data Type | Description |
|---|---|---|
|
RangeStatistic |
Number of work objects executed by the connector. |
|
CountStatistic |
Number of work objects that were completed. |
|
CountStatistic |
Number of work objects rejected by the Payara Server. |
|
CountStatistic |
Number of work objects submitted by a connector module. |
|
RangeStatistic |
Number of work objects waiting in the queue before executing. |
|
RangeStatistic |
Longest and shortest wait of a work object before it gets executed. |
JVM Statistics
The JVM fits into the tree of objects as show in JVM Tree Hierarchy.
JVM Class Loading System Statistics
Use the following dotted name pattern for JVM class loading system statistics:
server.jvm.class-loading-system.statisticWith Java SE, additional monitoring information can be obtained from the JVM. Set the monitoring level to LOW to enable the display of this additional information. Set the monitoring level to HIGH to also view information pertaining to each live thread in the system. More information about the additional monitoring features for Java SE is available in Monitoring and Management for the Java Platform .
The Java SE monitoring tools are discussed at https://docs.oracle.com/en/java/javase/17/docs/specs/man/index.html.
The statistics that are available for class loading in the JVM for Java SE are shown in the following table.
Table 8-14 JVM Monitoring Statistics for Java SE Class Loading
| Statistic | Data Type | Description |
|---|---|---|
|
CountStatistic |
Number of classes that are currently loaded in the JVM |
|
CountStatistic |
Total number of classes that have been loaded since the JVM began execution |
|
CountStatistic |
Number of classes that have been unloaded from the JVM since the JVM began execution |
The statistics available for threads in the JVM in Java SE are shown in the following table.
Table 8-15 JVM Monitoring Statistics for Java SE - Threads
| Statistic | Data Type | Description |
|---|---|---|
|
StringStatistic |
List of all live thread ids. |
|
CountStatistic |
CPU time for the current thread (in nanoseconds) if CPU time measurement is enabled. If CPU time measurement is disabled, returns -1. |
|
CountStatistic |
Current number of live daemon threads. |
|
StringStatistic |
List of thread ids that are monitor deadlocked. |
|
CountStatistic |
Peak live thread count since the JVM started or the peak was reset. |
|
CountStatistic |
Current number of live daemon and non-daemon threads. |
|
CountStatistic |
Total number of threads created and/or started since the JVM started. |
JVM Compilation System Statistics
Use the following dotted name pattern for JVM compilation system statistics:
server.jvm.compilation-system.statisticThe statistics that are available for compilation in the JVM for Java SE are shown in the following table.
Table 8-16 JVM Monitoring Statistics for Java SE Compilation
| Statistic | Data Type | Description |
|---|---|---|
|
StringStatistic |
Name of the current compiler |
|
CountStatistic |
Accumulated time (in milliseconds) spent in compilation |
JVM Garbage Collectors Statistics
Use the following dotted name pattern for JVM garbage collectors statistics:
server.jvm.garbage-collectors.statisticThe statistics that are available for garbage collection in the JVM for Java SE are shown in the following table.
Table 8-17 JVM Monitoring Statistics for Java SE Garbage Collectors
| Statistic | Data Type | Description |
|---|---|---|
|
CountStatistic |
Total number of collections that have occurred |
|
CountStatistic |
Accumulated time (in milliseconds) spent in collection |
JVM Memory Statistics
Use the following dotted name pattern for JVM memory statistics:
server.jvm.memory.statisticThe statistics that are available for memory in the JVM for Java SE are shown in the following table.
Table 8-18 JVM Monitoring Statistics for Java SE Memory
| Statistic | Data Type | Description |
|---|---|---|
|
CountStatistic |
Amount of heap memory (in bytes) that is committed for the JVM to use |
|
CountStatistic |
Amount of non-heap memory (in bytes) that is committed for the JVM to use |
|
CountStatistic |
Size of the heap initially requested by the JVM |
|
CountStatistic |
Size of the non-heap area initially requested by the JVM |
|
CountStatistic |
Maximum amount of heap memory (in bytes) that can be used for memory management |
|
CountStatistic |
Maximum amount of non-heap memory (in bytes) that can be used for memory management |
|
CountStatistic |
Approximate number of objects that are pending finalization |
|
CountStatistic |
Size of the heap currently in use |
|
CountStatistic |
Size of the non-heap area currently in use |
JVM Operating System Statistics
Use the following dotted name pattern for JVM operating system statistics:
server.jvm.operating-system.statisticThe statistics that are available for the operating system for the JVM machine in Java SE are shown in the following table.
Table 8-19 JVM Statistics for the Java SE Operating System
| Statistic | Data Type | Description |
|---|---|---|
|
StringStatistic |
Operating system architecture |
|
CountStatistic |
Number of processors available to the JVM |
|
StringStatistic |
Operating system name |
|
StringStatistic |
Operating system version |
JVM Runtime Statistics
Use the following dotted name pattern for JVM runtime statistics:
server.jvm.runtime.statisticThe statistics that are available for the runtime in the JVM runtime for Java SE are shown in the following table.
Table 8-20 JVM Monitoring Statistics for Java SE Runtime
| Statistic | Data Type | Description |
|---|---|---|
|
StringStatistic |
Classpath that is used by the system class loader to search for class files |
|
StringStatistic |
Input arguments passed to the JVM; not including arguments to the |
|
StringStatistic |
Management specification version implemented by the JVM |
|
StringStatistic |
Name representing the running JVM |
|
StringStatistic |
JVM specification name |
|
StringStatistic |
JVM specification vendor |
|
StringStatistic |
JVM specification version |
|
CountStatistic |
Uptime of the JVM (in milliseconds) |
|
StringStatistic |
JVM implementation name |
|
StringStatistic |
JVM implementation vendor |
|
StringStatistic |
JVM implementation version |
Network Statistics
Network fits into the tree of objects as shown in Network Tree Hierarchy.
Network Keep Alive Statistics
Use the following dotted name pattern for network keep alive statistics:
server.network.type-of-listener.keep-alive.statisticStatistics available for network keep alive are shown in the following table.
Table 8-21 Network Keep Alive Statistics
| Statistic | Data Type | Description |
|---|---|---|
|
CountStatistic |
Number of connections in keep-alive mode. |
|
CountStatistic |
Number of keep-alive connections that timed out. |
|
CountStatistic |
Keep-alive timeout value in seconds. |
|
CountStatistic |
Maximum number of requests allowed on a single keep-alive connection. |
|
CountStatistic |
Number of keep-alive connections that were closed. |
|
CountStatistic |
Number of requests received by connections in keep-alive mode. |
|
CountStatistic |
Number of keep-alive connections that were rejected. |
Network Connection Queue Statistics
Use the following dotted name pattern for network connection queue statistics:
server.network.type-of-listener.connection-queue.statisticStatistics available for network connection queue are shown in the following table.
Table 8-22 Network Connection Queue Statistics
| Statistic | Data Type | Description |
|---|---|---|
|
CountStatistic |
The number of open/active connections |
|
CountStatistic |
Number of times the queue has been too full to accommodate a connection |
|
CountStatistic |
Number of connections currently in the queue |
|
CountStatistic |
Average number of connections queued in the last 15 minutes |
|
CountStatistic |
Average number of connections queued in the last 1 minute |
|
CountStatistic |
Average number of connections queued in the last 5 minutes |
|
CountStatistic |
Total number of connectionsthat have been accepted |
|
CountStatistic |
Total number of connections that have been queued |
|
CountStatistic |
Maximum size of the connection queue |
|
CountStatistic |
Largest number of connections that were in the queue simultaneously |
|
CountStatistic |
(Unsupported) Total number of ticks that connections have spent in the queue |
Network File Cache Statistics
Use the following dotted name pattern for network file cache statistics:
server.network.type-of-listener.file-cache.statisticStatistics available for network file cache are shown in the following table.
Table 8-23 Network File Cache Statistics
| Statistic | Data Type | Description |
|---|---|---|
|
CountStatistic |
Number of hits on cached file content |
|
CountStatistic |
Number of misses on cached file content |
|
CountStatistic |
Current cache size in bytes |
|
CountStatistic |
Number of cache lookup hits |
|
CountStatistic |
Number of hits on cached file info |
|
CountStatistic |
Number of misses on cached file info |
|
CountStatistic |
Size of mapped memory used for caching in bytes |
|
CountStatistic |
Maximum heap space used for cache in bytes |
|
CountStatistic |
Maximum memory map size used for caching in bytes |
|
CountStatistic |
Number of cache lookup misses data type |
|
CountStatistic |
Number of current open cache entries |
Network Thread Pool Statistics
Use the following dotted name pattern for network thread pool statistics:
server.network.type-of-listener.thread-pool.statisticStatistics available for network thread pool are shown in the following table.
Table 8-24 Network Thread Pool Statistics
| Statistic | Data Type | Description |
|---|---|---|
|
CountStatistic |
Core number of threads in the thread pool |
|
CountStatistic |
Provides the number of request processing threads currently in the listener thread pool |
|
CountStatistic |
Provides the number of request processing threads currently in use in the listener thread pool serving requests |
|
CountStatistic |
Maximum number of threads allowed in the thread pool |
|
CountStatistic |
Provides the total number of tasks, which were executed by the thread pool |
ORB Statistics (Connection Manager)
The ORB fits into the tree of objects as shown in ORB Tree Hierarchy.
Use the following dotted name patterns for ORB statistics:
server.orb.transport.connectioncache.inbound.statistic
server.orb.transport.connectioncache.outbound.statistic
The statistics available for the connection manager in an ORB are listed in the following table.
Table 8-25 ORB Monitoring Statistics (Connection Manager)
| Statistic | Data Type | Description |
|---|---|---|
|
CountStatistic |
Total number of connections that are idle to the ORB |
|
CountStatistic |
Total number of connections in use to the ORB |
|
BoundedRangeStatistic |
Total number of connections to the ORB |
Resource Statistics (Connection Pool)
By monitoring connection pool resources you can measure performance and capture resource usage at runtime. Connections are expensive and frequently cause performance bottlenecks in applications. It is important to monitor how a connection pool is releasing and creating new connections and how many threads are waiting to retrieve a connection from a particular pool.
The connection pool resources fit into the tree of objects as shown in Resources Tree Hierarchy.
Use the following dotted name pattern for general connection pool statistics:
server.resources.pool-name.statisticUse the following dotted name pattern for application-scoped connection pool statistics:
server.applications.application-name.resources.pool-name.statisticUse the following dotted name pattern for module-scoped connection pool statistics:
server.applications.application-name.module-name.resources.pool-name.statisticThe connection pool statistics are shown in the following tables.
| In order to improve system performance, connection pools are initialized lazily; that is, a pool is not initialized until an application first uses the pool or the pool is explicitly pinged. Monitoring statistics for a connection pool are not available until the pool is initialized. |
Table 8-26 General Resource Monitoring Statistics (Connection Pool)
| Statistic | Data Type | Description |
|---|---|---|
|
CountStatistic |
Average wait-time-duration per successful connection request |
|
RangeStatistic |
Longest and shortest wait times, in milliseconds, of connection requests since the last sampling. current value indicates the wait time of the last request that was serviced by the pool |
|
CountStatistic |
Number of logical connections acquired from the pool since the last sampling |
|
CountStatistic |
Number of physical connections that were created by the pool since the last reset |
|
CountStatistic |
Number of physical connections that were destroyed since the last reset |
|
CountStatistic |
Number of connections in the connection pool that failed validation from the start time until the last sampling time |
|
RangeStatistic |
Number of free connections in the pool as of the last sampling |
|
CountStatistic |
Number of connections rejected during matching |
|
CountStatistic |
Number of connections released back to the pool since the last sampling |
|
CountStatistic |
Number of connections successfully matched |
|
CountStatistic |
Number of connections in the pool that timed out between the start time and the last sampling time |
|
RangeStatistic |
Number of connections that are currently being used, as well as information about the maximum number of connections that were used (high watermark) |
|
StringStatistic |
List of the most frequently used SQL queries (Available only when SQL Tracing is enabled) |
|
CountStatistic |
Number of potential connection leaks |
|
CountStatistic |
Number of potential statement leaks (Available only when Statement Leak Detection is enabled) |
|
CountStatistic |
Number of statements that were found in the statement cache (Available only when the Statement Cache is enabled) |
|
CountStatistic |
Number of statements that were not found in the statement cache (Available only when the Statement Cache is enabled) |
|
CountStatistic |
Number of connection requests in the queue waiting to be serviced |
Table 8-27 Application Specific Resource Monitoring Statistics (Connection Pool)
| Statistic | Data Type | Description |
|---|---|---|
|
CountStatistic |
Number of logical connections acquired from the pool since the last sampling |
|
CountStatistic |
Number of connections released back to the pool since the last sampling |
|
RangeStatistic |
Number of connections that are currently being used, as well as information about the maximum number of connections that were used (high watermark) |
Security Statistics
Security fits into the tree of objects as shown in Security Tree Hierarchy.
EJB Security Statistics
Use the following dotted name pattern for EJB security statistics:
server.security.ejb.statisticThe statistics available for EJB security are listed in the following table.
Table 8-28 EJB Security Monitoring Statistics
| Statistic | Data Type | Description |
|---|---|---|
|
CountStatistic |
Number of policy configuration |
|
CountStatistic |
Number of EJB security managers |
Web Security Statistics
Use the following dotted name pattern for web security statistics:
server.security.web.statisticThe statistics available for web security are listed in the following table.
Table 8-29 Web Security Monitoring Statistics
| Statistic | Data Type | Description |
|---|---|---|
|
CountStatistic |
Number of security managers |
|
CountStatistic |
Number of policy configuration objects |
Realm Security Statistics
Use the following dotted name pattern for realm security statistics:
server.security.realm.statisticThe statistics available for realm security are listed in the following table.
| Statistic | Data Type | Description |
|---|---|---|
|
CountStatistic |
Number of realms |
Thread Pool Statistics
The thread pool fits into the tree of objects as shown in Thread Pool Tree Hierarchy.
Thread Pool Monitoring Statistics
Use the following dotted name pattern for thread pool statistics:
server.thread-pool.thread-pool.statisticThe statistics available for the thread pool are shown in the following table.
Table 8-31 Thread Pool Monitoring Statistics
| Statistic | Data Type | Description |
|---|---|---|
|
BoundedRangeStatistic |
Average amount of time (in milliseconds) a request waited in the queue before being processed |
|
BoundedRangeStatistic |
Average amount of 0time (in milliseconds) taken to complete an assignment |
|
CountStatistic |
Number of busy threads |
|
BoundedRangeStatistic |
Current number of request processing threads |
|
CountStatistic |
Number of available threads |
|
BoundedRangeStatistic |
Current number of work items waiting in queue |
|
CountStatistic |
Total number of work items added to the work queue as of last sampling |
JVM Statistics for Java SE-Thread Information
The statistics available for ThreadInfo in the JVM in Java SE are shown in the following table.
Table 8-32 JVM Monitoring Statistics for Java SE - Thread Info
| Statistic | Data Type | Description |
|---|---|---|
|
CountStatistic |
Total number of times that the thread entered the |
|
CountStatistic |
Time elapsed (in milliseconds) since the thread entered the |
|
StringStatistic |
String representation of the monitor lock that the thread is blocked to enter or waiting to be notified through the |
|
CountStatistic |
ID of the thread that holds the monitor lock of an object on which this thread is blocking. |
|
StringStatistic |
Name of the thread that holds the monitor lock of the object this thread is blocking on. |
|
StringStatistic |
Stack trace associated with this thread. |
|
CountStatistic |
ID of the thread. |
|
StringStatistic |
Name of the thread. |
|
StringStatistic |
State of the thread. |
|
CountStatistic |
Elapsed time (in milliseconds) that the thread has been in a |
|
CountStatistic |
Total number of times the thread was in |
Transaction Service Statistics
The transaction service allows the client to freeze the transaction subsystem in order to roll back transactions and determine which transactions are in process at the time of the freeze. The transaction service fits into the tree of objects as shown in Transactions Service Tree Hierarchy.
Use the following dotted name pattern for transaction service statistics:
server.transaction-service.statisticThe statistics available for the transaction service are shown in the following table.
Table 8-33 Transaction Service Monitoring Statistics
| Statistic | Data Type | Description |
|---|---|---|
|
CountStatistic |
Number of transactions currently active. |
|
StringStatistic |
The ID’s of the transactions that are currently active. Every such transaction can be rolled back after freezing the transaction service. |
|
CountStatistic |
Number of transactions that have been committed. |
|
CountStatistic |
Number of transactions that have been rolled back. |
|
StringStatistic |
Indicates whether the transaction has been frozen. |
Web Statistics
The web module fits into the tree of objects as shown in Web Tree Hierarchy.
Web Module Servlet Statistics
Use the following dotted name pattern for web module servlet statistics:
server.applications.web-module.virtual-server.servlet.statistic
server.applications.application.web-module.virtual-server.servlet.statistic
The available web module servlet statistics are shown in the following table.
Table 8-34 Web Module Servlet Statistics
| Statistic | Data Type | Description |
|---|---|---|
|
CountStatistic |
Cumulative number of cases where the response code is greater than or equal to 400. |
|
CountStatistic |
Maximum amount of time the web container waits for requests. |
|
CountStatistic |
Cumulative value of the amount of time required to process each request. The processing time is the average of request processing times divided by the request count. |
|
CountStatistic |
The total number of requests processed so far. |
|
CountStatistic |
Aggregate response time in milliseconds. |
Web JSP Statistics
Use the following dotted name pattern for web JSP statistics:
server.applications.web-module.virtual-server.statistic
server.applications.application.web-module.virtual-server.statistic
The available web JSP statistics are shown in the following table.
Table 8-35 Web JSP Monitoring Statistics
| Statistic | Data Type | Description |
|---|---|---|
|
RangeStatistic |
Number of active JSP pages |
|
CountStatistic |
Total number of errors triggered by JSP page invocations |
|
CountStatistic |
Total number of JSP pages that were reloaded |
|
CountStatistic |
Total number of JSP pages ever loaded |
Web Request Statistics
Use the following dotted name pattern for web request statistics:
server.applications.web-module.virtual-server.statistic
server.applications.application.web-module.virtual-server.statistic
The available web request statistics are shown in the following table.
Table 8-36 Web Request Monitoring Statistics
| Statistic | Data Type | Description |
|---|---|---|
|
CountStatistic |
Cumulative value of the error count, with error count representing the number of cases where the response code was greater than or equal to 400 |
|
CountStatistic |
Longest response time for a request; not a cumulative value, but the largest response time from among the response times |
|
CountStatistic |
Average request processing time, in milliseconds |
|
CountStatistic |
Cumulative number of the requests processed so far |
Web Servlet Statistics
Use the following dotted name pattern for web servlet statistics:
server.applications.web-module.virtual-server.statistic
server.applications.application.web-module.virtual-server.statistic
The available web servlet statistics are shown in the following table.
Table 8-37 Web Servlet Monitoring Statistics
| Statistic | Data Type | Description |
|---|---|---|
|
RangeStatistic |
Number of currently loaded servlets |
|
CountStatistic |
Cumulative servlet processing times , in milliseconds |
|
CountStatistic |
Cumulative number of servlets that have been loaded into the web module |
Web Session Statistics
Use the following dotted name pattern for web session statistics:
server.applications.web-module.virtual-server.statistic
server.applications.application.web-module.virtual-server.statistic
The available web session statistics are shown in the following table.
Table 8-38 Web Session Monitoring Statistics
| Statistic | Data Type | Description |
|---|---|---|
|
CountStatistic |
Total number of activated sessions |
|
RangeStatistic |
Number of currently active sessions |
|
CountStatistic |
Maximum number of concurrently active sessions |
|
CountStatistic |
Total number of expired sessions |
|
CountStatistic |
Total number of passivated sessions |
|
CountStatistic |
Total number of persisted sessions |
|
CountStatistic |
Total number of rejected sessions |
|
CountStatistic |
Total number of sessions created |
Configuring JConsole to View Payara Server Monitoring Data
Java SE provides tools to connect to an MBean Server and view the MBeans registered with the server. JConsole is one such popular JMX Connector Client and is available as part of the standard Java SE distribution.When you configure JConsole for use with Payara Server, Payara Server becomes the JMX Connector’s server end and JConsole becomes the JMX connector’s client end.
To Connect JConsole to Payara Server
Java SE 6 enhances management and monitoring of the virtual machine by including a Platform MBean Server and by including managed beans (MBeans) to configure the virtual machine.
To view all MBeans, Payara Server provides a configuration of the standard JMX connector server called System JMX Connector Server. As part of Payara Server startup, an instance of this JMX Connector Server is started. Any compliant JMX connector client can connect to the server using the JMX Connector Server.
By default, Payara Server is configured with a non-secure System JMX Connector Server. If this is an issue, the JMX connector can be removed. However, access can be restricted to a specific IP address (for example, the loopback address) by setting address to locahost.
-
Start the domain. For instructions, see To Start a Domain.
-
Start JConsole using this format: JDK_HOME`/bin/jconsole`. For example:
/usr/java/bin/jconsoleThe JConsole Connect to Agent window is displayed.
-
Click the Remote tab and type the host name and port.
Always connect remotely with JConsole, otherwise MBeans will not load automatically. -
Click Connect.
-
In the Remote Process text box, specify the JMX Service URL.
For example:
service:jmx:rmi:///jndi/rmi://localhost:8686/jmxrmi
The JMX Service URL is emitted by the server at startup, looking
something like this:
[#|2009-12-03T10:25:17.737-0800|INFO|glassfishv3.0|
x..system.tools.admin.org.glassfish.server|_ThreadID=20;
_ThreadName=Thread-26;|JMXStartupService: Started JMXConnector, JMXService
URL = service:jmx:rmi://localhost:8686/jndi/rmi://localhost:8686/jmxrmi|#]
However, in most cases, simply entering host:port is fine, such as, 192.168.1.150:8686. The long Service URL is not needed.
Another host name can be substituted for localhost. The default port number (8686) could change if the jmx-connector configuration has been modified.
|
-
Click Connect.
In the JConsole window you will see all your MBeans, JVM information, and so on, in various tabs. Most of the useful MBeans are to be found in theamxandjava.langdomains.
For more information about JConsole, see http://docs.oracle.com/javase/8/docs/technotes/guides/management/jconsole.html.
JMX Monitoring
Payara Server offers a customized JMX Monitoring Service. Once configured, Payara Server will monitor and log the values of all MBean attributes that have been added for explicit monitoring.
The metrics are logged together in a single log message as a series of key-value pairs prefixed by the string JMX-MONITORING:.
|
The default JMX listener is unauthenticated and open for local access. In an unsecure environment, open JMX ports should be disabled to prevent unwanted access. |
To see a non-exhaustive inventory of existing MBeans that are currently available for Payara Server, see here.
Enabling JMX Monitoring
|
Payara Server uses the AMX API for working with JMX MBeans. AMX is not fully exposed by default and as such needs to be loaded to access most JMX MBean objects. The JMX Monitoring Service can be used without AMX but there is a limit to what can be monitored without it. |
Boot AMX
To boot AMX at startup or independently of the JMX Monitoring service, run the command below:
asadmin set-amx-enabled --enabled true --dynamic true --target server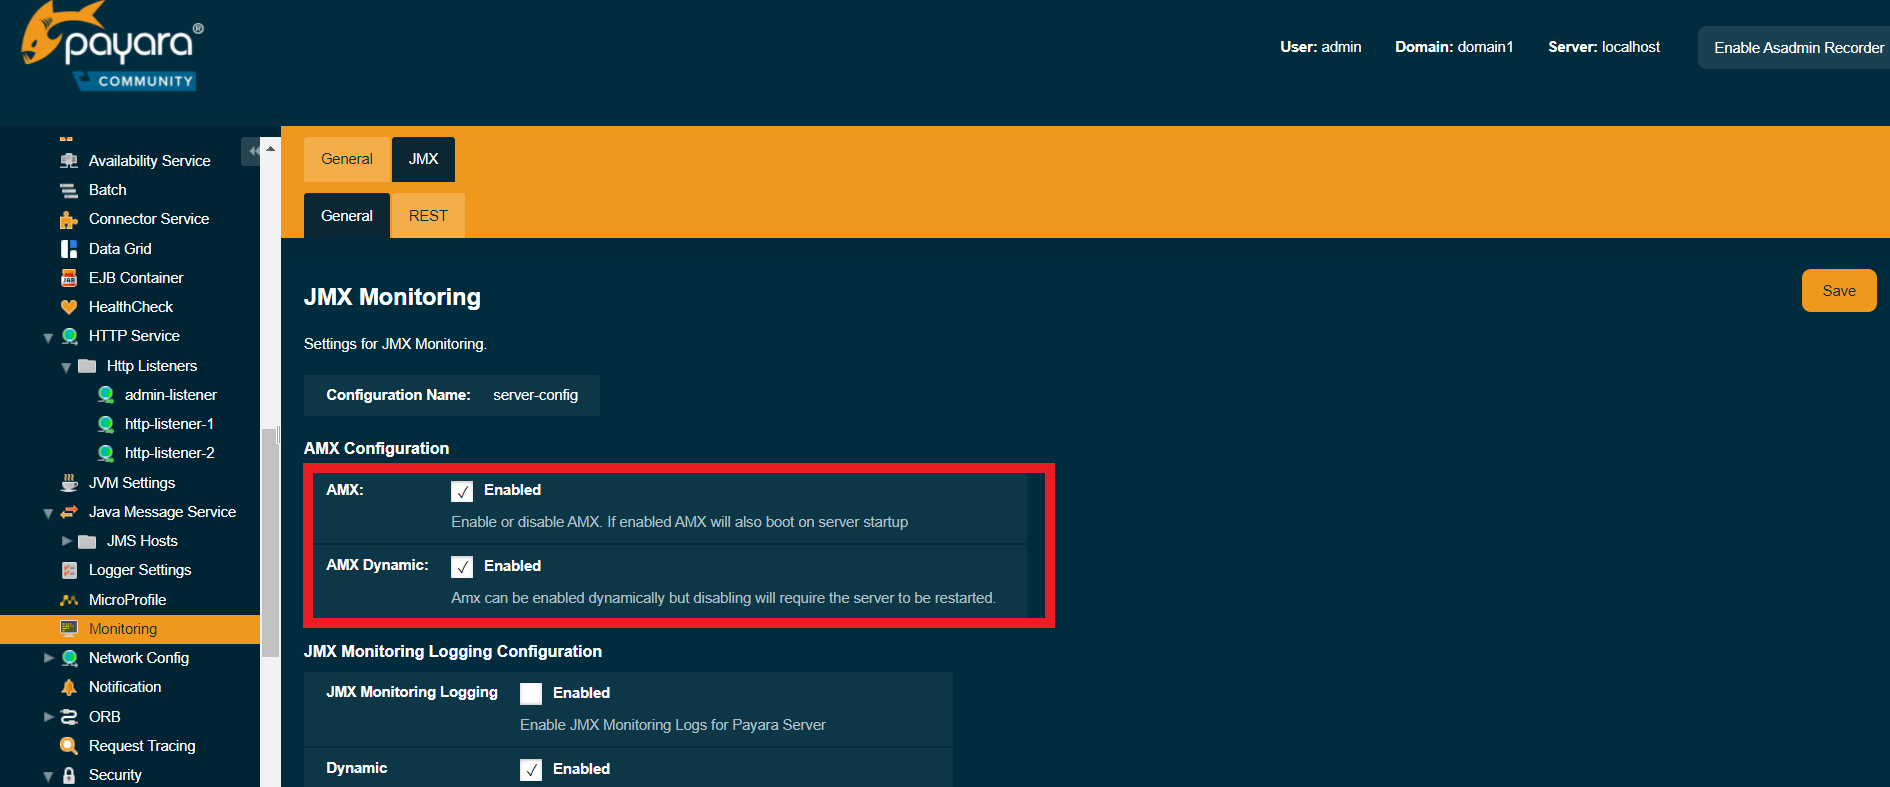
Configure JMX Monitoring
You can enable JMX Monitoring using the set-jmx-monitoring-configuration asadmin command
JMX Monitoring can either be enabled for next startup or the service can be dynamically enabled on a running instance of Payara Server (provided a non-empty configuration exists at server startup).
To enable the service dynamically on the default server instance run the following command:
asadmin> set-jmx-monitoring-configuration --dynamic true --enabled trueSetting The JMX Monitoring Configuration
You can configure JMX Monitoring using the set-jmx-monitoring-configuration asadmin command.
Adding a monitoring attribute
To add the HeapMemoryUsage attribute to the list of MBean attributes to monitor using the service the following command can be used:
asadmin set-jmx-monitoring-configuration --addattribute 'attributeName=HeapMemoryUsage objectName=java.lang:type=Memory' --enabled falseBreaking this command down, two arguments have been used:
-
--addattribute -
--enabled
Passing --addattribute to set-jmx-monitoring-configuration provides a way to add a new MBean attribute to monitor using the service. This argument takes in a string of space-delimited key-value pairs corresponding to the values listed earlier.
The attributeName and objectName fields are required, but description is not. Providing attributeName=HeapMemoryUsage denotes that the name of the MBean attribute to log is HeapMemoryUsage, while objectName=java.lang:type=Memory denotes the ObjectName of the MBean to look for the attribute on is java.lang:type=Memory.
The second argument, --enabled, is the only required option for the asadmin command. The only valid values to give this option are true or false. Passing false to the option will disable the logging service on next startup if it is currently enabled, but will otherwise do nothing.
Under this scenario the monitoring service has not been configured yet so false was passed.
Dealing with composite MBean attributes
The MBean attribute added, HeapMemoryUsage, is a composite attribute.
It has metrics for the commited, init, max and used attributes. The monitoring service will by default monitor each metric and log it as {$metric}{$attribute_name}:{$attribute_value}.
If this is not the desired result, it is possible to monitor a single metric for a composite MBean attribute.
To monitor a single metric for the attribute the value of attributeName passed to the --addattribute option should be modified like so:
attributeName=HeapMemoryUsage.metricSo to log only the used heap memory the asadmin command would be:
asadmin set-jmx-monitoring-configuration --addattribute 'attributeName=HeapMemoryUsage.used objectName=java.lang:type=Memory' --enabled falseSetting Logging frequency
There are two configuration attributes related to the frequency at which log messages are written: logfrequency and logfrequencyunit. The first is a numerical value used for the rate, while the second is the unit for the rate. The default configuration is set to have a message logged every 15 seconds.
If the value of logfrequencyunit is the default of SECONDS then to have the monitoring service log messages every one minute execute the following command:
asadmin set-jmx-monitoring-configuration --logfrequency 60 --enabled falseRest Monitoring
This section covers how to use the REST monitoring functionality in Payara Server. The REST monitoring is implemented through an internal application that functions similarly to Jolokia, as it exposes MBeans over HTTP with a REST API to stop JMX monitoring requiring RMI.
The REST monitoring is hosted on the admin-listener (port 4848) on the default context root, /rest-monitoring.
Configuring REST monitoring
REST monitoring is configurable through several Asadmin CLI commands.
The set-rest-monitoring-configuration asadmin command is used to configure REST monitoring. This command requires the server to be running. Each configuration property can be configured individually or all together.
To enable REST monitoring, run the command like this:
asadmin set-rest-monitoring-configuration --enabled trueGetting REST monitoring Configuration
asadmin> get-rest-monitoring-configurationThe get-rest-monitoring-configuration asadmin command is used to get the configuration of the REST monitoring. This command requires the server to be running.
If no target is specified, the command will get the REST monitoring configuration from the domain configuration (server-config). The --target option retrieves the REST monitoring from another instance or cluster.
Here’s an example of how to use the command:
asadmin> get-rest-monitoring-configuration --target server-config

Enabled    Rest Monitoring Application Name    Context Root       Security Enabled
true       __restmonitoring                    /rest-monitoring   false
Rest Monitoring Security
| To enable security for the REST Monitoring application, you’ll have to enable secure administration first. |
asadmin set-rest-monitoring-configuration --securityEnabled=trueThe securityEnabled property defines whether the REST monitoring application is available over HTTPS. Since the REST monitoring application is hosted on the admin-listener.
Enabling secure admin can be done by first configuring the admin password with the change-admin-password command, then using the enable-secure-admin command.
| Remember that enabling secure admin requires a server restart. |
When securityenabled is set to true, a username and password is required to use REST monitoring.
The default username is set to payara and the default password is set to rest. The user payara is defined in the file realm.
|
The password can be changed with the following command:
asadmin update-file-user --groups=rest --target=server-config --authrealmname=file payaraThis updates the payara user, which is part of the rest group. Any users who are able to log in to the REST monitoring must also be defined in the file realm and be part of the rest group.
New users can be created by using the following command:
asadmin create-file-user --groups=rest --target=server-config --authRealmName=file <username>Performing READ Operations
REST Monitoring supports a subset of operations in the Jolokia API.
The read operation reads the details of the requested MBean. The read operation accepts GET requests on URLs in the following format:
<REST_API_URL>/read/${mbean-name}/${attribute-name}A list of attribute names can be found in the request of an empty attribute name under value.
Example Execution
To read the MBean java.lang:type=Memory using the default configuration, you would make a GET request to: http://localhost:4848/rest-monitoring/rest/read/java.lang:type=Memory.
Example Output
{
  "request": {
    "mbean": "java.lang:type=Memory",
    "type": "read"
  },
  "value": {
    "HeapMemoryUsage": {
      "committed": 450363392,
      "init": 264241152,
      "max": 477626368,
      "used": 97480984
    },
    "ObjectPendingFinalizationCount": 0,
    "NonHeapMemoryUsage": {
      "committed": 139460608,
      "init": 2555904,
      "max": -1,
      "used": 122389432
    },
    "Verbose": false,
    "ObjectName": "java.lang:type=Memory"
  },
  "timestamp": 1502799650273,
  "status": 200
}
Performing Bulk READ Operations
It is possible to execute bulk operations using the REST monitoring API. To do this, issue a POST request to the REST API URL with the following JSON structure as the body payload.
The payload is a JSON array consisting of objects of type, MBean, and attribute JSON objects. You may send a single operation request instead of an array also.
[
  {
    "type" : "<OPERATION_TYPE>",
    "mbean" : "<MBEAN_NAME>",
    "attribute" : "<ATTRIBUTE_NAME>"
  },
  {
    "type" : "<OPERATION_TYPE>",
    "mbean" : "<MBEAN_NAME>",
    "attribute" : "<ATTRIBUTE_NAME>"
  }
]-
type - The ‘type’ of operation to execute, e.g. read, search, write, etc.
-
mbean - The MBean attribute which the operation will be executed on.
-
attribute - The MBean attribute upon which the operation will be executed. If omitted, all attributes of the MBean will be involved in the operation.
Example Execution
Using curl and a sample REST API URL of http://localhost:4848/rest-monitoring/rest
curl -X POST http://localhost:4848/rest-monitoring/rest/ \
  -H 'Content-Type: application/json' \
  -d '[
	{
		"mbean": "java.lang:type=Compilation",
		"type": "read"
	},{
		"mbean": "java.lang:type=Runtime",
		"attribute" : "Uptime",
		"type": "read"
	}
]'
Example Output
[
    {
        "request": {
            "mbean": "java.lang:type=Compilation",
            "type": "read"
        },
        "value": {
            "Name": "HotSpot 64-Bit Tiered Compilers",
            "CompilationTimeMonitoringSupported": true,
            "TotalCompilationTime": 106363,
            "ObjectName": "java.lang:type=Compilation"
        },
        "timestamp": 1529353755633,
        "status": 200
    },
    {
        "request": {
            "mbean": "java.lang:type=Runtime",
            "attribute": "Uptime",
            "type": "read"
        },
        "value": 8541422,
        "timestamp": 1529353755636,
        "status": 200
    }
]