After downloading the latest version of Payara Server and starting it up, there will be JMX data available immediately, but this is data will only include generic statistics from the JVM itself and will not include any metrics from Payara Server. To view Payara Server metrics, there are a few extra steps to complete first.
Since we need to show the MBeans available, we will use VisualVM for this
guide. This is available in the Oracle JDK as jvisualvm, or as a separate
download from visualvm.github.io.
To view MBeans, the MBeans Browser plugin
will need to be installed.
With Payara Server started, VisualVM will detect the running Payara Server as an instance of GlassFish (provided both Payara Server and VisualVM are started as the same user):
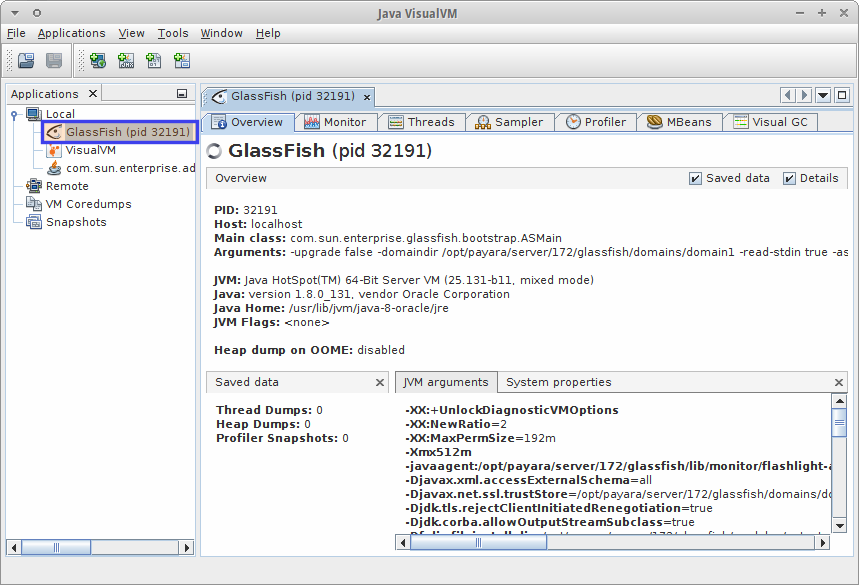
This automatic detection of Payara Server uses jstatd to connect to the
target JVM. MBeans are still accessible here, but this is not using JMX. A later
guide will cover the details of connecting via a JMX port.
|
Boot AMX
JMX MBeans in Payara Server are exposed under amx to differentiate them from
other JVM MBeans, such as those under java.lang which expose things like
garbage collection information.
To view the MBeans from Payara Server as well as the JVM, we must execute a JMX operation to start the AMX subsystem.
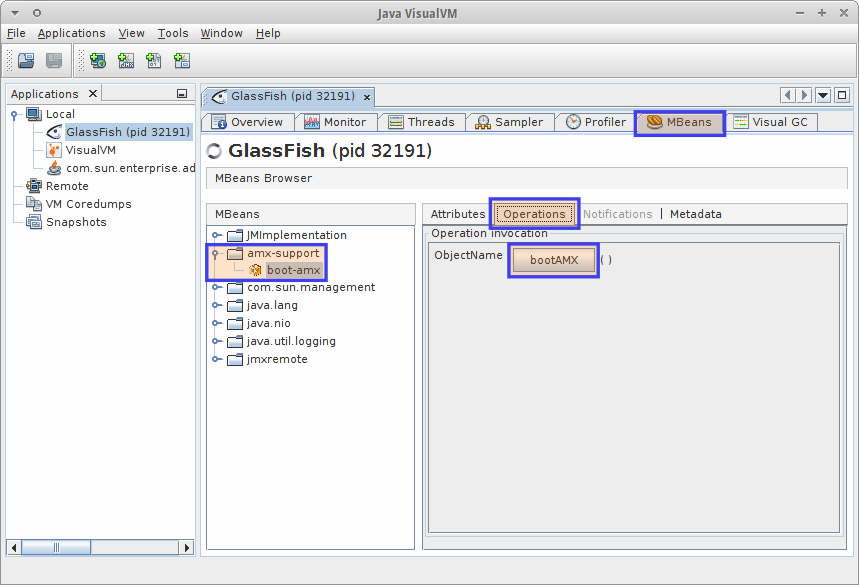
As shown in the image below, expand the amx-support folder and select the
boot-amx MBean. The default selected tab will be Attributes, so select the
Operations tab and click the bootAMX button.
After the operation returns, VisualVM will display an alert box (click OK to
dismiss). You will also notice a new directory next to amx-support, simply
titled amx.
Expanding this directory will show a very large list of subfolders with useful-looking names. A closer look at these will show that the information in each of the MBeans is only configuration information, not metrics. This is because we haven’t enabled Payara Server’s monitoring system, so no metrics are being gathered. This is our next step.
Enable Monitoring in Payara Server
To make sure that we get all the monitoring data that Payara Server provides,
we will turn each module’s monitoring level to HIGH, giving us the highest
possible amount of data.
Via the Admin Console
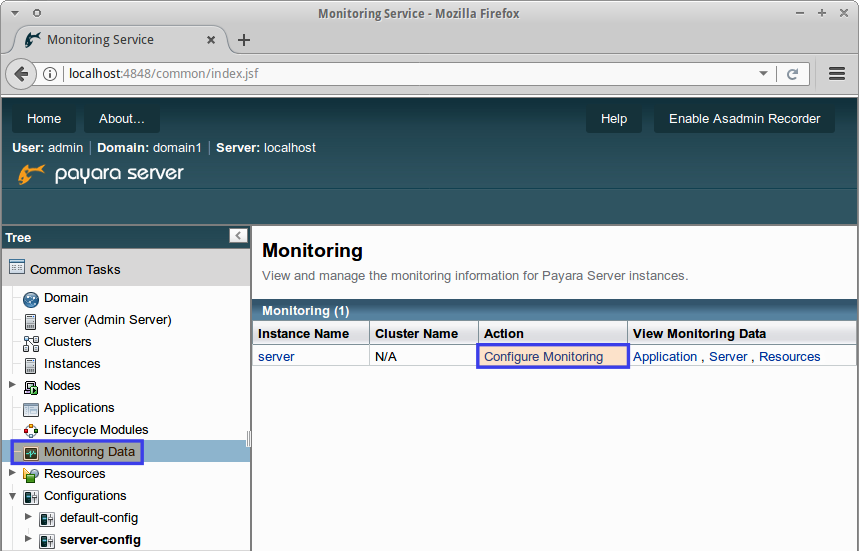
Open the Admin Console and select "Monitoring Data" in the left-hand "Tree" pane. This is where monitoring data can be viewed in the admin console, though this will be raw data. Since we have not yet enabled monitoring, click the "Configure Monitoring" link for the relevant server instance. In the image below we only have the DAS (“server”) to choose:
That link will take you directly to the correct page for the server-config -
the place where we enable monitoring for the DAS as shown:
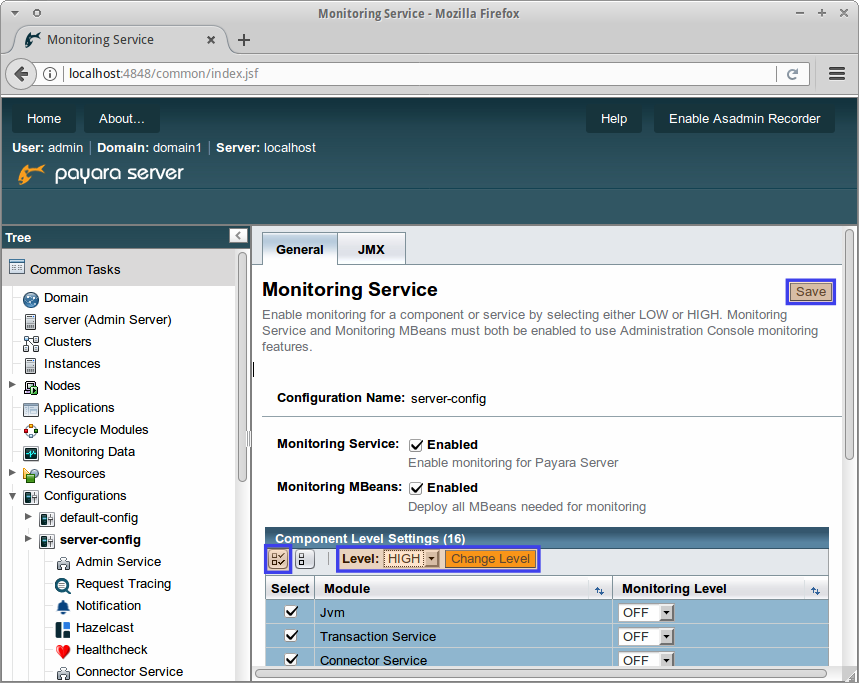
Use the icon to select all available modules, change the value for the "Level"
dropdown to HIGH and click "Change Level". This has not yet saved the changes,
so we must make sure to click the "Save" button in the top left corner to make
sure that the change is applied.
Via the Asadmin Set Command
To achieve the same goal using the asadmin tool, we must use the set command
and the appropriate dotted name for each of the modules. Below is a list of
all the commands needed to set every module shown above to HIGH individually.
set configs.config.server-config.monitoring-service.module-monitoring-levels.jvm=HIGH
set configs.config.server-config.monitoring-service.module-monitoring-levels.connector-service=HIGH
set configs.config.server-config.monitoring-service.module-monitoring-levels.connector-connection-pool=HIGH
set configs.config.server-config.monitoring-service.module-monitoring-levels.jdbc-connection-pool=HIGH
set configs.config.server-config.monitoring-service.module-monitoring-levels.web-services-container=HIGH
set configs.config.server-config.monitoring-service.module-monitoring-levels.ejb-container=HIGH
set configs.config.server-config.monitoring-service.module-monitoring-levels.thread-pool=HIGH
set configs.config.server-config.monitoring-service.module-monitoring-levels.http-service=HIGH
set configs.config.server-config.monitoring-service.module-monitoring-levels.security=HIGH
set configs.config.server-config.monitoring-service.module-monitoring-levels.jms-service=HIGH
set configs.config.server-config.monitoring-service.module-monitoring-levels.jersey=HIGH
set configs.config.server-config.monitoring-service.module-monitoring-levels.transaction-service=HIGH
set configs.config.server-config.monitoring-service.module-monitoring-levels.jpa=HIGH
set configs.config.server-config.monitoring-service.module-monitoring-levels.web-container=HIGH
set configs.config.server-config.monitoring-service.module-monitoring-levels.orb=HIGH
set configs.config.server-config.monitoring-service.module-monitoring-levels.deployment=HIGH
Viewing JMX Monitoring Data with VisualVM
No further action needs to be taken to get the data from Payara Server into
VisualVM. If the MBeans Browser was already open before enabling monitoring,
the new MBeans will have appeared already. They may be hard to spot, but they
are easy to identify; all MBeans which show monitoring data are suffixed with
"-mon". A good example is web-request-mon, which will show metrics on requests
for each module in the available Virtual Servers:
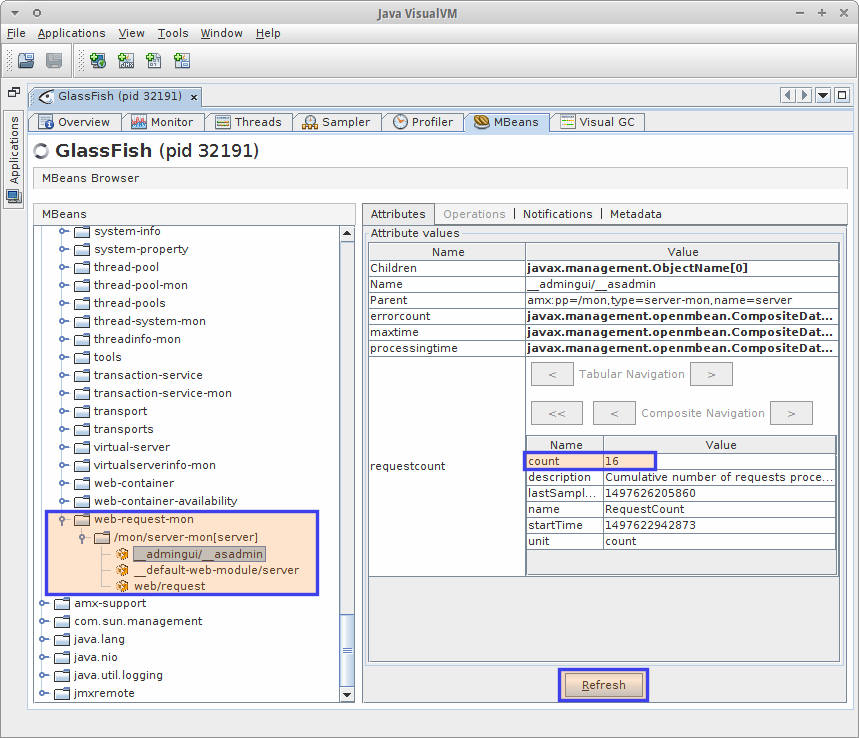
In the screenshot, the Admin Console module is selected and the requestcount
attribute is selected. Each attribute in bold is a composite attribute,
meaning that it is an attribute which has several properties. Double-clicking
the bold text in VisualVM will expand the attribute to show the available data
as seen above. Visiting a page in the admin console will increment the count
value in the requestcount attribute, though the Refresh button will need to
be clicked to update the value.
Remotely Viewing JMX Monitoring Data with VisualVM
To remotely get the data from secured Payara Server into VisualVM, you have
to use the SSL connection (which is the default). For an SSL connection to
work, you need to use the same SSL certificate as used in a remote Payara Server.
This certificate is not available in standard JDK, so you’ll need to add the
file Keystore.jks in the domain directory (it is under ${DOMAIN_HOME}/config/)
to VisualVM. This is required since the SSL connection will provide the
certificate for authentication.
VisualVM doesn’t accept any certificates by default so you will have to configure it manually. Once you have the Keystore of a running domain, run VisualVM using the following command:
visualvm -J-Djavax.net.ssl.trustStore=${PATH_TO_KEYSTORE}/keystore.jks -J-Djavax.net.ssl.trustStorePassword=changeitThis will allow VisualVM to trust the provided SSL certificate. The
default password for the Payara keystores is changeit.