The monitoring console module collects a multitude of metrics from all nodes and accumulates the data on the DAS. This can include user defined metrics. The data is visualised by the monitoring console web-application that for the time being is installed on the DAS explicitly like any normal web-application.
| Please be aware that following details reflect the current state of a evolving product that are likely to change in the future. |
Installation
To run the application deploy the monitoring-console-webapp.war on the DAS. The war is contained in the monitoring-console folder of the release archive.
Installing the application on other instances will not show any data.
| The monitoring console feature is only contained in Payara Server distribution. |
Graphical User Interface
After installing the monitoring-console-webapp.war open the home page at the application root you have chosen, for example /monitoring-console-webapp/.
The console comes with a set of preconfigured pages each focussing on a different aspects of the server.
The console will let you know that some metrics are only available when the monitoring configuration of certain server parts is set to HIGH.
|
Pages
The monitoring console is organized in fully customisable pages. A page is a collection of widgets arranged in columns. Usually pages are focussed on visualising metrics of a specific area of the server, like HTTP or request tracing. The monitoring console has preconfigured pages as a starting point that can be changed and extended by the user.

Changing Page Layout
Each page uses a column layout of 1-4 columns. The number of columns for a page can be changed using ⬚ to ⬚⬚⬚⬚ buttons at the top right of the page.

Changing the column layout of a page does not change the preferred position of the widgets. If a widget is set to column 3 but a 2-column layout is used all widgets of the 3rd or 4th column get pushed to the 2nd column instead. This allows switching layouts without redoing the configuration entirely. This feature can also be used to quickly "zoom" into the metrics most left on the page by switching to 1 or 2 column layout.
Changing Page Update Interval
By default the graphs on a page update every 2 seconds. To control the interval use the set of buttons left to the column configuration.

The interval can paused ⏸, continued ▶, made slower (turtle) or faster (rabbit). To reset the interval to standard of 2 seconds also use the ▶ button.
Adding Pages
To add a new page click the plus icon + in the top left next to the Payara Logo.

With a new Unnamed page created the page is renamed in the Page options. After naming the page widgets can be added.
Deleting a Page
To delete a page click on the x in the top right corner (closed options) and confirm the browser dialogue.

| Once a page is deleted it cannot be restored or reset. It can only be restored by importing a complete configuration. |
Reset a Page
When the configuration of a preconfigured page or any of the widgets on it was changed by the user the page can be reset by clicking the ⟲ button in the top right icon toolbar.

| The reset will affect all widgets and the general page setup of the currently shown page. All changes made by the user will be overridden. |
To reset all pages to only the resets the local storage of the browser for the page needs to be cleared. With no configuration in local browser storage the config is reset to the preconfigured pages again.
Export Configuration
A configuration contains all pages. Any changes made to a page or widget setup are contained in this configuration. By clicking the export button in the top right icon toolbar the configuration is downloaded as JSON file.
Import Configuration
To import a previously exported JSON file click the import button in the top right icon toolbar any select the JSON file to import. This feature can be used to version and distribute configurations for similar installations.
| Improting files will override any changes made to any page included in the file. |
Widgets
Widgets are the components that can be placed on a page to show a particular metric. While there are different types of widgets usually a widget shows a line graph of one or more metrics.
Configuring a Widget
To configure a widget select it by clicking on its title as shown below.
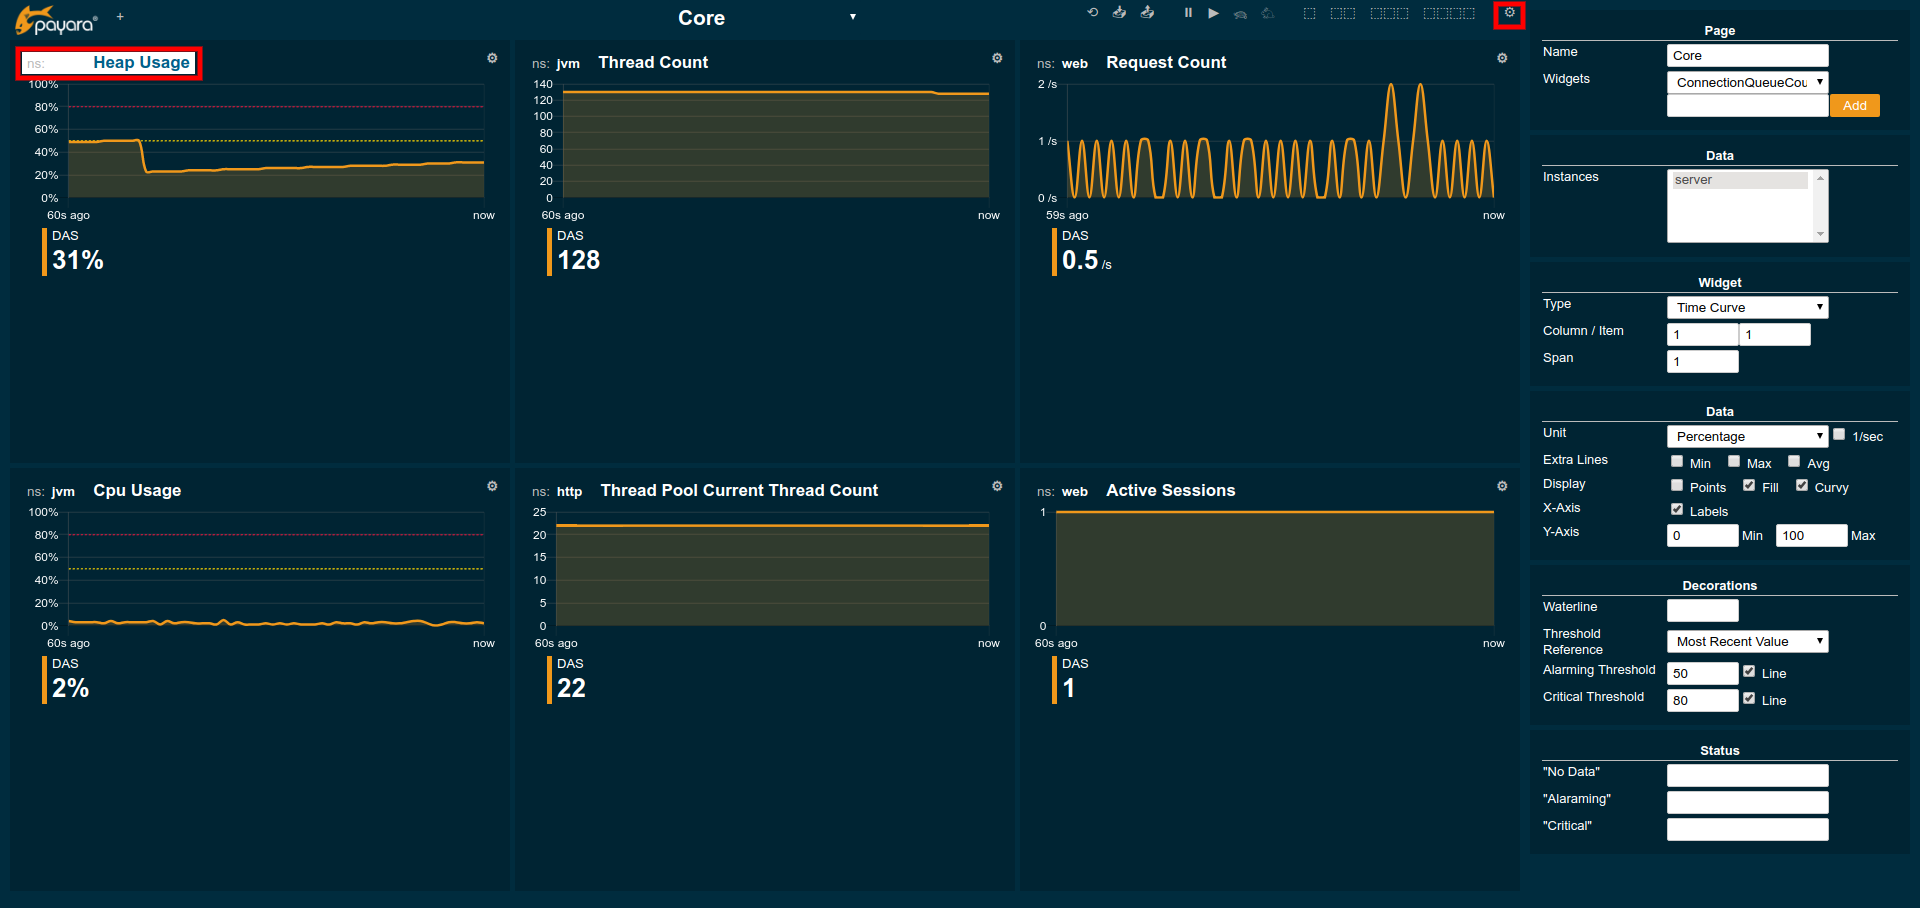
This opens the side panel and shows the detail configuration of the widget. Deselect the widget by clicking on its title again or click on cogs symbol to close the side panel.
| Note that while mutli-select is supported many widget options only show when only one widget is selected. |
The Widget settings are concerned with the widgets position within the page.
| Property | Default | Description |
|---|---|---|
Type |
|
Changes the type of the graph used to show the metric. This also affects which data of the metric the widget is focussed on. |
Column |
1 |
The column in the layout the widget prefers to be in. |
Item |
1 |
Within columns widgets are sorted by their item value, lowest values first. |
Span |
1 |
How many columns and rows the widget should span. |
The Data settings are concerned with what and how the data is shown in the graph of a widget.
| Property | Default | Description |
|---|---|---|
Unit |
|
The unit controls how the raw number of a metric is interpreted and represented e.g. when displaying in axis labels. The unit also controls what values are accepted as input for numbers, like thresholds, that are on the same axis. Possible units are: |
Unit 1/sec |
|
Whether or not to show the metric as change per second (delta between two points in the series normalised to average delta per second). |
Extra Lines |
(none) |
Check to add the all time minimum, maximum or avager line to the graph |
Display |
Fill, Curvy |
Options on how to display the current value line in the graph: With Points marked, with Fill under the area between line and axis and whether or not to use curves to draw the line. |
X-Axis |
Labels |
Whether or not to show labels for the x-axis. |
Y-Axis |
(undefined) |
Set a minimum or maximum number for the y-axis instead. When not set range is derived automatically from the data points. |
Configuring Widget Decorations
Decorations are visual helper that can be added to a graph of a widget in order to make it easier to for the user to understand the data displayed. In particular these are reference lines.
| Property | Default | Description |
|---|---|---|
Waterline |
(undefined) |
Adds a simple reference line that could mark a upper or lower limit. Enter in unit of y-axis, e.g. 20ms, 5s, 2GB, 4%, 123 |
Threshold Reference |
|
Controls what value the Alarming Threshold and Critical Threshold are compared to. Usually this is the most recent value but in some cases the all time minimum, maximum or average are useful too. |
Alarming Threshold |
(undefined) |
The limit for the "Alarming" state. When no Critical Threshold is defined or if it is larger than this value the threshold is exceeded if the reference value is larger than the threshold. Otherwise if it is lower. When exceeded the status becomes "Alaraming". Enter in unit of y-axis, e.g. 20ms, 5s, 2GB, 4%, 123 |
Critical Threshold |
(undefined) |
The limit of the "Critical" state. When no Alarmin Threshold is defined or if it is smaller than this value the threshold is exceeded if the reference value is larger then the threshold. Otherwise if it is lower. When exceeded the status becomes "Critical", overrides staus "Alarming". Enter in unit of y-axis, e.g. 20ms, 5s, 2GB, 4%, 123 |
Besides adding a reference line to the graph the critical and alraming thresholds affect the status evaluation.
Configuring Widget Status Messages
The current value of a metric can automatically be categorised as a certain status. For example based on the threshold values of decorations or by encountered errors or missing data. The Status settings allows to set a custom message for a particular status.
| Property | Default | Description |
|---|---|---|
"No Data" |
(undefined) |
The message to show when no data for a metric is available. For example to hint about configurations needed to make the metric available. |
"Alarming" |
(undefined) |
The message to show when the threshold got exceeded and the status evaluates to Alarming. |
"Critical" |
(undefined) |
The message to show when the threshold got exceeded and the status evaluates to Critical. |
The messages support simple markup using *bold* and _italic_.
Adding Widgets
Widgets can be added to any page. Open the side panel by clicking on the cog symbol in the top right. Use the dropdown in the Widget property of the Page settings to select a metric or enter the metric directly in the text field below and press the add button.

Currently new widget are always added to the first column. Use the side panel widget settings to change column, span or item position of the widget or use the quick menu for the widget by clicking the cog symbol in the top right corner of the widget.

Preconfigured Pages
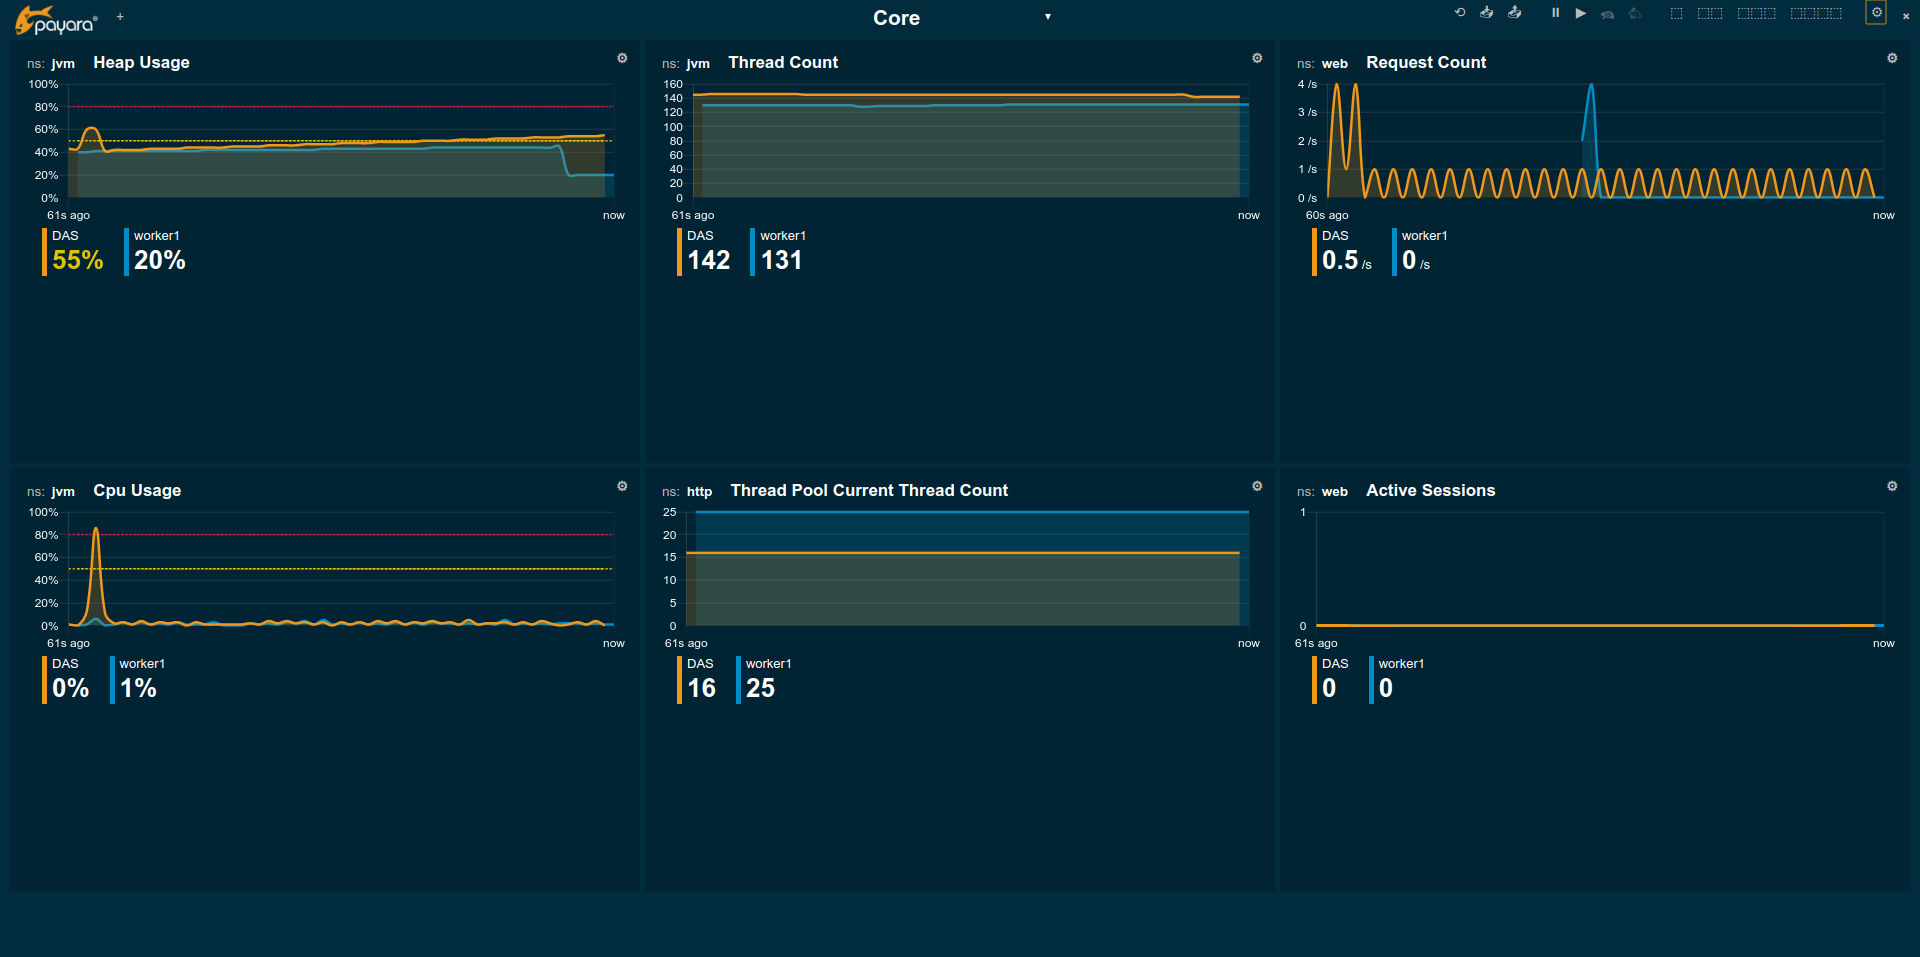
Core
The Core page gives an overview over some of the important instance metrics. Each instance in the grid is shown separately.
-
Heap Usage: Percentage of the current instance maximum heap memory already used.
-
CPU Usage: Percentage CPU usage by the instance (not the machine but the process).
-
Thread Count: Total number of threads used by the instance.
-
Thread Pool Current Thread Count: Total number of threads in the HTTP thread pool used by the instance.
-
Request Count: Number of HTTP request per second processed by the instance.
-
Active Sessions: Total number of active session for the instance.
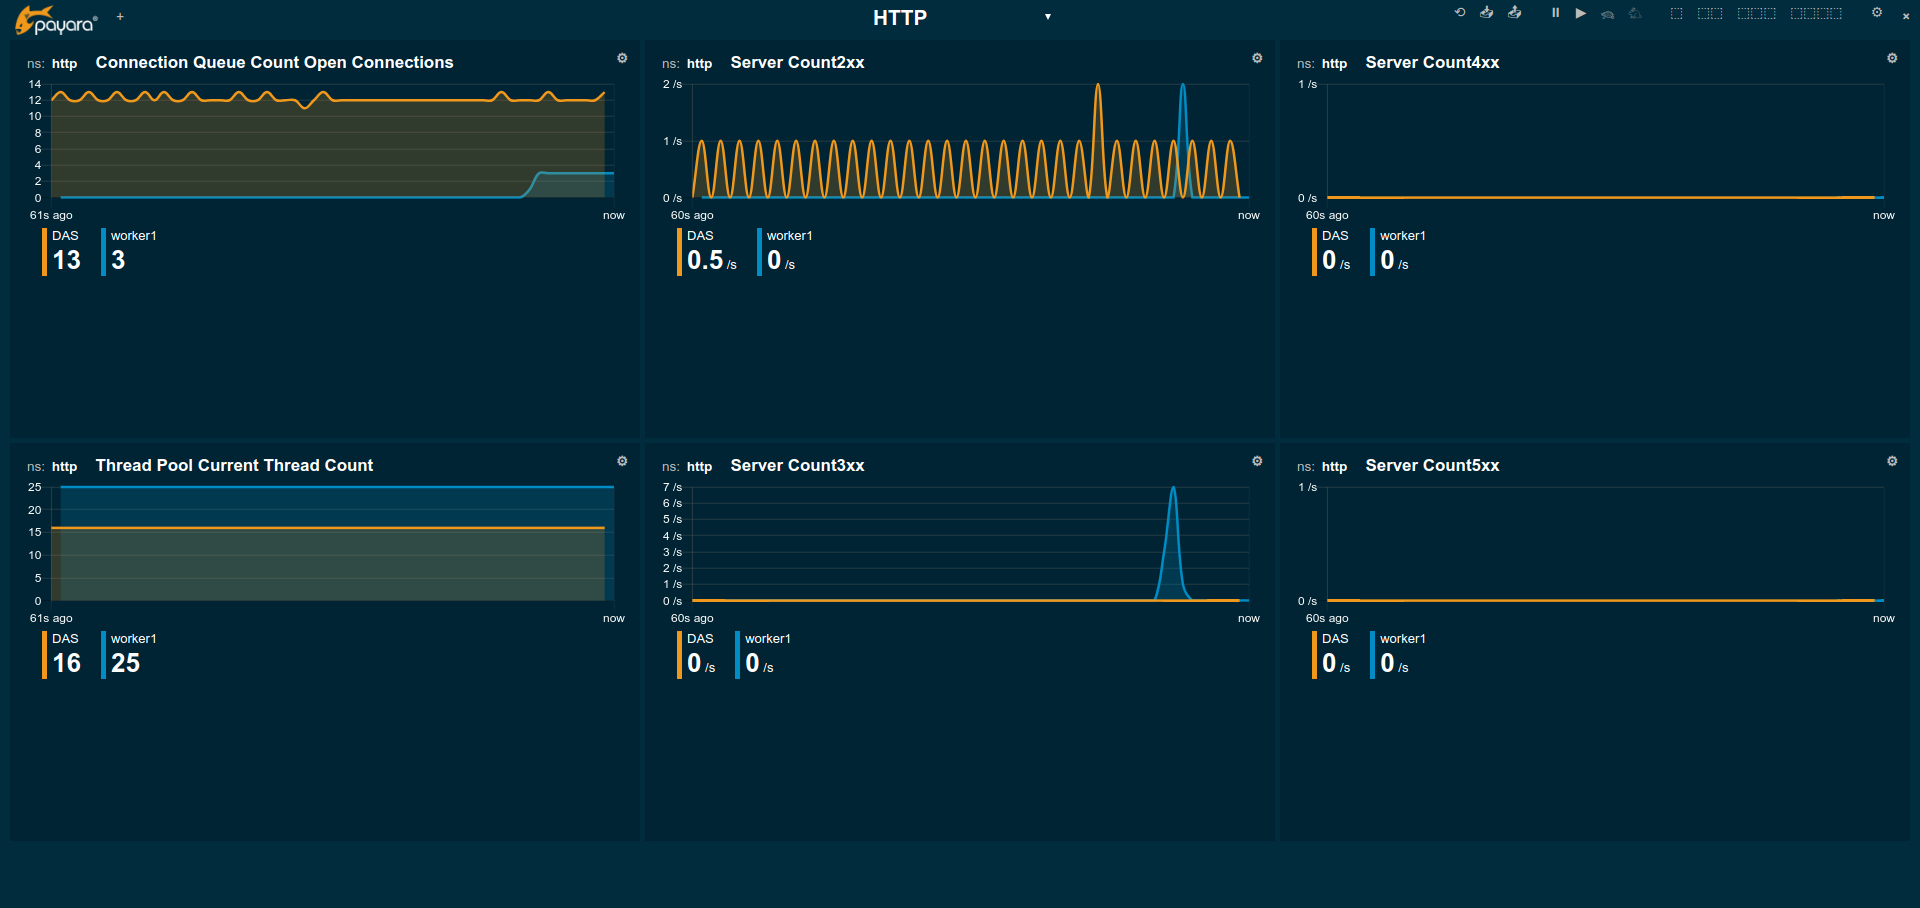
HTTP
The HTTP page gives a rough overview over the state of the HTTP services of each instance.
-
Connection Queue Count Open Connections: Total number of open connection in the connection queue
-
Thread Pool Current Thread Count: Total number of currently used threads of the HTTP thread pool
-
Server Count2xx: Requests per seconds and instance responding with Success.
-
Server Count3xx: Requests per seconds and instance responding with Redirection.
-
Server Count4xx: Requests per seconds and instance responding with Client Error.
-
Server Count5xx: Requests per seconds and instance responding with Server Error.
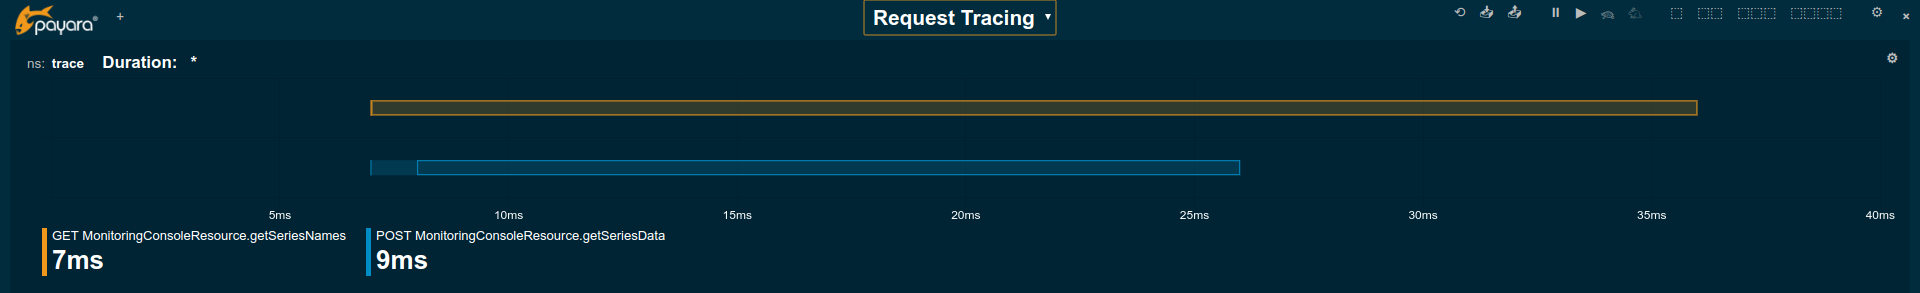
Request Tracing
The Request Tracing page overview page shows traces that exceeded the set threshold.
| If this page does not show any data, no request have exceeded the threshold or the request tracing has not been enabled altogether. |
All traces for the same method are shown as a single bar. The length and position of the bar gives the range of total trace duration. The bar starts at the minimum duration observed and ends at the maximum duration observed in the last minute. The legend shows the average duration and the method traced (innermost trace span operation)
When all time minimum and/or maximum are added the bar starts and/or ends at these values.
By clicking on one of the bars in the overview the details of all traces for this method can be viewed. This data corresponds to the traces stored in the trace-store. For each trace each of the spans corresponds to a bar in this graph.
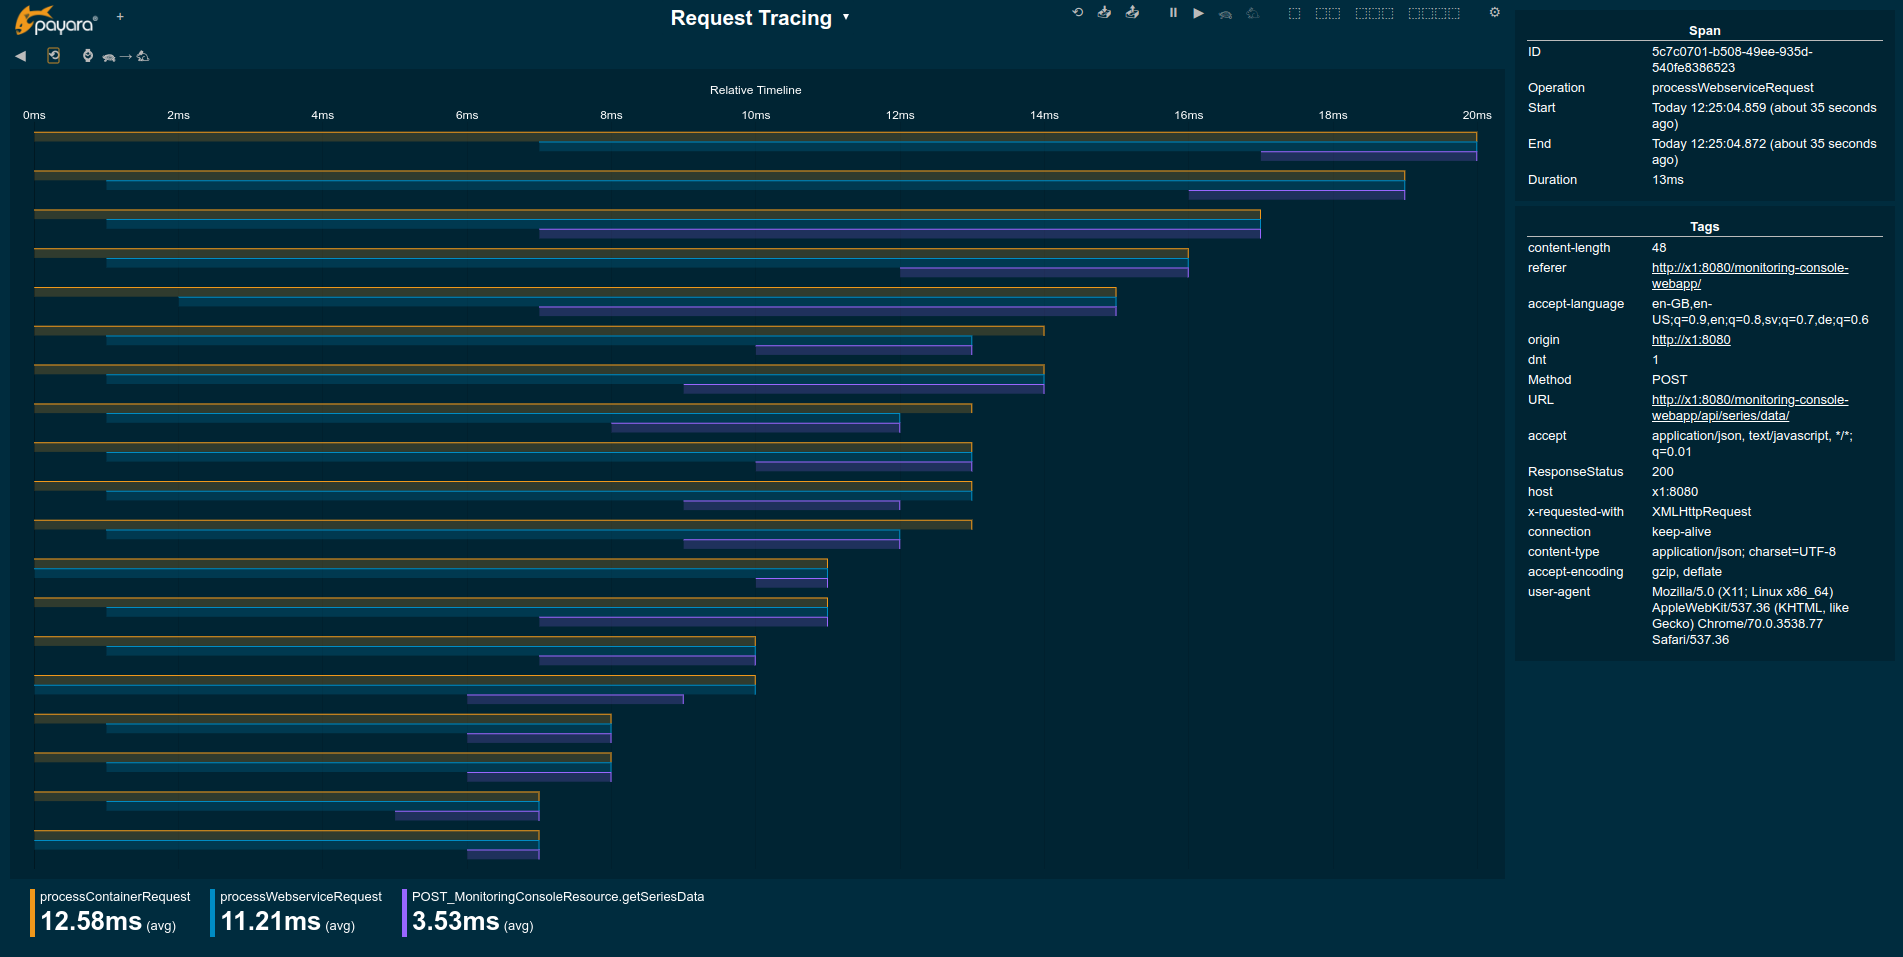
By default the traces are sorted longest (slowest) to shortest (fastest) total duration. On the time axis the spans are shown relative to the start of the trace.
When the side panel is opened the details of each trace span can be viewed by clicking on the span bar.
The legend again gives average durations for each of the spans occuring for the traced method.
The detail view is not automatically refreshing. To refresh the view click on the ⟲ icon in the top left of the widget.
The spans can be sorted by wall time by clicking on the ? icon in the top left.
To switch sort order back to duration click the icon right to it.
To get back to the overview close the details by clicking the ? icon in the top left.
| Be aware that the graphs shown in the example images above show unrealistically low numbers because the request tracing had been configured to such low thresholds to force traces as requests exceed the set thresholds. In a more realistic configurations the durations are more likely to be in range of few hundret milliseconds to some seconds. |
Disable Data Collection
While the visualisation of data is located in the monitoring console web application the data collection itself is an integral part of the Payara Server.
To disable the data collection remove the monitoring-console-core.jar from the /glassfish/mondules folder of your installation(s) and restart the server.