As with any other services available in Payara Server, the Request tracing service can be configured by using the web console, administration commands or editing the domain.xml configuration file directly.
Using the Web Administration Console
To configure the Request Tracing Service in the Administration Console, go to Configuration → [instance-configuration (like server-config)] → Request Tracing:
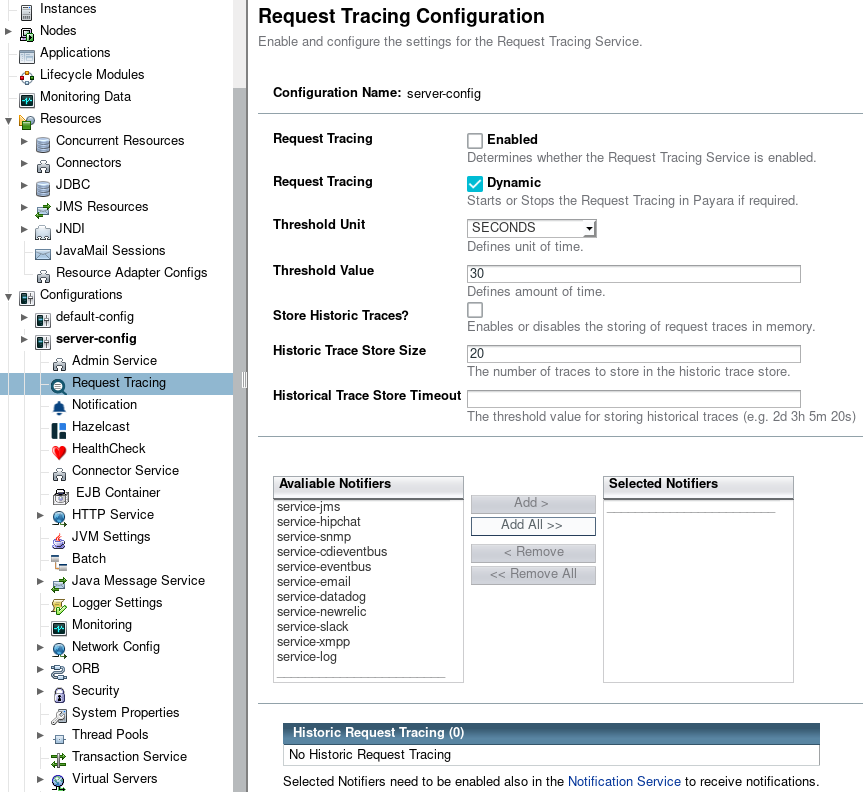
Check the Enabled box (and the Dynamic box too if you don’t want to restart the domain) to switch the request tracing service on.
You can configure the request tracing service settings using the following attributes:
- Threshold Unit
-
This defines the time duration per unit. The accepted options are any valid java.util.concurrent.TimeUnit values. The default value is SECONDS.
- Threshold Value
-
This defines the number of units beyond which a request will be traced.
- Store Historic Traces
-
When present, enables the storage of the slowest historical request trace events.
- Historic Trace Store Size
-
Determines the number of historical trace events that can be stored in memory when historical storing is enabled. The default value is 20 records.
- Historic Trace Store Timeout
-
Determines how long before Request Tracing messages are removed. This field is specified in the format "%d %h %m %s" where % is an integer. Any of the units can also be omitted.
Aside from this configuration settings, you can also define which notifiers will be used to relay the request tracing events by moving them to the Active Notifiers box.
| Keep in mind that for request tracing events to be relayed to the active notifiers, both the Notification Service and each respective notifier must be enabled first. |
| You don’t need to manually add each notifier on this screen. When enabling a notifier on its configuration screen, the server will automatically add it to the list of active notifiers for the Request Tracing service. This same result occurs when enabling the notifier using the appropriate asadmin command. |
| Configuring active notifiers for the Request Tracing service is a feature available from Payara Server 4.1.2.172 onwards. |
Editing the domain.xml configuration file
To configure the Notification Service in the domain.xml configuration
file, locate the request-tracing-service-configuration element in the
tree and modify the attributes described in the previous section:
<request-tracing-service-configuration
    enabled="true"
    threshold-value="30"
    threshold-unit="SECONDS"
    historical-trace-store-size="25"
    historical-trace-enabled="true"
    historical-trace-store-timeout="1d 2h 3m 30s">
    <log-notifier></log-notifier>
    <datadog-notifier enabled="true"></datadog-notifier>
    <new-relic-notifier enabled="true"></new-relic-notifier>
    <xmpp-notifier></xmpp-notifier>
    <email-notifier></email-notifier>
    <slack-notifier enabled="true"></slack-notifier>
    <eventbus-notifier></eventbus-notifier>
    <cdi-eventbus-notifier></cdi-eventbus-notifier>
    <hipchat-notifier></hipchat-notifier>
    <snmp-notifier></snmp-notifier>
    <jms-notifier></jms-notifier>
</request-tracing-service-configuration>
To activate a notifier for the service, simply change the enabled attribute of the
notifier sub-tag (e.g. for the Slack Notifier, use the slack-notifier sub-tag
and so forth).
| If a notifier sub-tag element is not present in the configuration, then that notifier is treated as inactive when the server starts. |
| Modifying the domain.xml configuration is not a supported configuration method, so be careful when considering this option. |
From the Command Line
You can configure the Request Tracing Service by using the administrations commands documented on the corresponding section