Payara Server provides support for custom SQL Trace Listeners. A SQL Trace Listener is registered against a data source and is called after each method call made on the JDBC connection pool.
SQL Trace Listeners allows developers to track all calls to the database and can be used to develop custom auditing, error handling or monitoring components. SQL Trace Listeners can be enabled globally on a data source if the class that implements it is on the server’s classpath, or can be enabled on application specific data sources by including them in the application’s WAR or EAR.
SQL Trace listener Interface
The SQL Trace Listener interface is shown below:
public interface SQLTraceListener {
    /**
     * Notify listeners with SQL trace information.
     * @param record SQLTraceRecord that has information related
     * to the SQL operation
     */
    public void sqlTrace(SQLTraceRecord record);

}
To write a custom trace listener you need to implement the interface and
override the sqlTrace method. The SQLTraceRecord object contains
information about the execute call to the JDBC connection pool. The following
is the list of properties that can be queried using their respective getter
methods:
    /**
     * Thread ID from which SQL statement originated.
     */
    private long threadID;

    /**
     * Thread Name from which SQL statement originated.
     */
    private String threadName;

    /**
     * Pool Name in which the SQL statement is executed.
     */
    private String poolName;

    /**
     * Type of SQL query. Could be PreparedStatement, CallableStatement or
     * other object types.
     */
    private String className;

    /**
     * Method that executed the query.
     */
    private String methodName;

    /**
     * Time of execution of query.
     */
    private long timeStamp;

    /**
     * Parameters of the method that executed the SQL query. Includes information
     * like SQL query, arguments and so on.
     */
    private Object[] params;
SQL Trace Listener Sample
The following code fragment illustrates a sample SQL trace listener that just logs the executed call to the server’s log file:
public class SQLTraceLogger implements SQLTraceListener {

    private static Logger _logger = initLogger();

    private static Logger initLogger() {
        _logger = LogDomains.getLogger(SQLTraceLogger.class, LogDomains.SQL_TRACE_LOGGER);
        return _logger;


    public SQLTraceLogger() {


    public void sqlTrace(SQLTraceRecord record) {
        _logger.log(Level.FINE, record.toString());


}
Configuring SQL Trace Listeners
Using the Administration Console
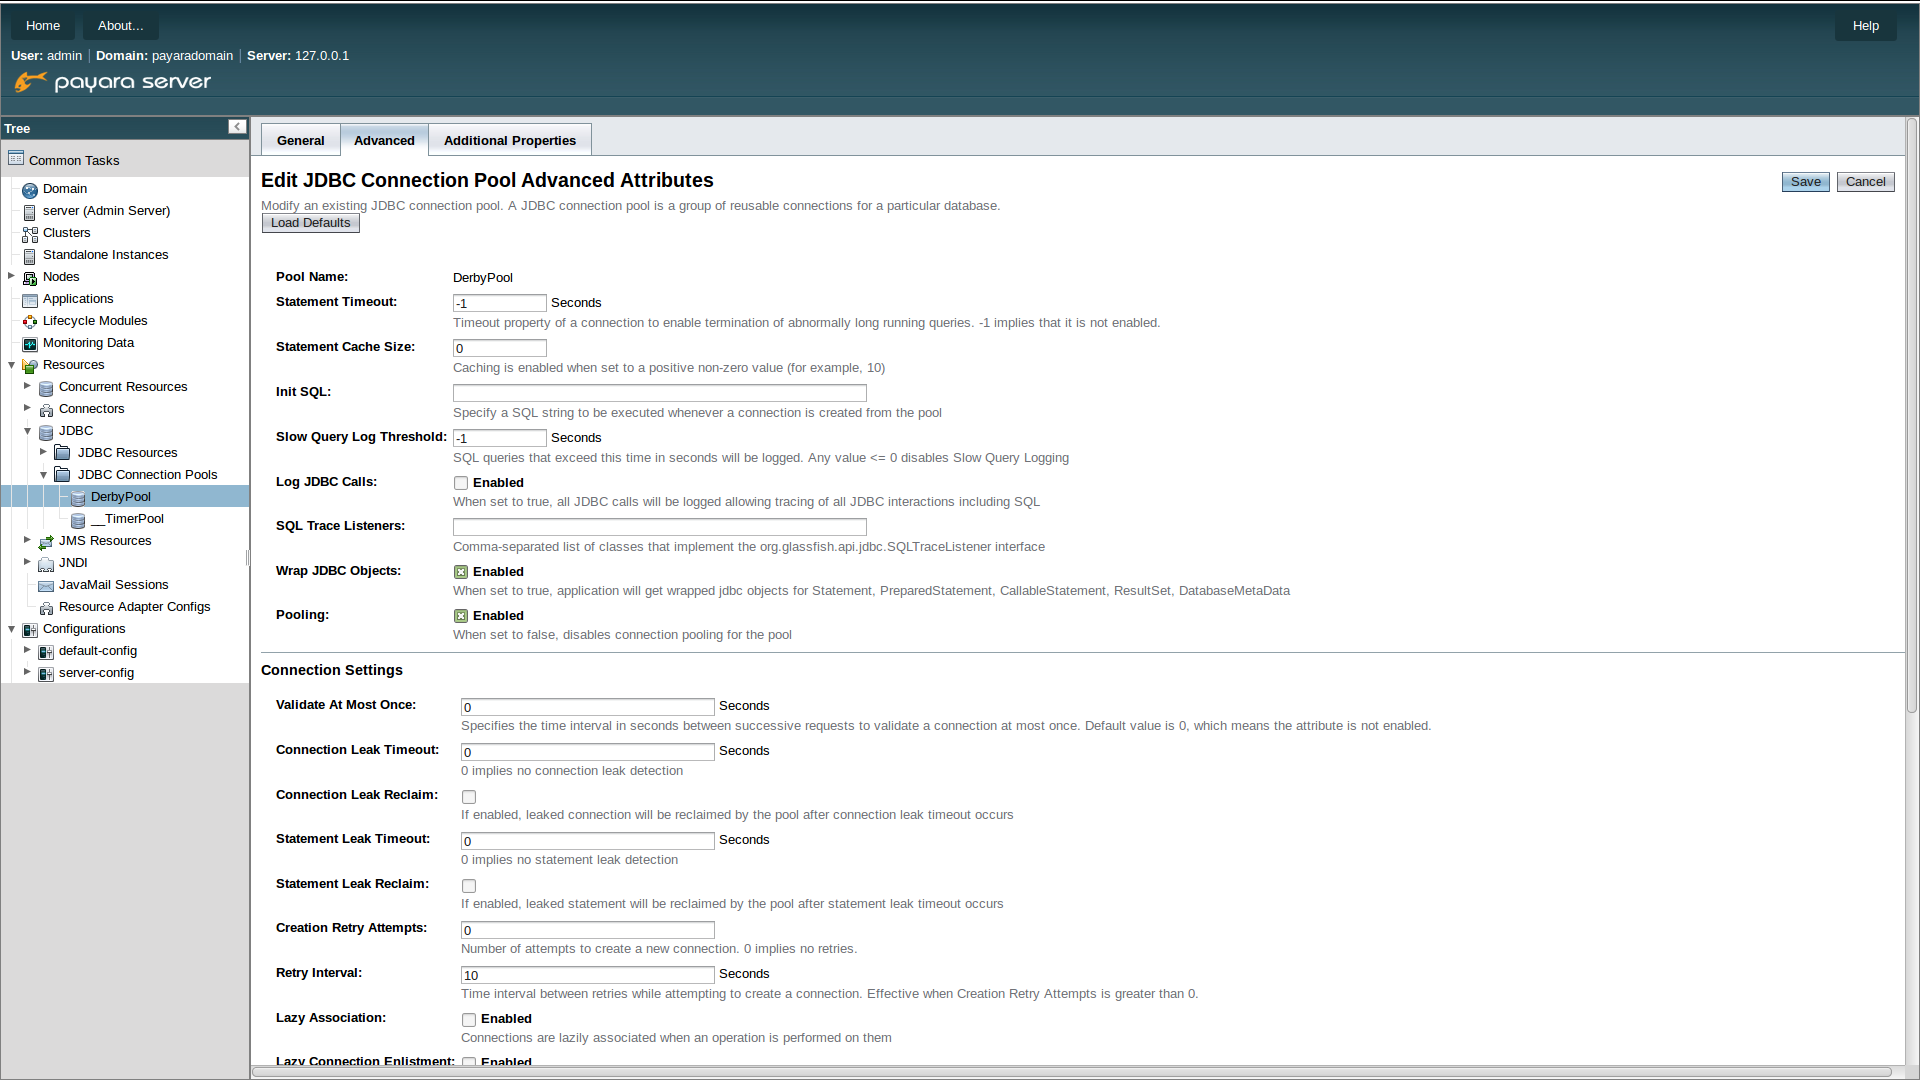
SQL Trace Listeners can be enabled on a JDBC connection pool through the administration web console. Navigate to the Advanced Tab of your connection pool by selecting the JDBC → JDBC Connection Pools → <Your Connection pool>.
Proceed to add the fully qualified class name of your SQL Trace Listener implementation class in the SQL Trace Listeners field:
| The implementation class must be on the server’s classpath for it to work correctly |
Using asadmin commands
SQL Trace Listeners can be enabled on a JDBC connection pool using with an
asadmin commands by using the set command to set the
fish.payara.lsql-trace-listeners to the fully qualified class name of
your listener implementation, like on the following example:
asadmin set domain.resources.jdbc-connection-pool.__TimerPool.sql-trace-listeners=fish.payara.examples.payaramicro.datasource.example.CustomSQLTracerApplication Deployment
In Java EE 7 applications, a JDBC data source can be deployed by adding the
@DataSourceDefinition annotation to a managed component (like and @Stateless
EJB bean for example). SQL Trace Listener classes can be configured using this
annotation, like in the following example:
@DataSourceDefinition(
    name = "java:app/MyApp/MyDS",
    className = "org.h2.jdbcx.JdbcDataSource",
    url = "jdbc:h2:mem:test",
    properties = {"fish.payara.sql-trace-listeners=fish.payara.examples.payaramicro.datasource.example.CustomSQLTracer"})
The Data source definition can also be added to a deployment descriptor of an application, for example in the web.xml standard deployment descriptor:
<data-source>
    <name>java:global/ExampleDataSource</name>
    <class-name>com.mysql.jdbc.jdbc2.optional.MysqlXADataSource</class-name>
    <server-name>localhost</server-name>
    <port-number>3306</port-number>
    <database-name>mysql</database-name>
    <user>test</user>
    <password>test</password>
    <!-- Example of how to use a Payara specific custom connection pool setting -->
    <property>
       <name>fish.payara.sql-trace-listeners</name>
       <value>fish.payara.examples.payaramicro.datasource.example.CustomSQLTracer</value>
    </property>
</data-source>
Payara Micro Support
Payara Micro also supports SQL Trace Listeners which brings powerful operational diagnostics to your micro-services platform. To add a SQL Trace Listener to your data source used by applications deployed on Payara Micro, use the annotation or deployment descriptor methods described in the previous section.