Datadog is a cloud metric aggregator that simplifies the gathering and visualization of multiple platform stacks and services that can be on premises or on the cloud. Datadog also eases browsing through of all this information by implementing combination graphs (multiple graphs that can be configured on a single view) of related metrics.
Datadog supports gathering metrics from the following sources:
-
Cloud Providers (Amazon Web Services, Microsoft Azure, Google Cloud Platform)
-
Message Queues (Apache Kafka, ActiveMQ, RabbitMQ)
-
Code Repositories (GitHub, Bitbucket)
-
Clustering and DevOps Tools (Apache Mesos, Kubernetes, Docker)
-
Web Servers (Apache HTTP, Nginx, LightHTTP)
-
SQL and NoSQL Databases (MySQL, PostgreSQL, MongoDB, CouchBase)
-
Monitoring Solutions (New Relic, Nagios, Splunk, Amazon Cloud Trail)
Payara Server includes a special notifier to send notifications from the Notification service to a Datadog account by means of an API key.
Currently, the Payara Datadog notifier only supports the US1 - East region.
|
Datadog Account Integration
When you create a Datadog account, the service will provide you a default API key that you can use to integrate Payara Server with your account.
| You can sign up for a free trial account (14 days) if you want to test this integration without having to worry about a permanent subscription. |
Here are the instructions to retrieve the API keys:
-
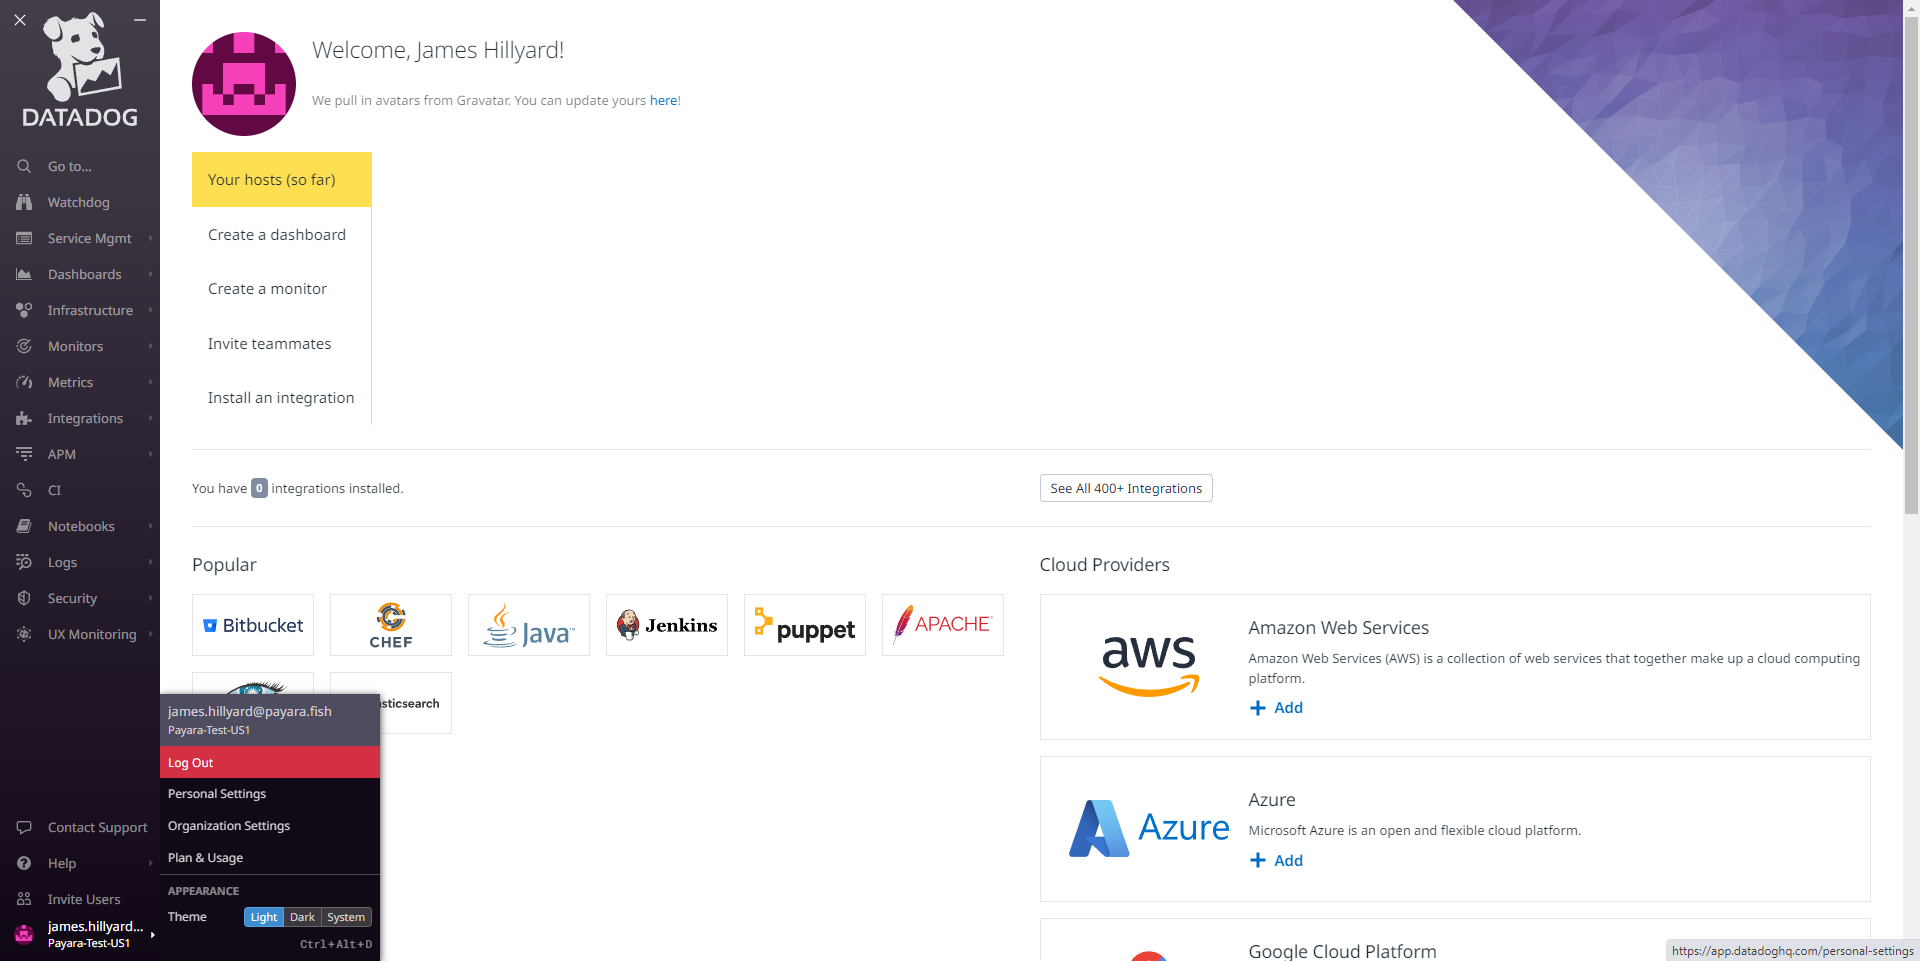
First, access the Datadog administration panel located at https://app.datadoghq.com/. Then, in the side menu select your name in the bottom left Organisation Settings → API Keys option:
-
On the API Keys tab you will observe the default API Key available for integration:
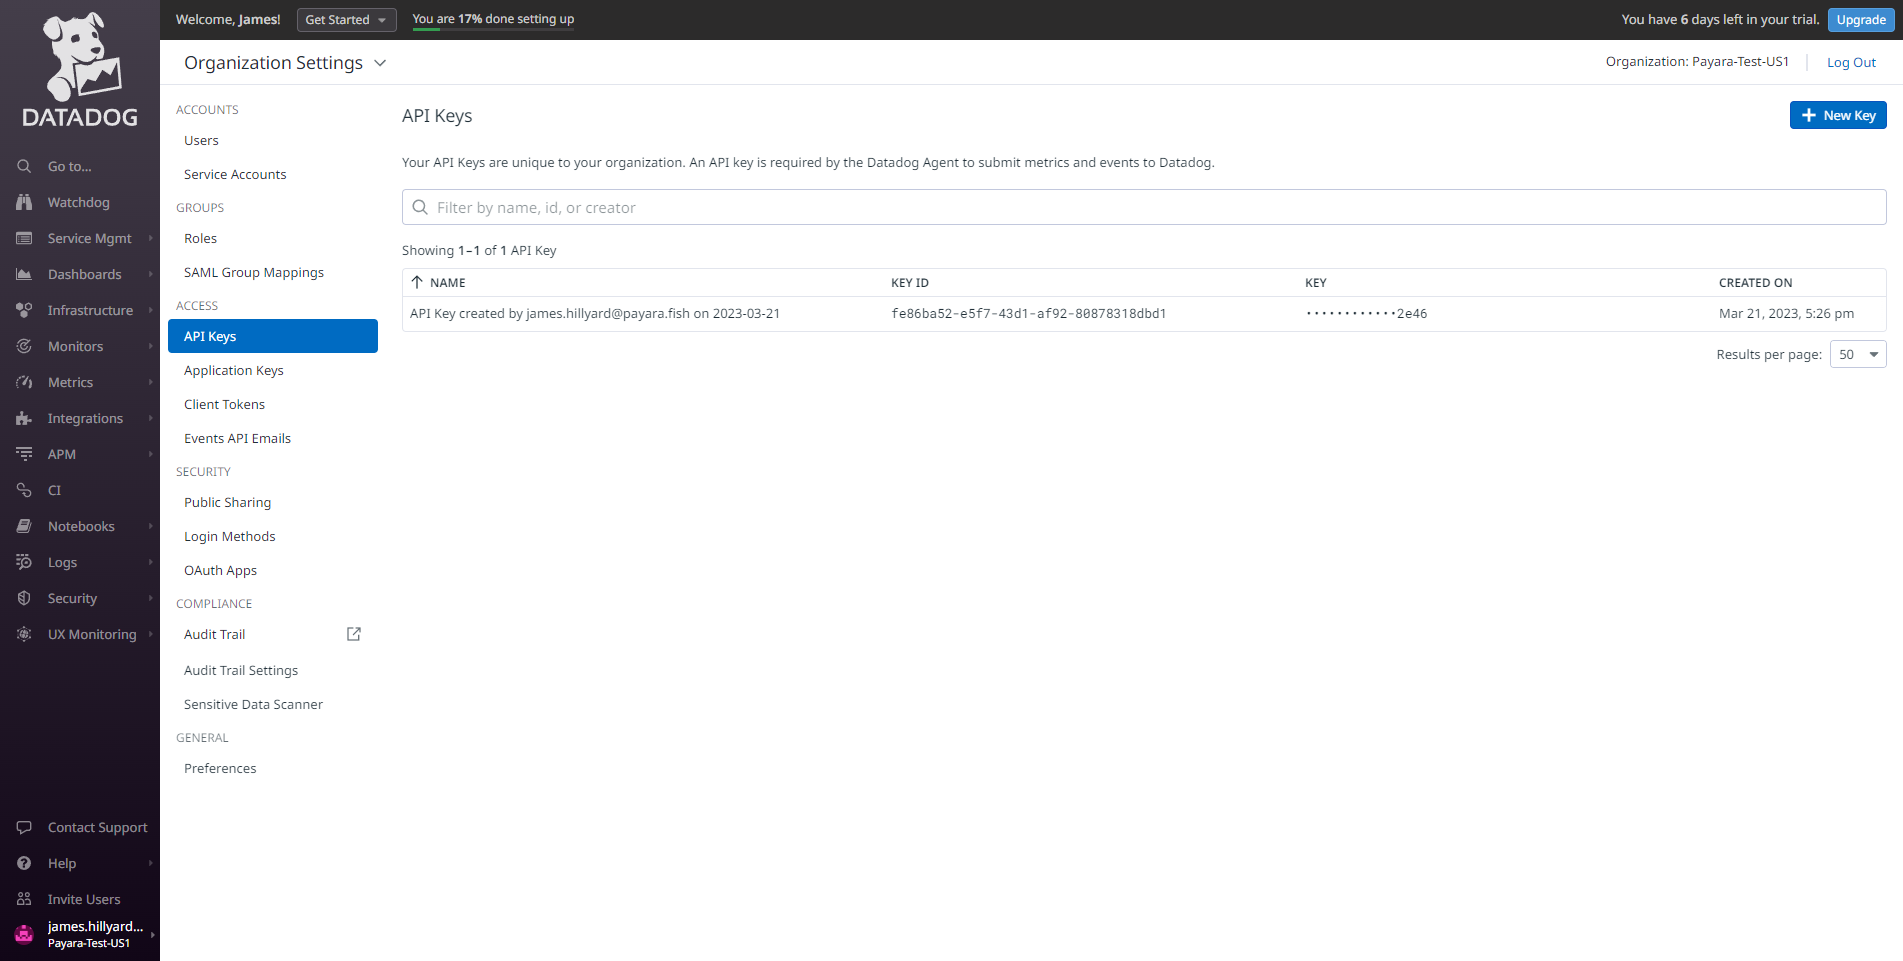
You can also create a new API key if you want to use it exclusively for your Payara Server installation.
-
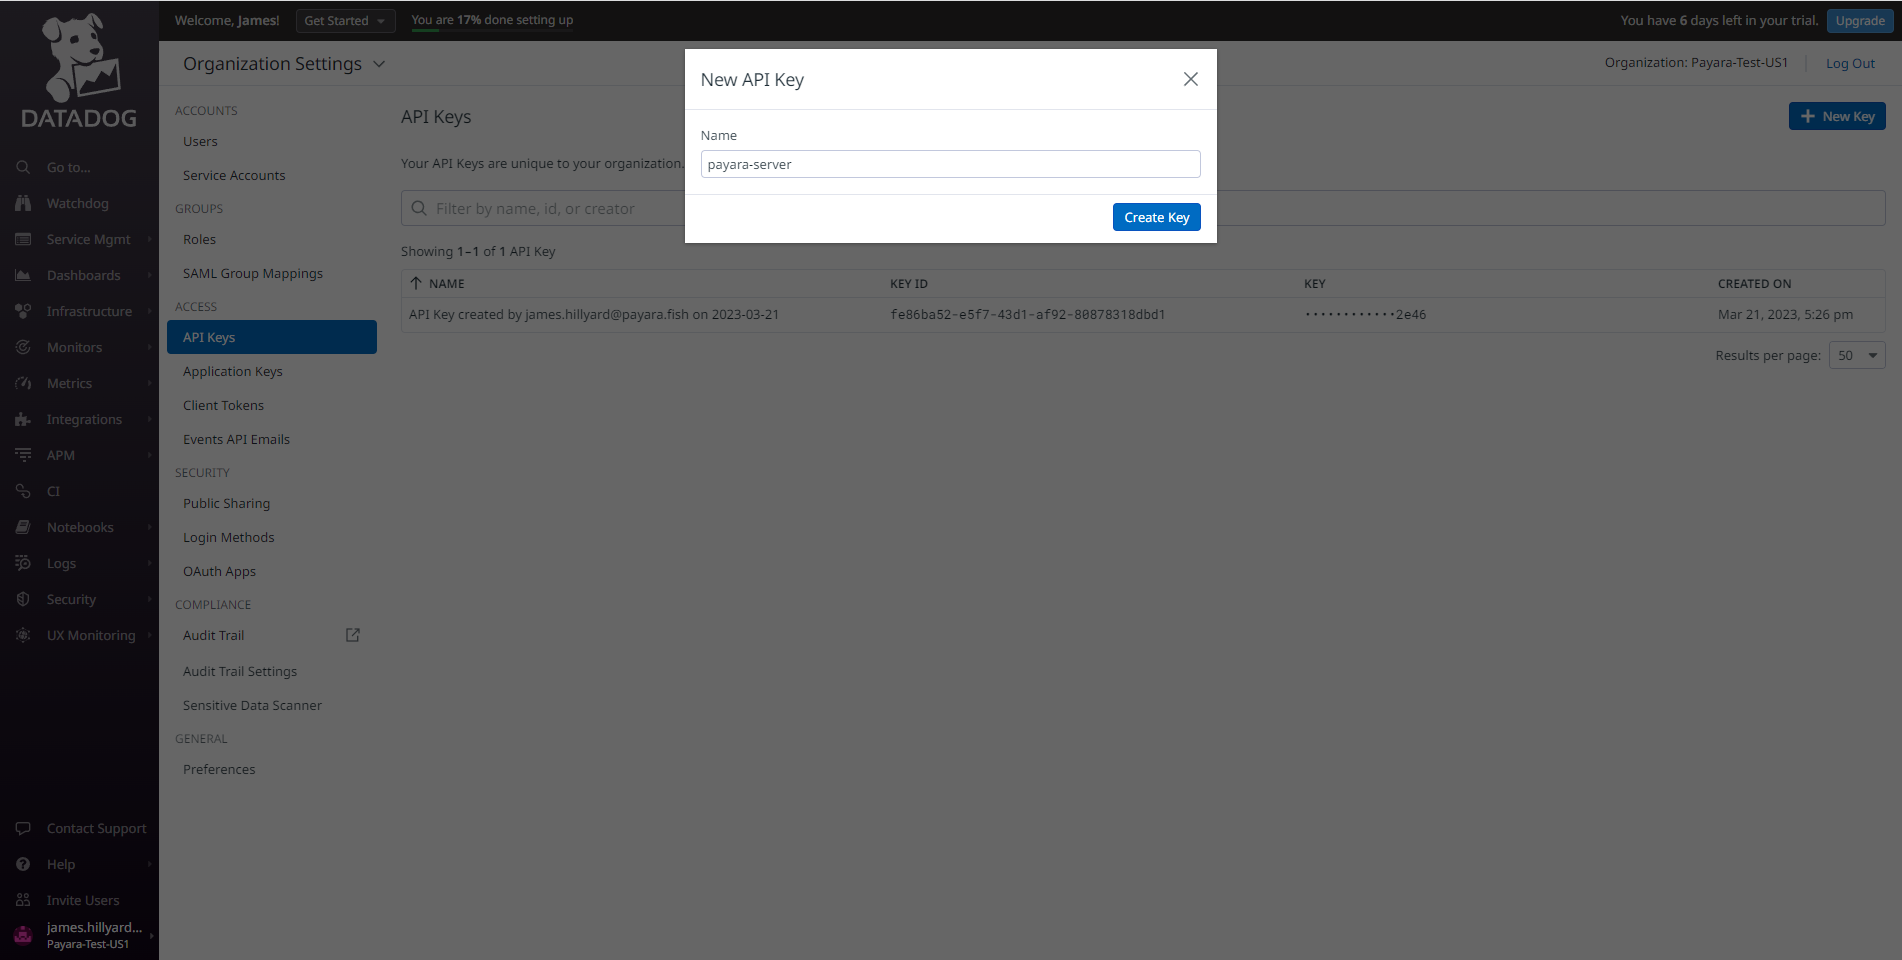
Assign a name to the default API key or a newly created key, so you can identify which services or platform stacks are integrating with Datadog other than your Payara Server installation:
Payara Server Configuration
Having retrieved the API key from Datadog’s administration panel, it’s necessary to configure this key to the notification service on Payara Server. It’s possible to do this either by using the administration web console, from the command line using administration commands or by modifying the domain.xml configuration file directly.
Using the Administration Web Console
To configure the Notification Service in the Administration Console, go to Configuration → [instance-configuration (like server-config)] → Notification Service and click on the Datadog tab:
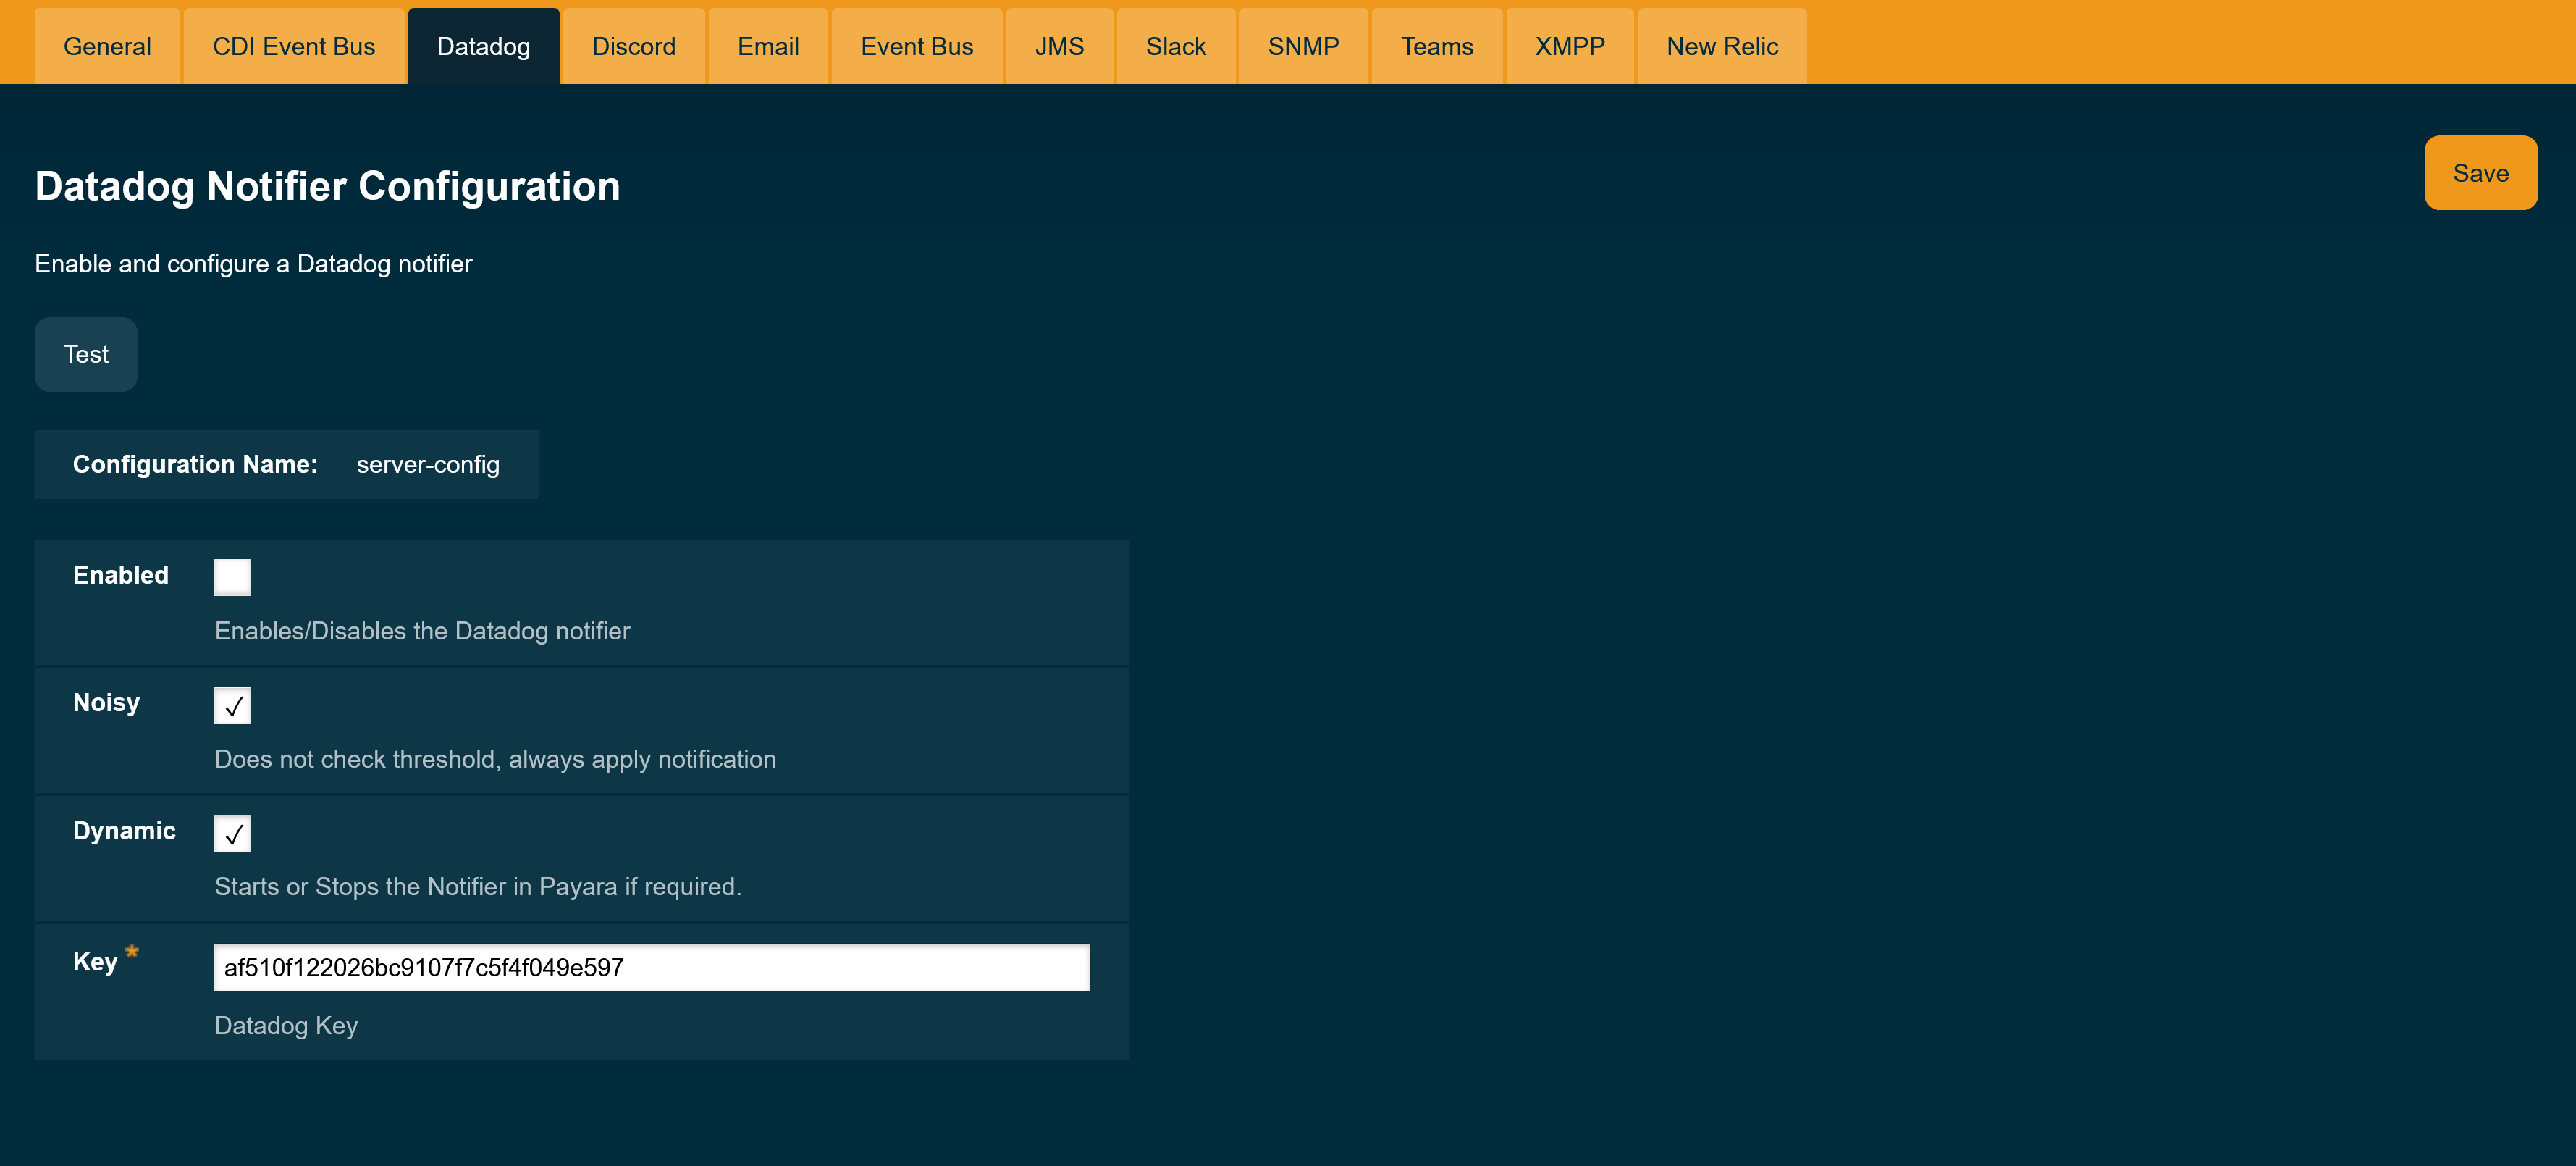
Check the Enabled box (and the Dynamic box too if you don’t want to restart the domain) and input the three tokens highlighted in the previous section. Hit the Save button to preserve the changes.
From the Command Line
To configure the Notification Service from the command line, use the set-datadog-notifier-configuration asadmin command, specifying the tokens
like this:
asadmin> set-datadog-notifier-configuration --dynamic=true --key=af510f122026bc9107f7c5f4f049e597 --enabled=trueYou can use the --enabled and --dynamic options to enable or disable the Datadog notifier on demand.
Also, you can retrieve the current configuration for the Datadog notifier using the get-datadog-notifier-configuration asadmin command like this:
asadmin > get-datadog-notifier-configuration

Enabled  Filter   Key
true     WARNING  af510f122026bc9107f7c5f4f049e597
On the domain.xml configuration file
To configure the Notification Service in the domain.xml configuration file, locate the notification-service-configuration element in the tree and insert the datadog-notifier-configuration with the respective attributes like this:
<notification-service-configuration enabled="true">
  <log-notifier-configuration enabled="true"></log-notifier-configuration>
  <datadog-notifier-configuration enabled="true" key="af510f122026bc9107f7c5f4f049e597"></datadog-notifier-configuration>
</notification-service-configuration>| Modifying the domain.xml configuration is not a supported configuration method, so be careful when considering this option. |
Troubleshooting
When you have correctly configured the Datadog notifier, Datadog can gather relevant monitoring events from your Payara Server installation. If you do not see any notification event messages on your Datadog account, check the following:
-
Is the Datadog notifier enabled?
-
Is the Notification Service itself enabled?
-
Is there a service configured to use the notifier? (e.g. the HealthCheck service)
-
Is the service configured to send notifications frequently enough to observe?
-
Have you enabled the service after configuring it?
-
Does the configured API key on Payara Server match one of the API keys configured on your Datadog account?
-
Is Datadog running in the US1 region?
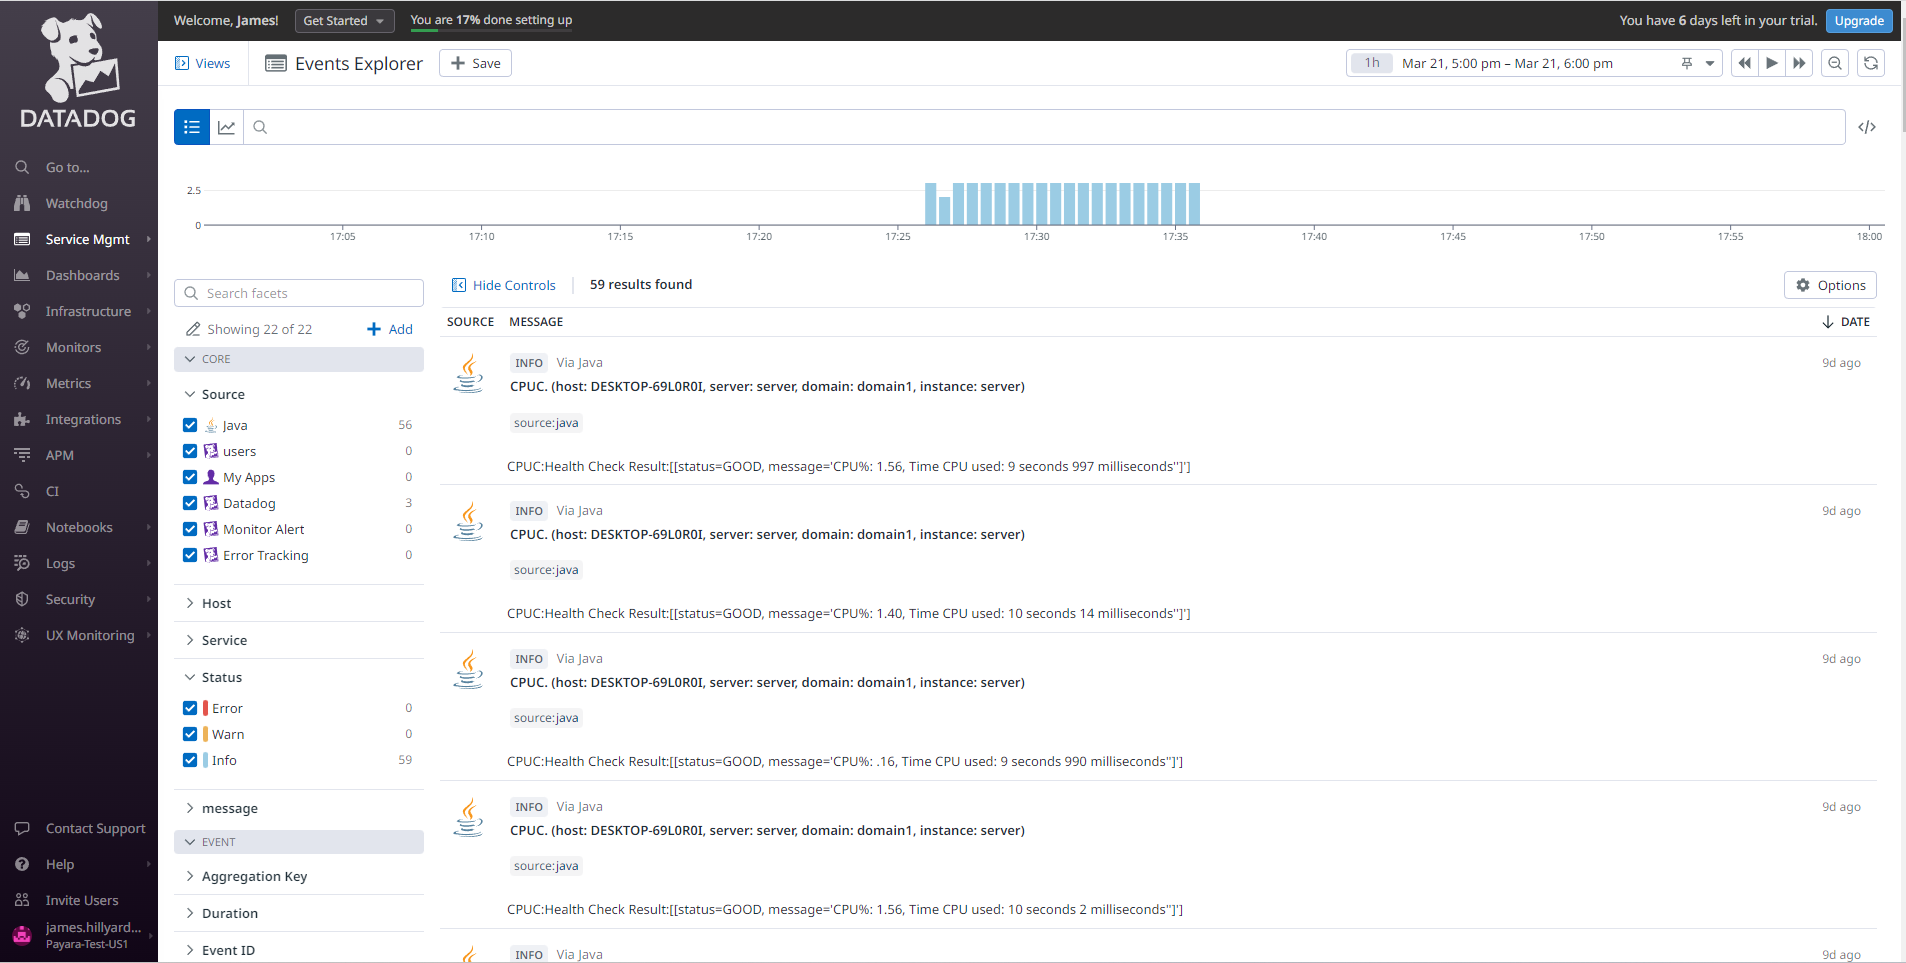
Here’s a sample of how the notifications are visualized on the Datadog event notification panel (on the side menu select the ServiceMgmt → Events option):
