As with any other services available in Payara Server Enterprise, the HealthCheck service can be configured by using the web console, administration commands or editing the domain.xml configuration file directly.
Using the Web Administration Console
To configure the HealthCheck Service in the Administration Console, go to Configuration → [instance-configuration (like server-config)] → Healthcheck:
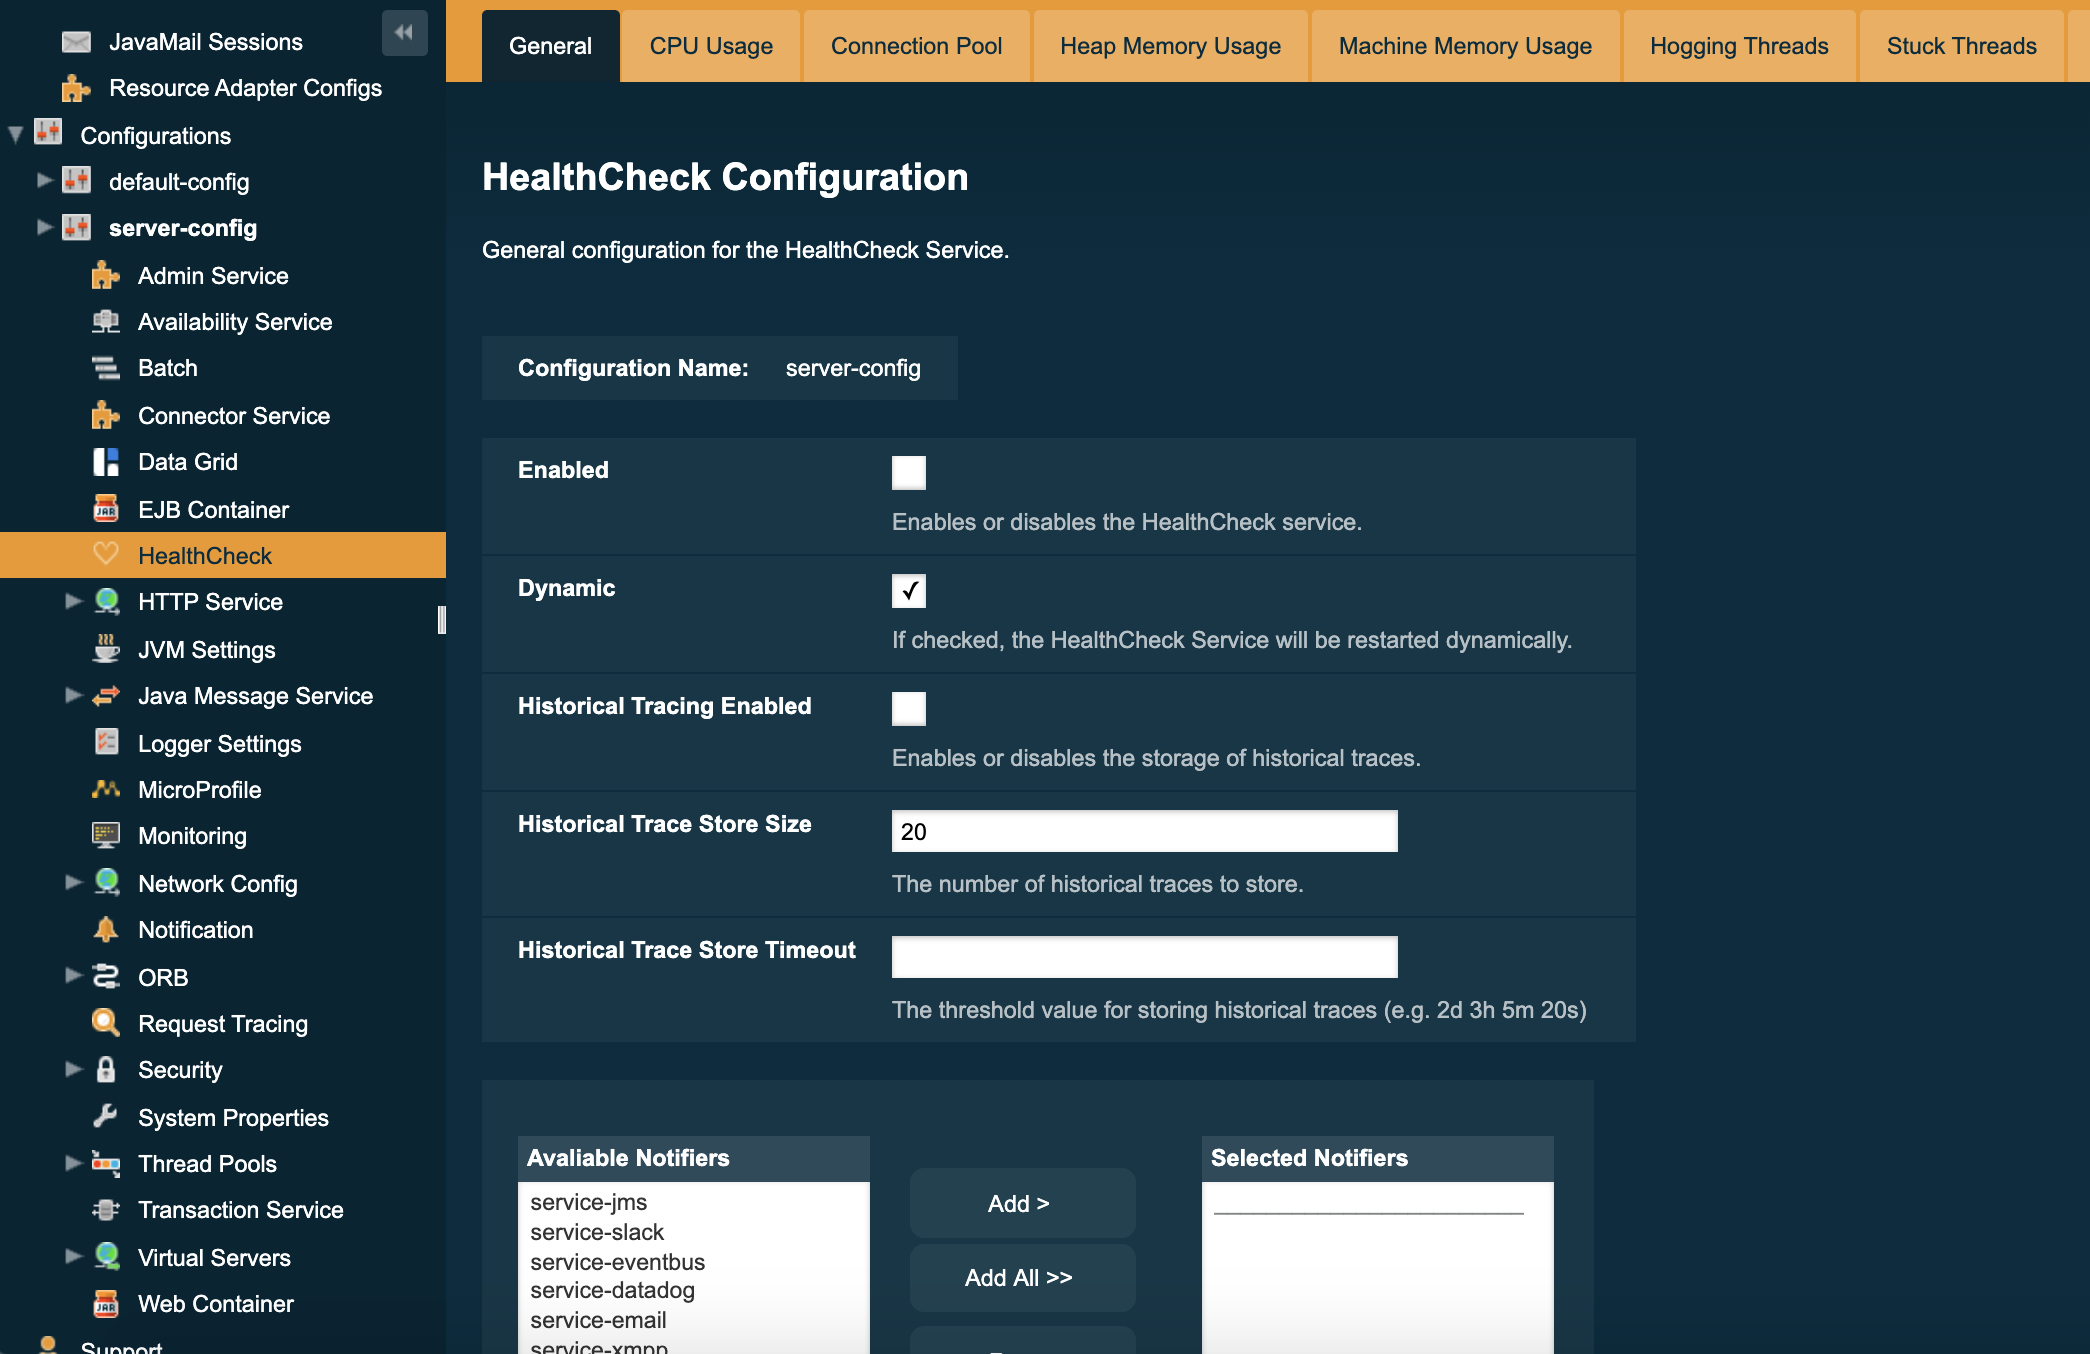
Check the Enabled box (and the Dynamic box too if you don’t want to restart the domain) to switch the HealthCheck service on.
The general settings of the service are:
- Threshold Unit
-
This defines the time duration per unit. The accepted options are any valid java.util.concurrent.TimeUnit values. The default value is SECONDS.
- Threshold Value
-
This defines the number of units beyond which a request will be traced.
- Store Historic Traces
-
When present, enables the storage of the slowest historical request trace events.
- Historic Trace Store Size
-
Determines the number of historical trace events that can be stored in memory when historical storing is enabled. The default value is 20 records
Aside from this configuration settings, you can also define which notifiers will be used to relay the HealthCheck events by moving them to the Active Notifiers box.
| Keep in mind that for HealthCheck events to be relayed to the active notifiers, both the Notification Service and each respective notifier must be enabled first. |
| You don’t need to manually add each notifier on this screen. When enabling a notifier on its configuration screen, the server will automatically add it to the list of active notifiers for the HealthCheck service. This same result occurs when enabling the notifier using the appropriate asadmin command. |
| Configuring active notifiers for the HealthCheck service is a feature available from Payara Server 4.1.2.172 onwards. |
Configuring the Available Checkers
Each of the available checkers that are used to determine the server’s health can also be configured separately from each other on the admin console. The list of the available checkers is as follows:
- CPU Usage
-
Calculates the CPU usage and prints out the percentage along with the usage time.
- Connection Pool
-
Calculates the ratio of free/used connections available for all JDBC connections pool an prints the percentage of used connections for each active pool.
- Heap Memory Usage
-
Calculates the heap memory usage and prints out the percentage along with initial and committed heap sizes.
- Machine Memory Usage
-
Calculates the machine memory usage and prints out the percentage along with the total and used physical memory size.
- Hogging Threads
-
Identifies the threads that are hogging the CPU.
- Stuck Threads
-
Identifies the threads that are stuck for a specified period of time.
- Garbage Collector
-
Calculates and prints out how many times GC is executed with its elapsed time.
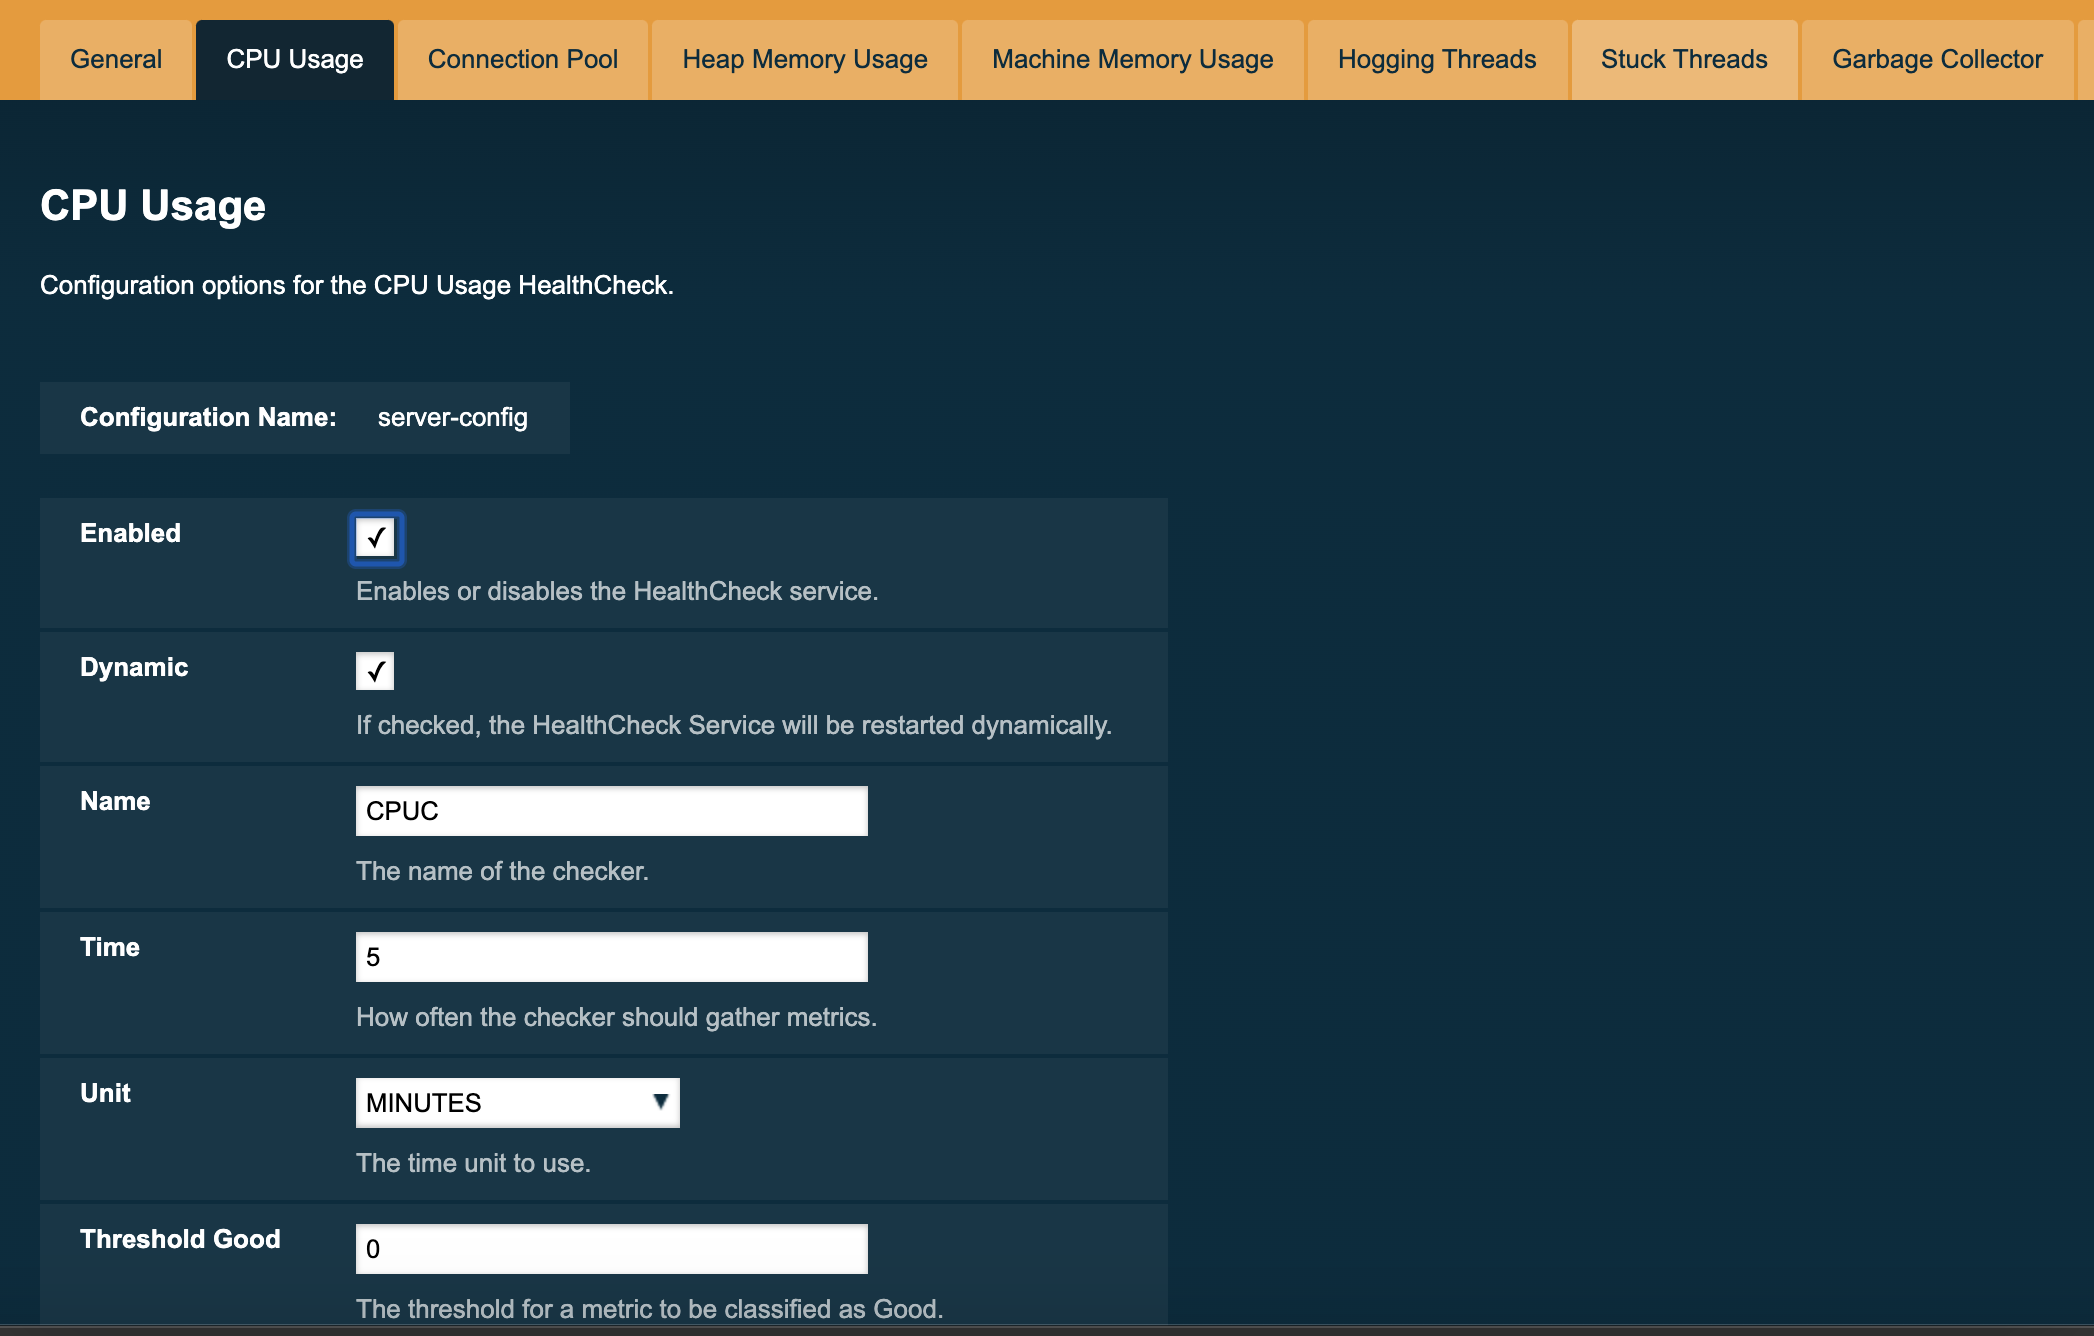
You can configure the settings for each checker on the respective tab in the web console. Here’s a sample image with the current configuration for the CPU Usage checker:
From the Command Line
You can configure the HealthCheck Service by using the asadmin commands documented on the corresponding section