Creating new Payara Micro Maven Application
-
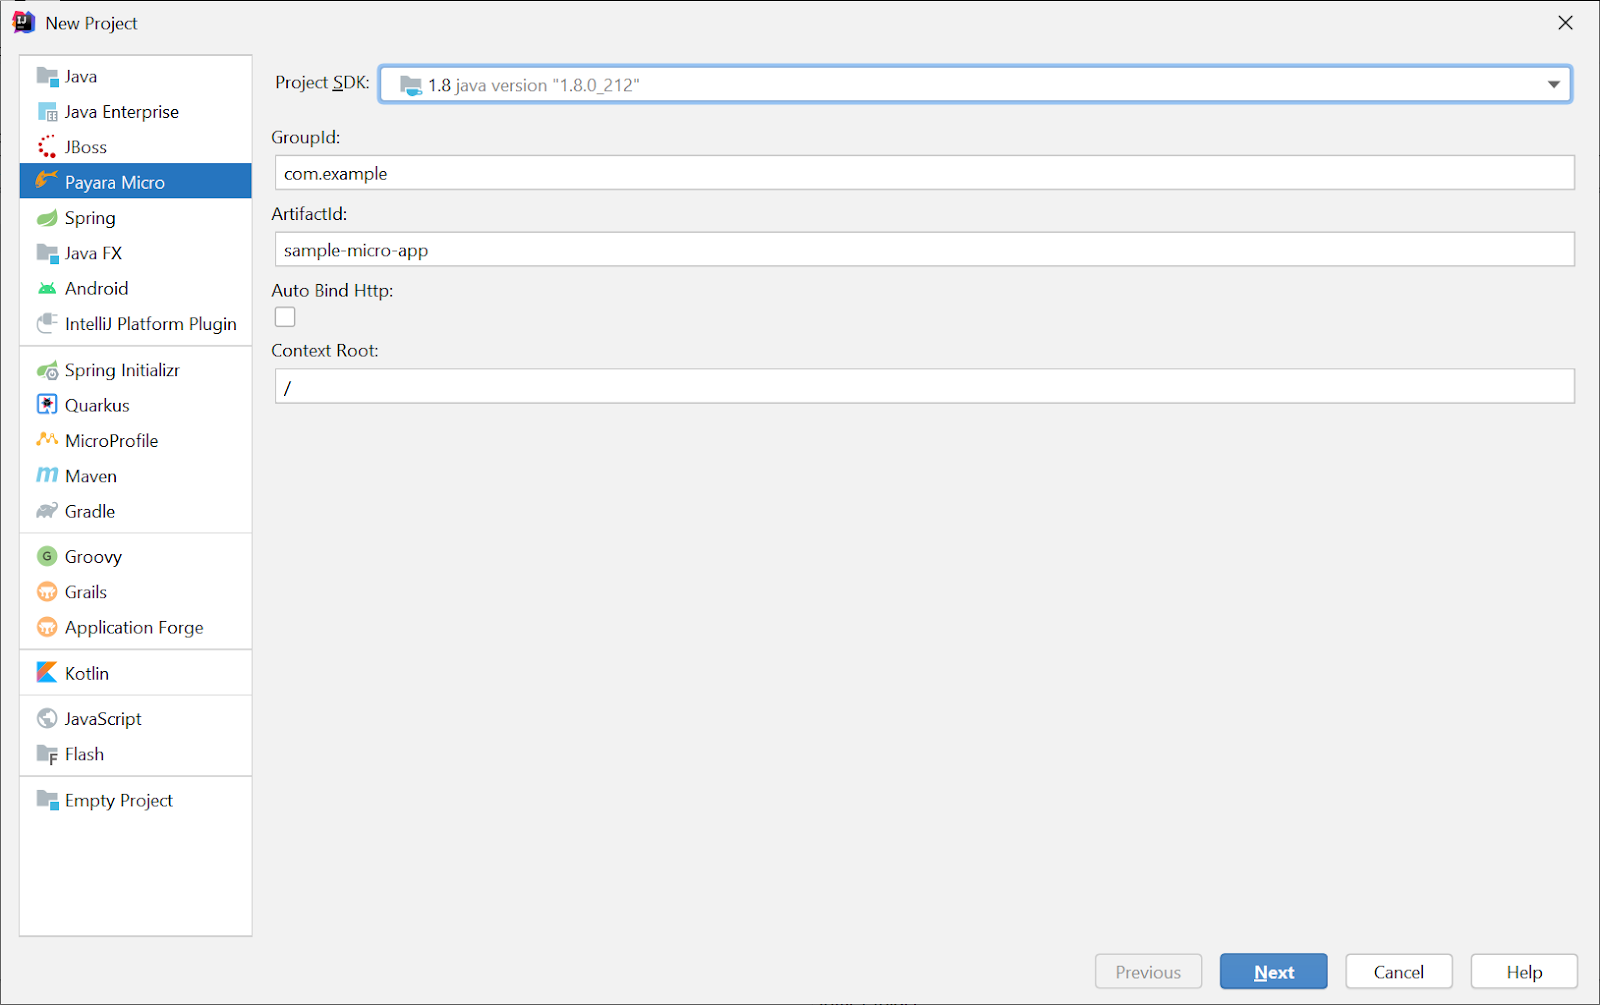
Simply start up IntelliJ IDEA and then Choose File > New > Project from the main menu and select the Payara Micro project type:
-
Enter the groupId, artifactId, etc to set up the project, and then click Next:
-
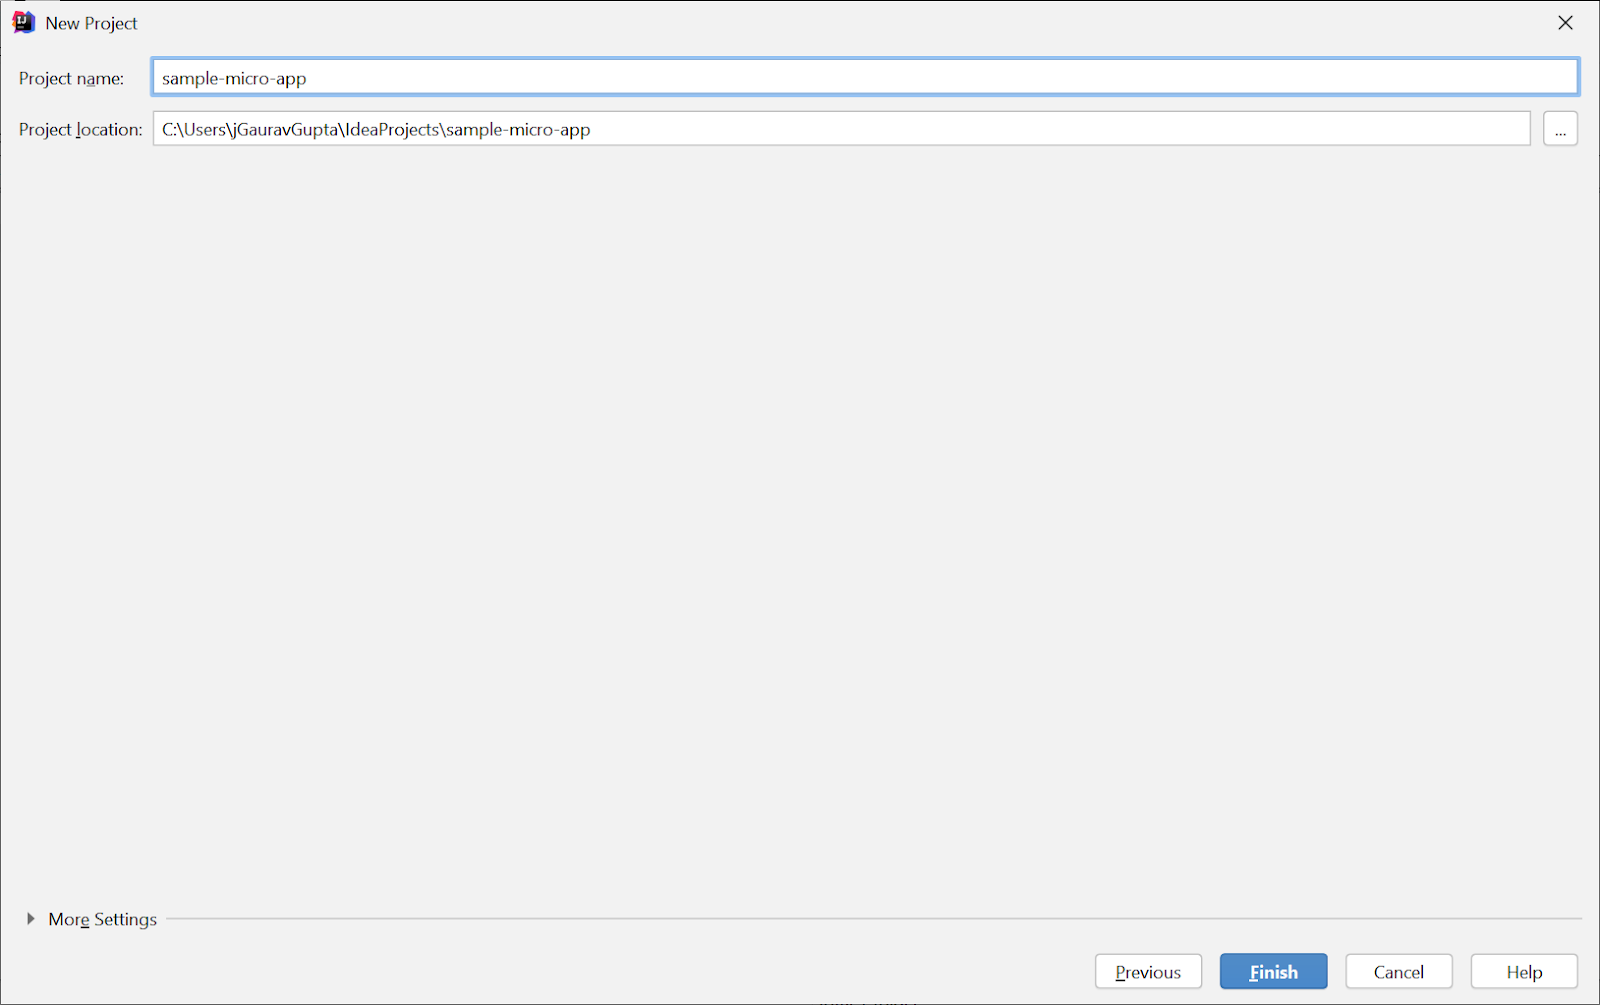
On the Project name and Location panel, enter sample-micro-app as the project name, set the Project destination folder and click Finish:
-
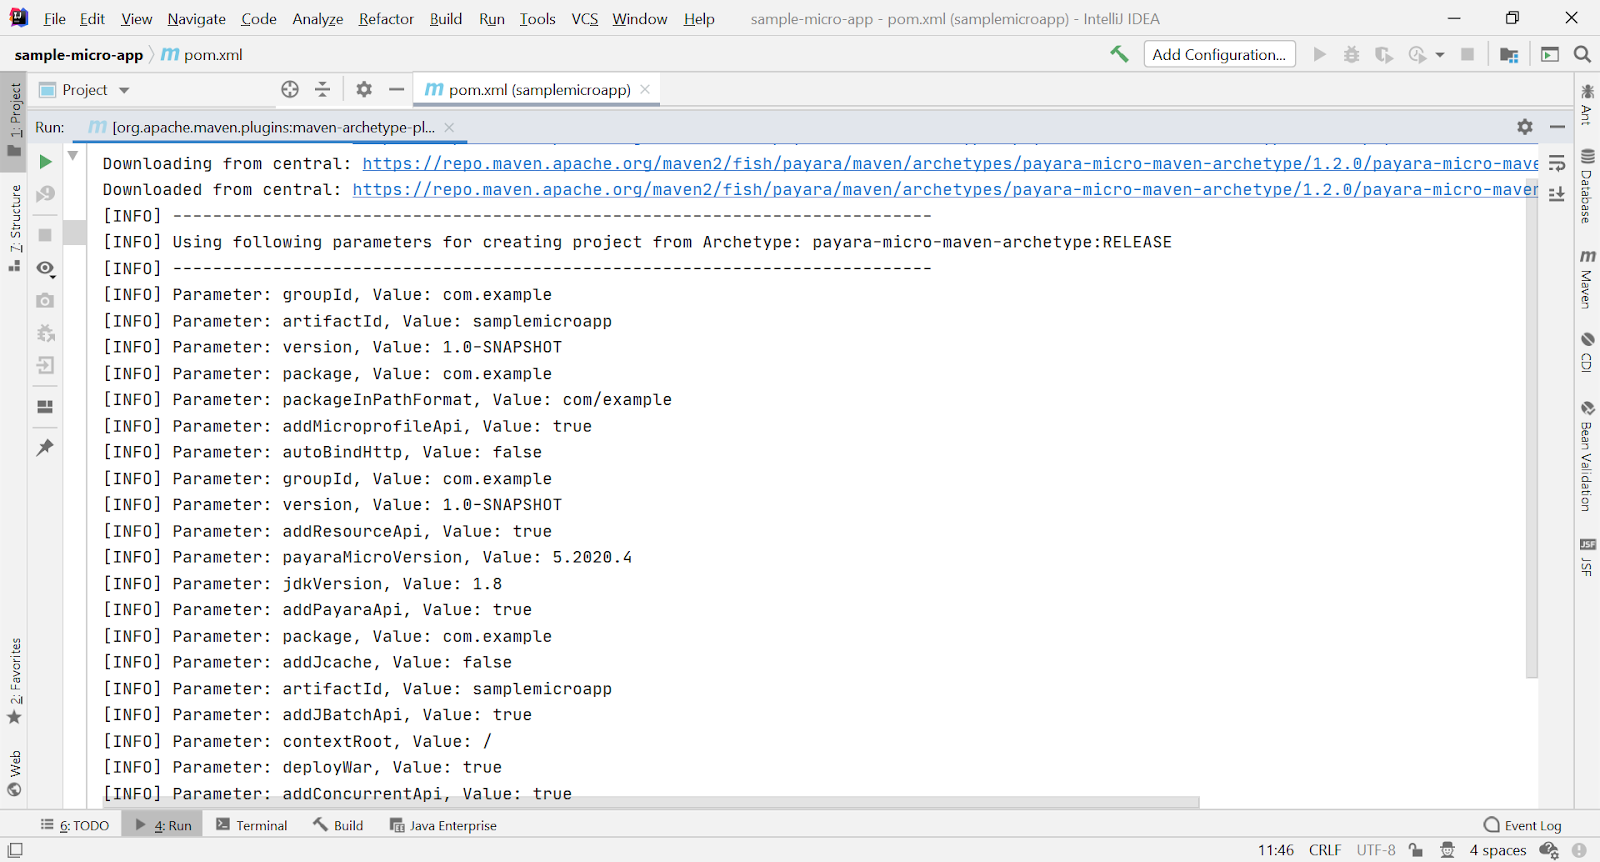
When you click Finish, the IDE creates the following projects from the Payara Micro maven archetype:
-
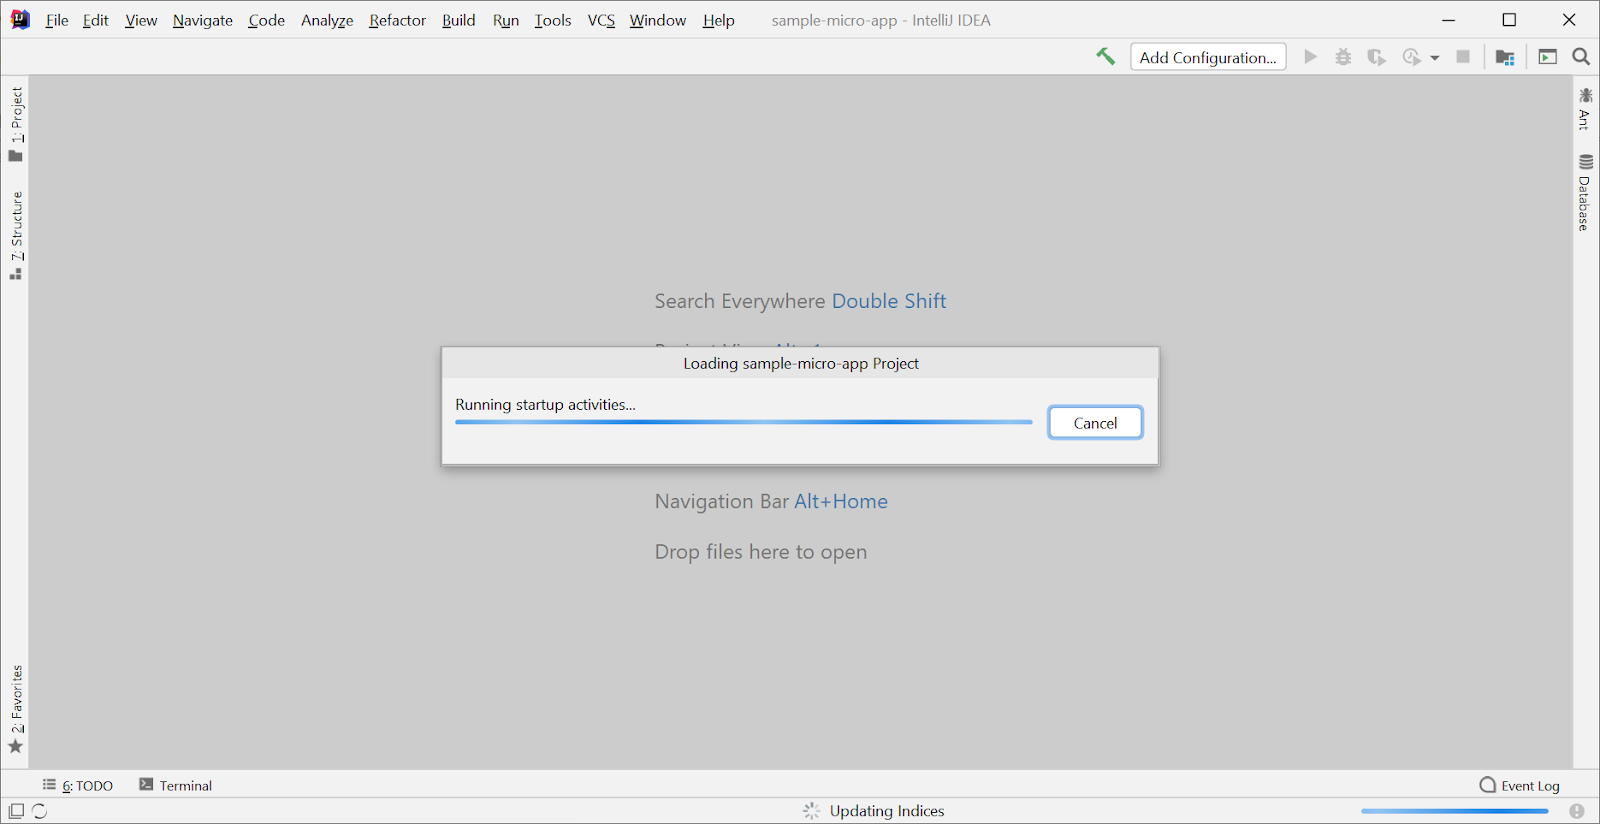
Once the project is generated, you may either add the project to the current workspace or open in a new window:
-
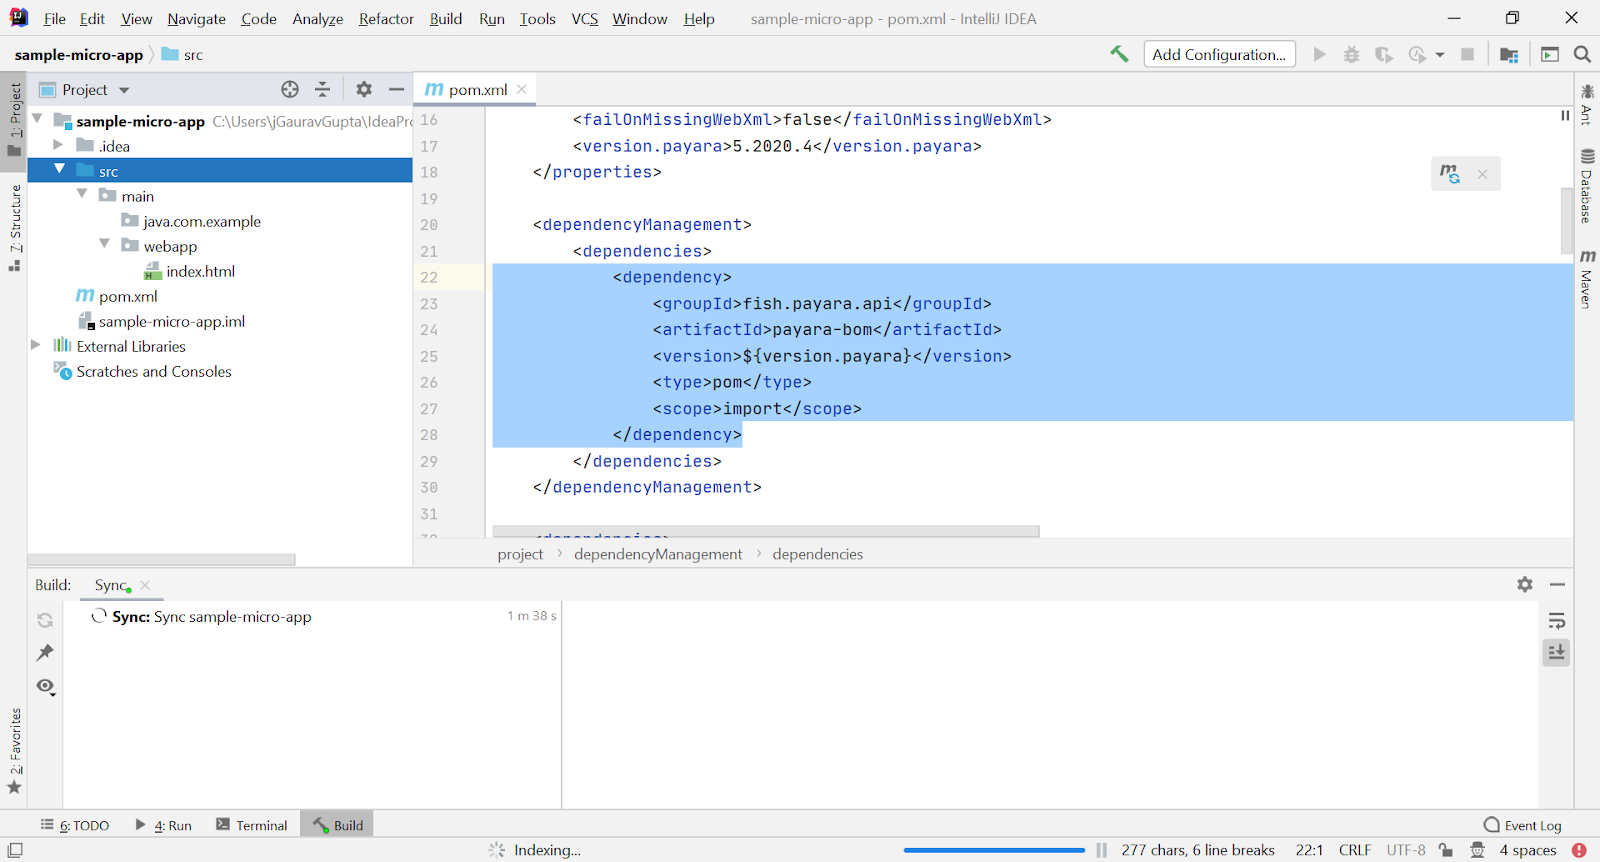
As you can see, the project has a basic structure with src\main\java and src\main\webapp folders:
Payara Micro application can be managed via IntelliJ Run/Debug configuration or Actions, where Run configuration can be customized by the developer and Actions are quick & easy to use:
Run the Payara Micro Application via configuration:
IntelliJ IDEA needs a run configuration to build the artifacts and run the Payara Micro application.
-
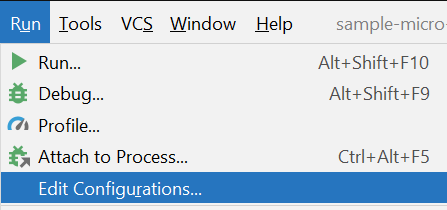
From the main menu, select Run | Edit Configurations:
-
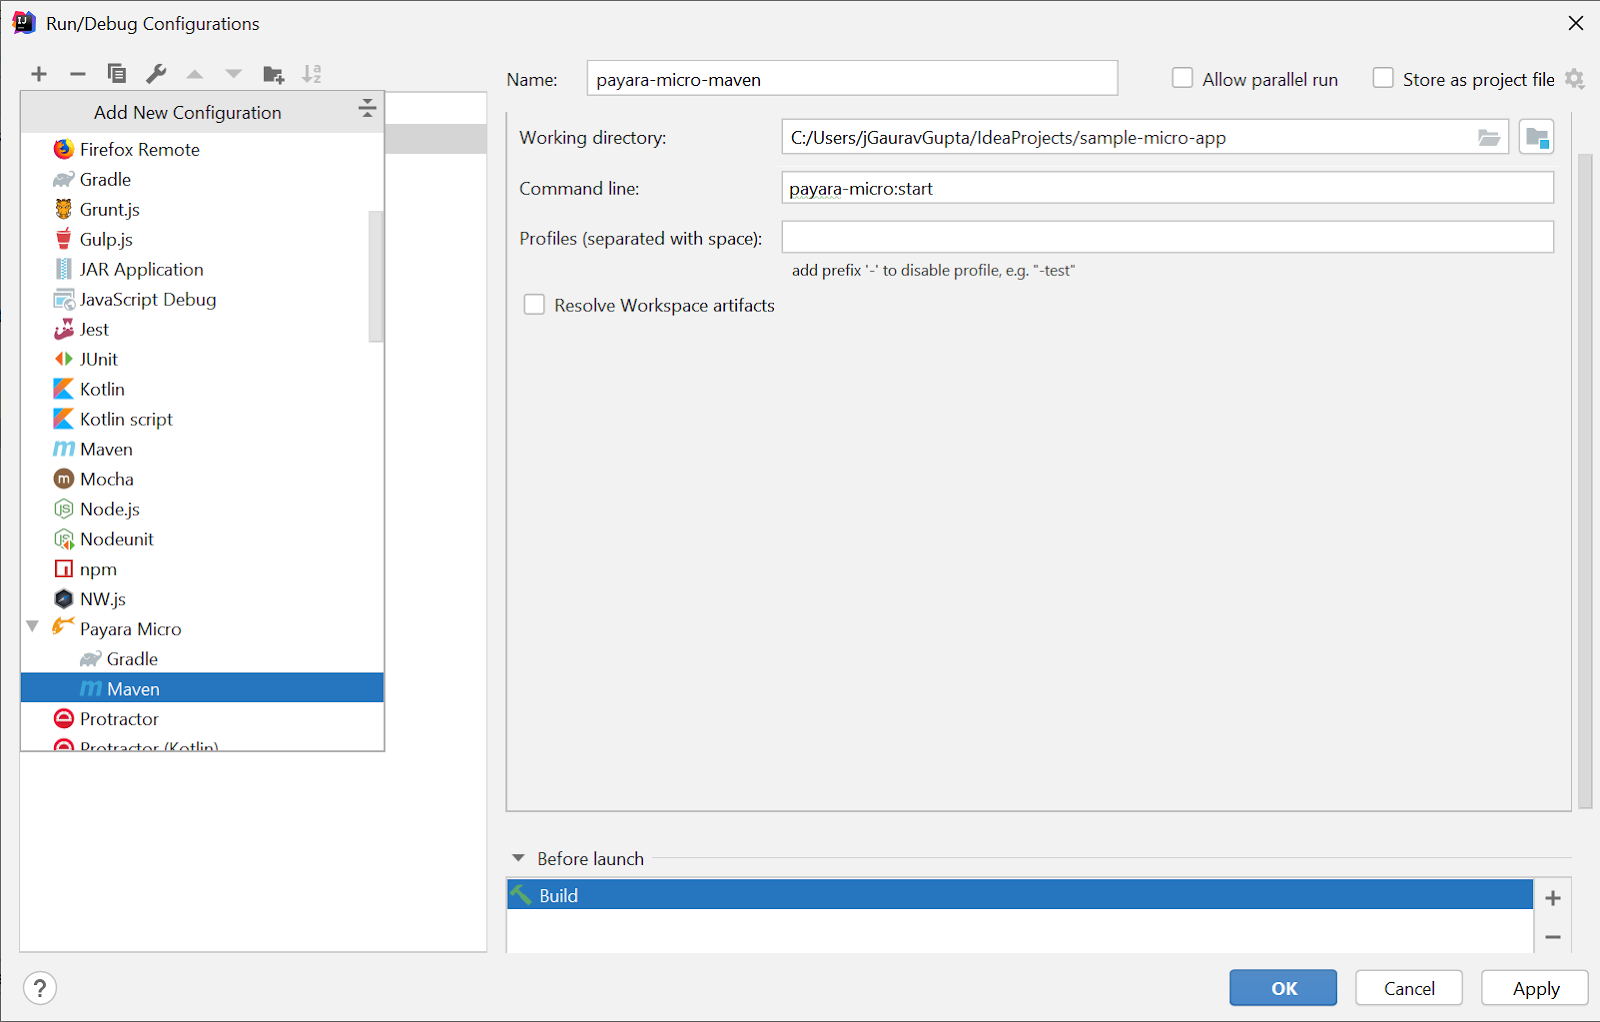
In the Run/Debug Configurations dialog, click +, expand the Payara Micro node, and select Maven:
-
Now add the Before launch tasks and assign a new artifact, click + on the left-hand pane, choose the Build Artifacts type from the drop-down list:
-
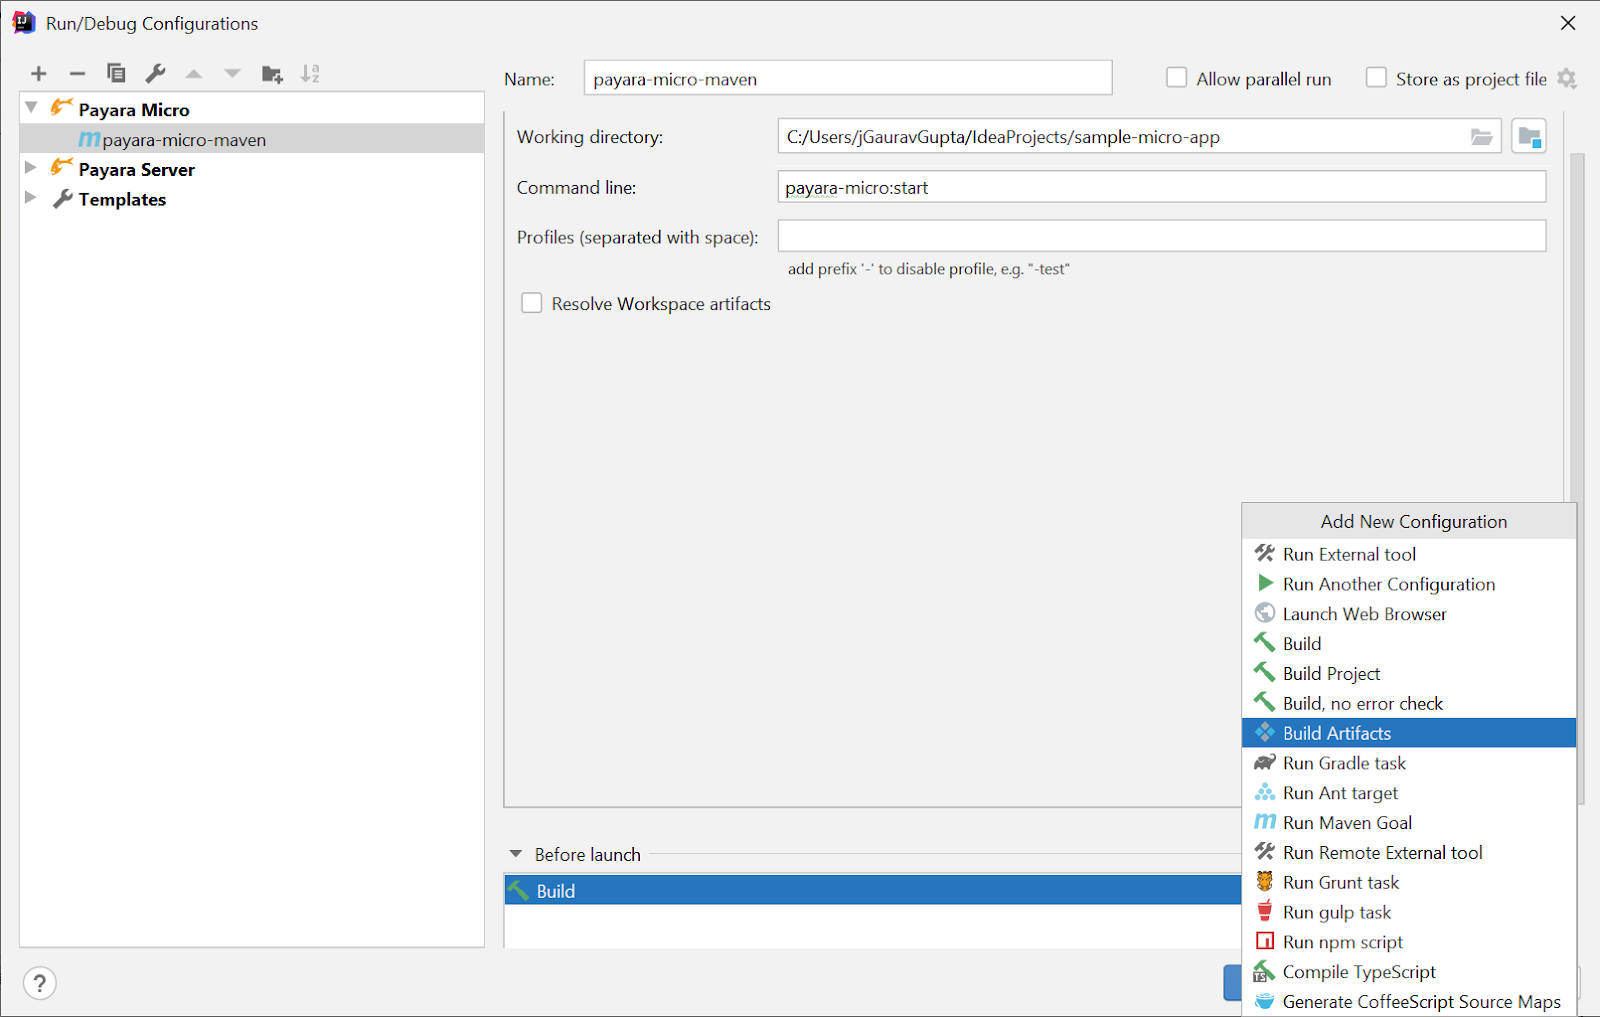
In the Select Artifacts dialog, select to build the sample-micro-app:war artifact:
-
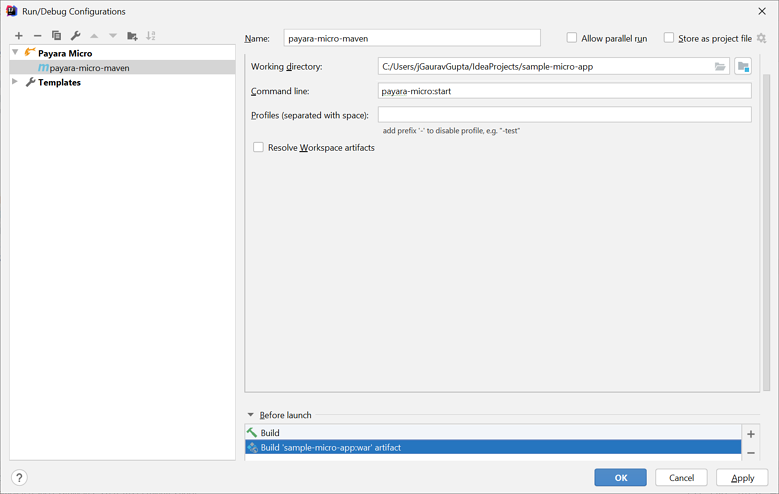
Now save the configuration:
-
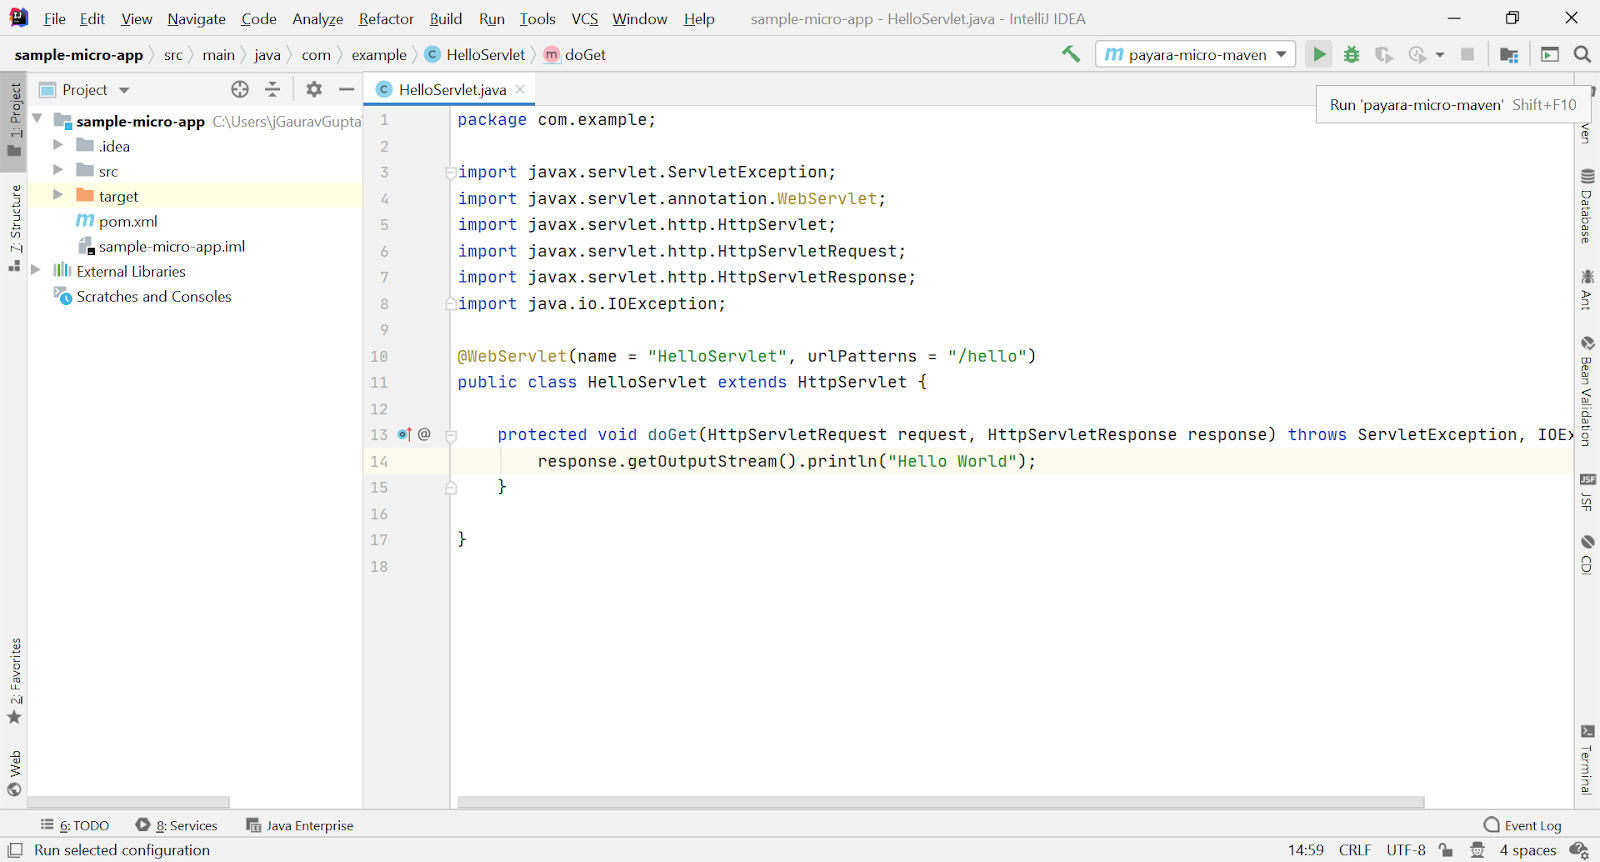
To start the Payara Micro instance, click the run button in the top-right panel:
-
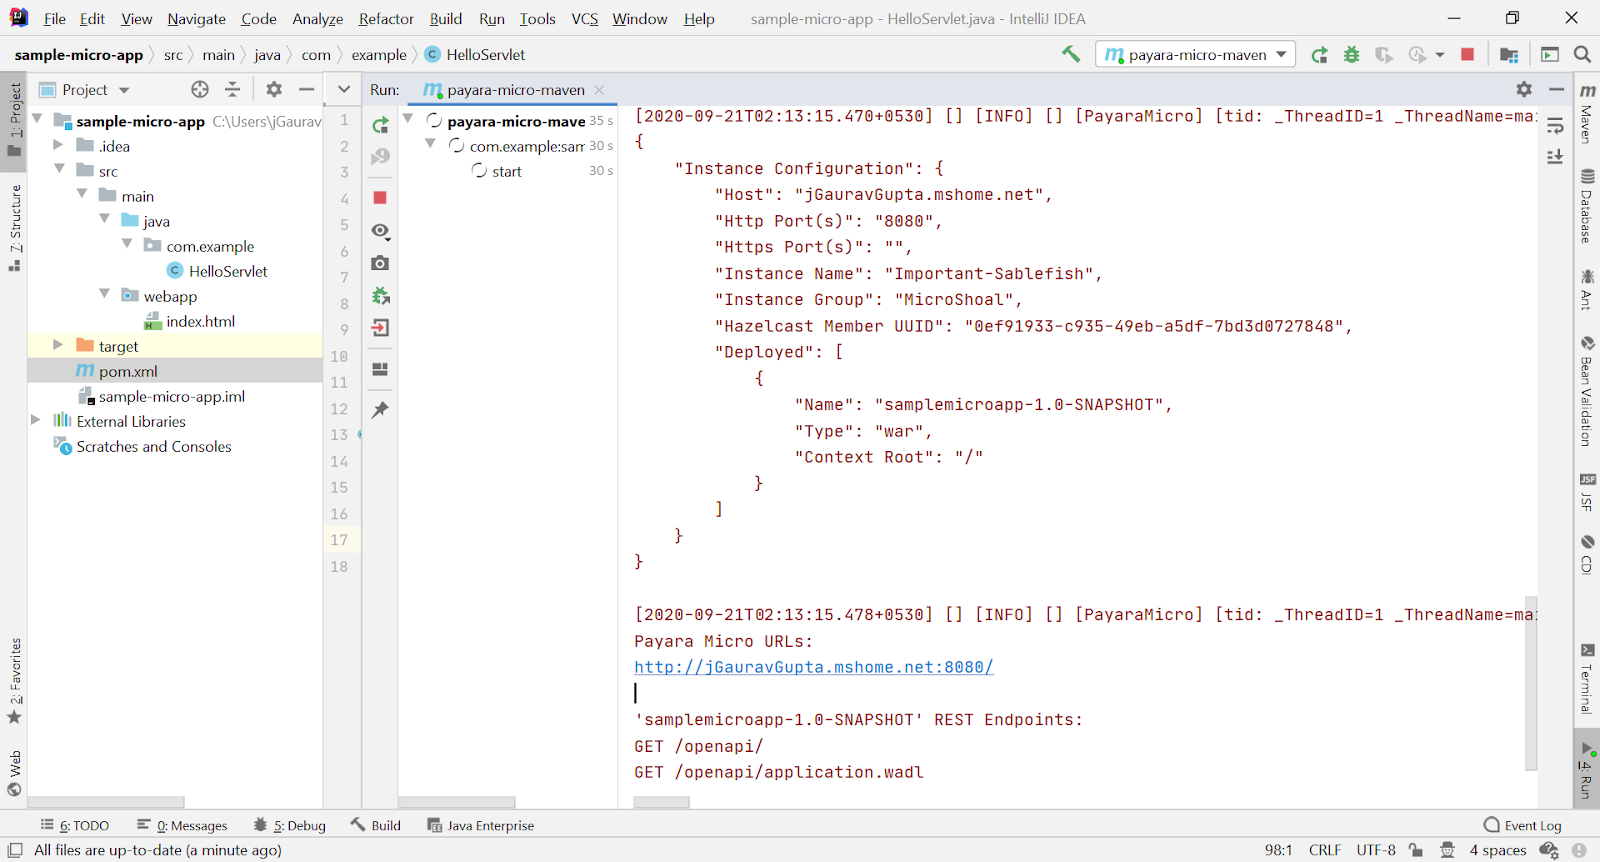
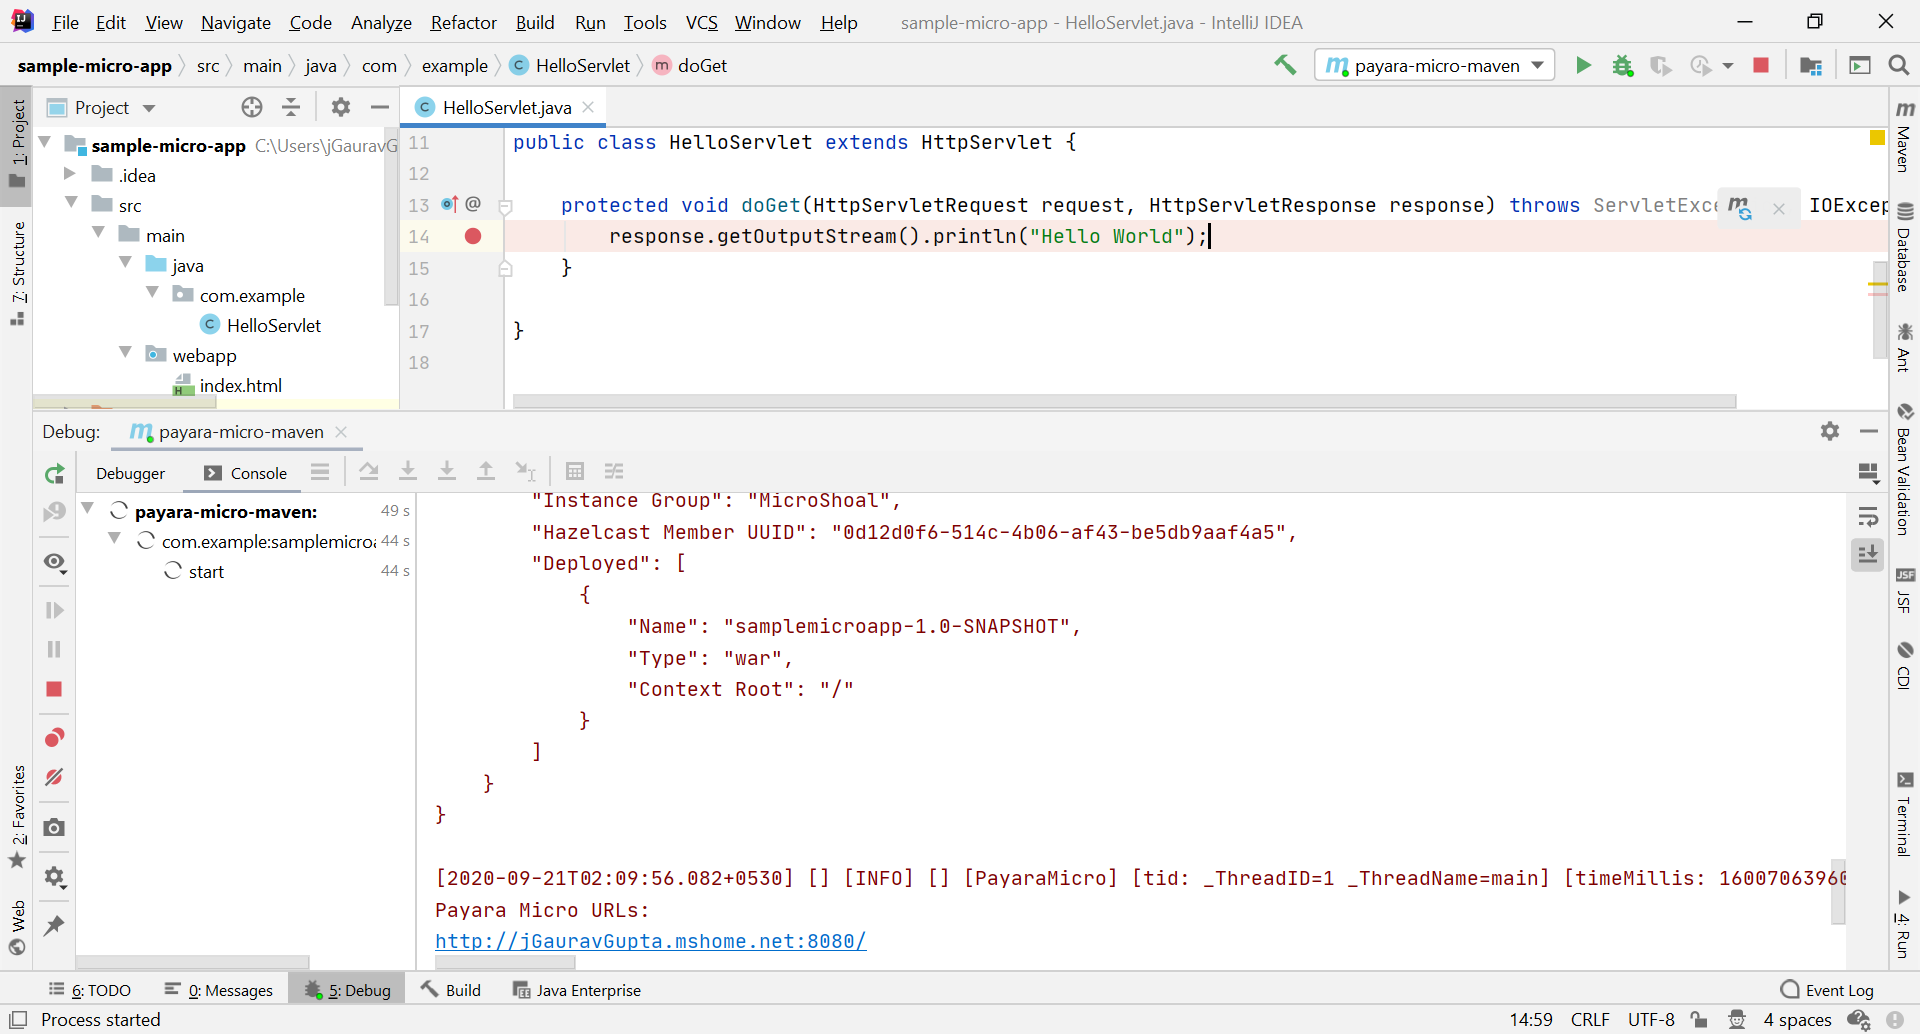
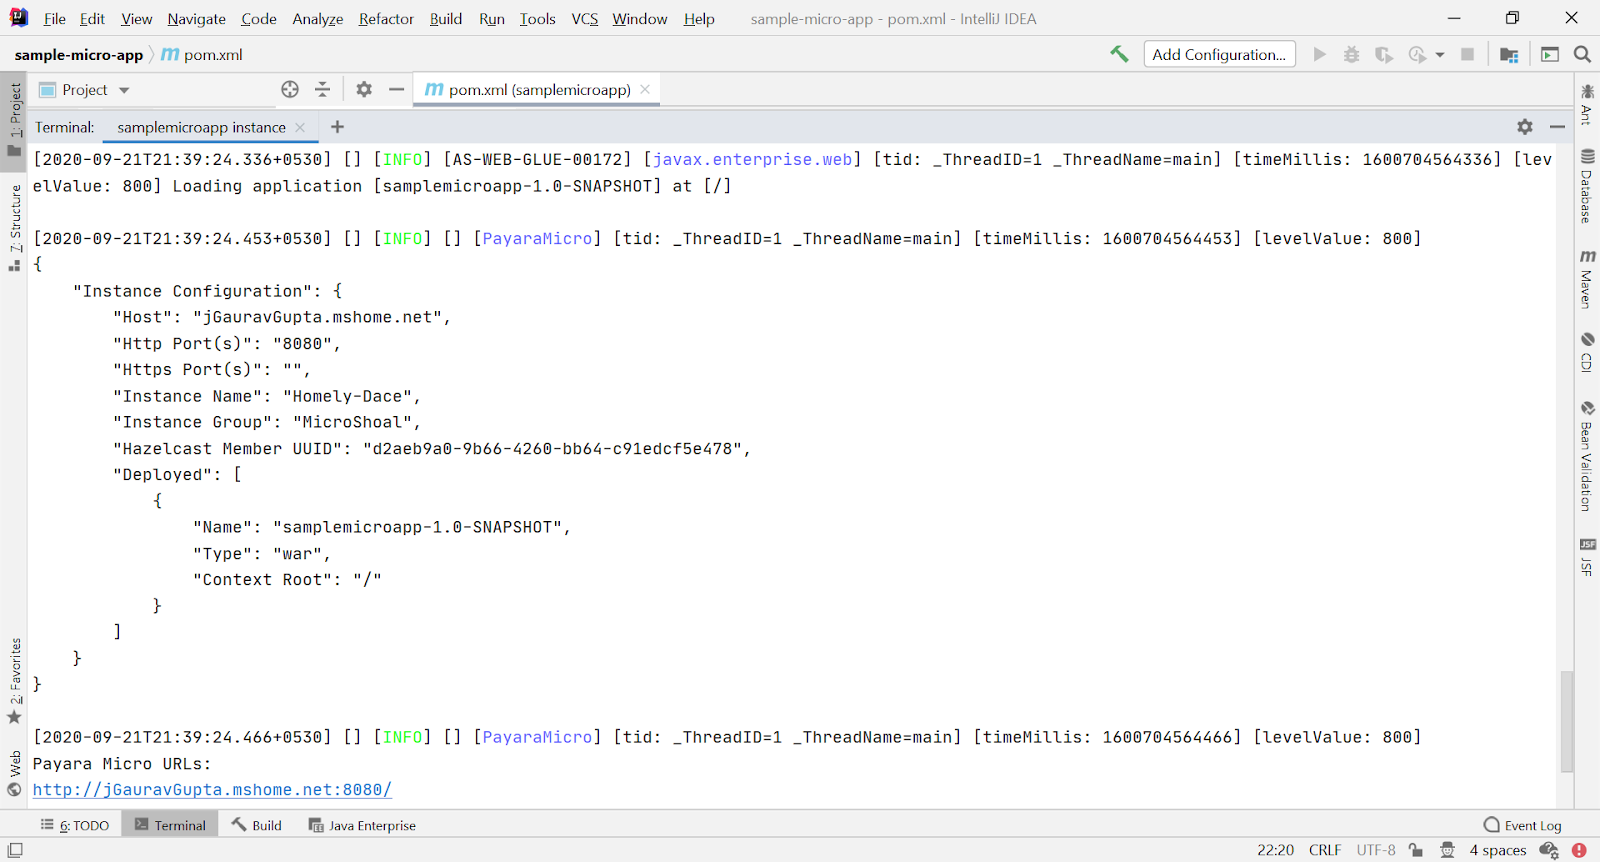
After running the Micro application, you may see the log in the OUTPUT window:
Debugging the Payara Micro Application
-
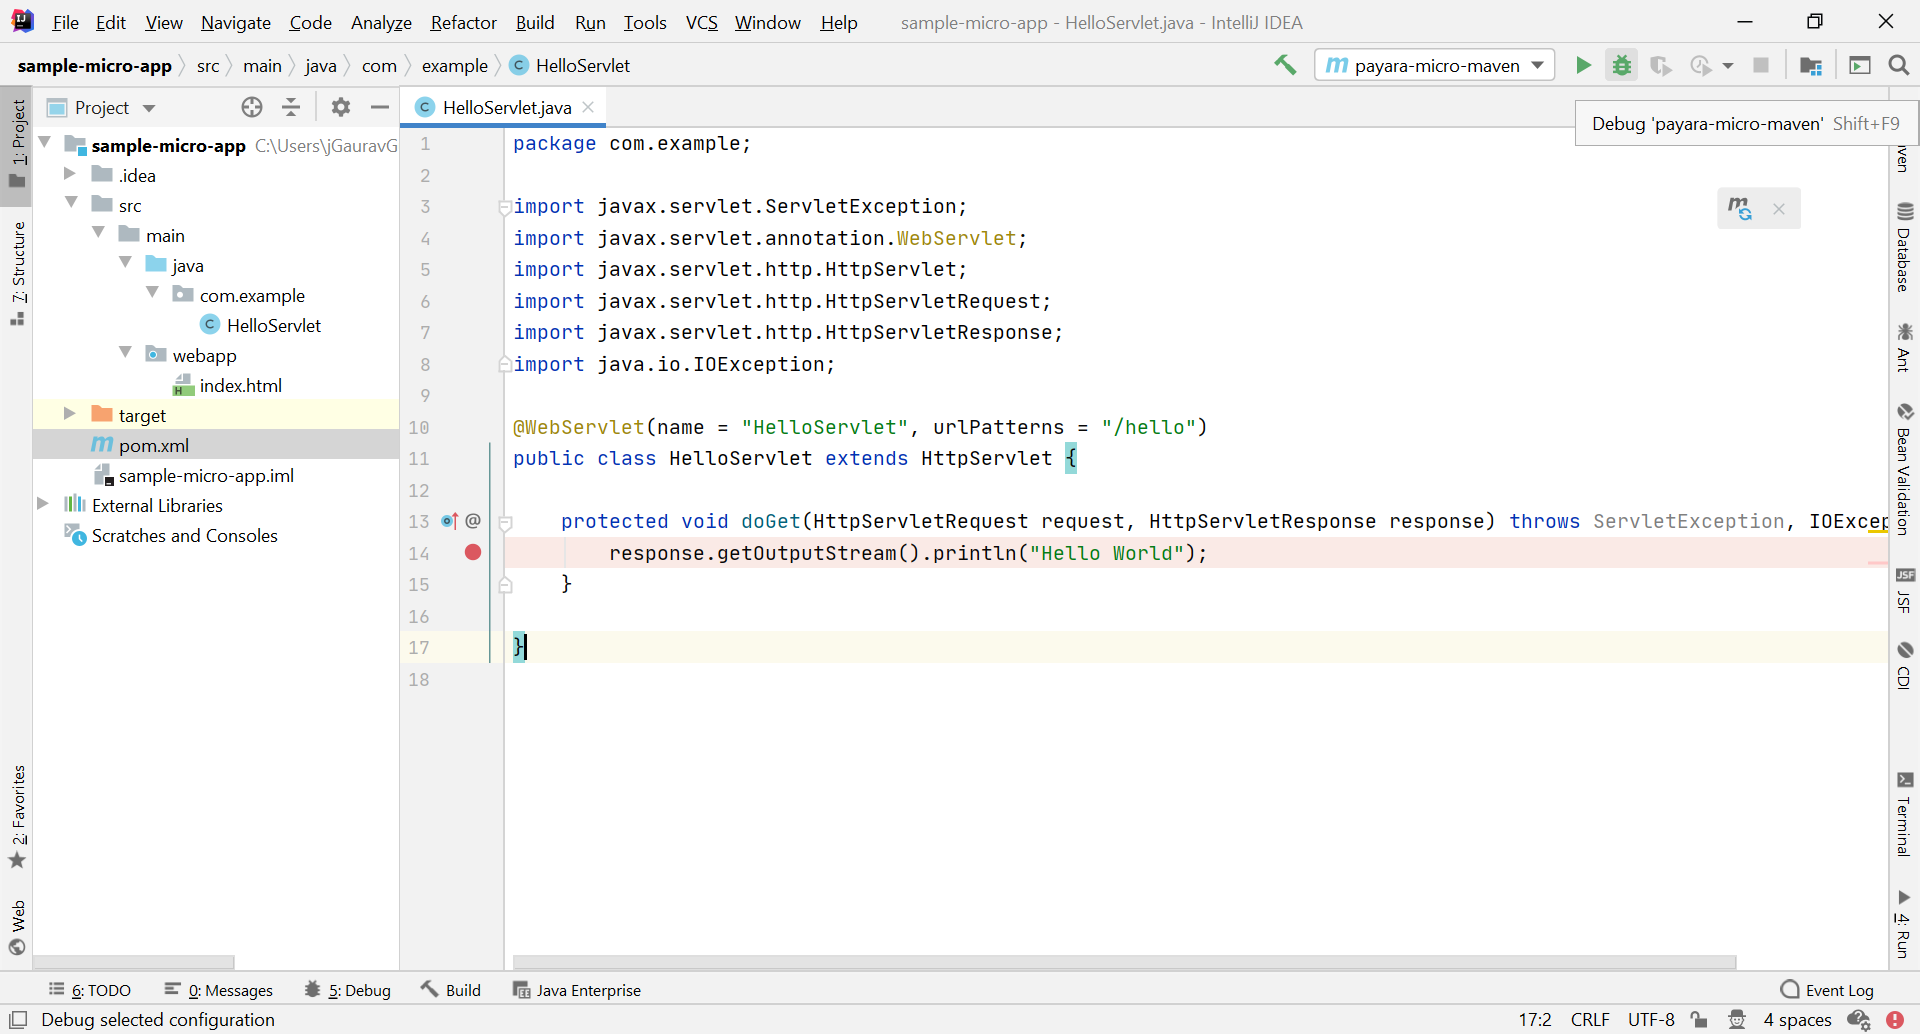
Instead of pressing the Run button, you can instead click Debug from similar locations to automatically start the micro instance and attach the debugger to the application:
-
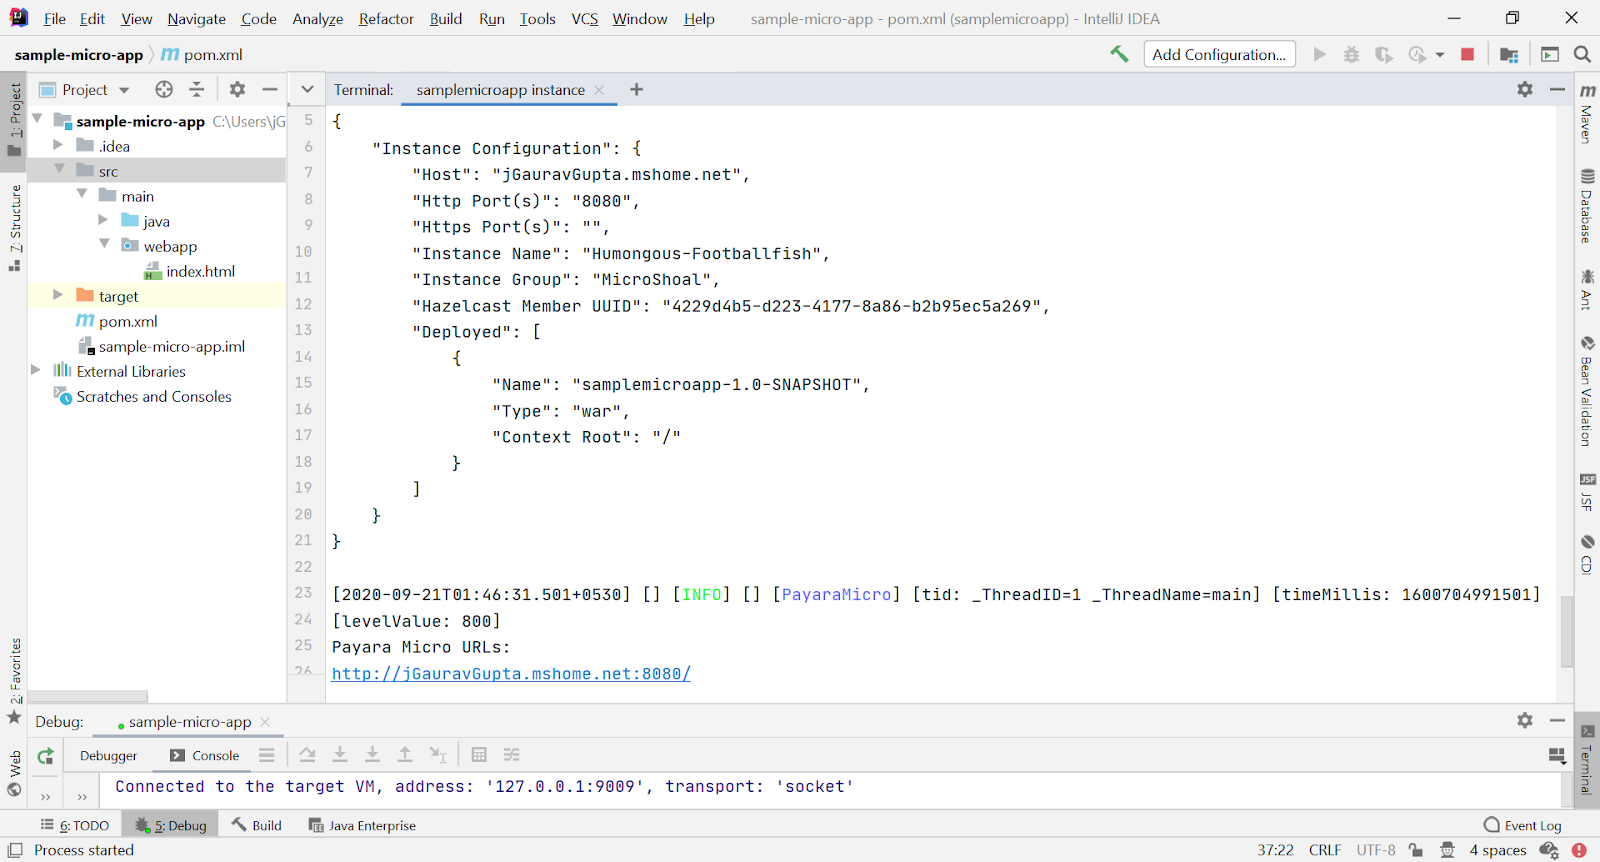
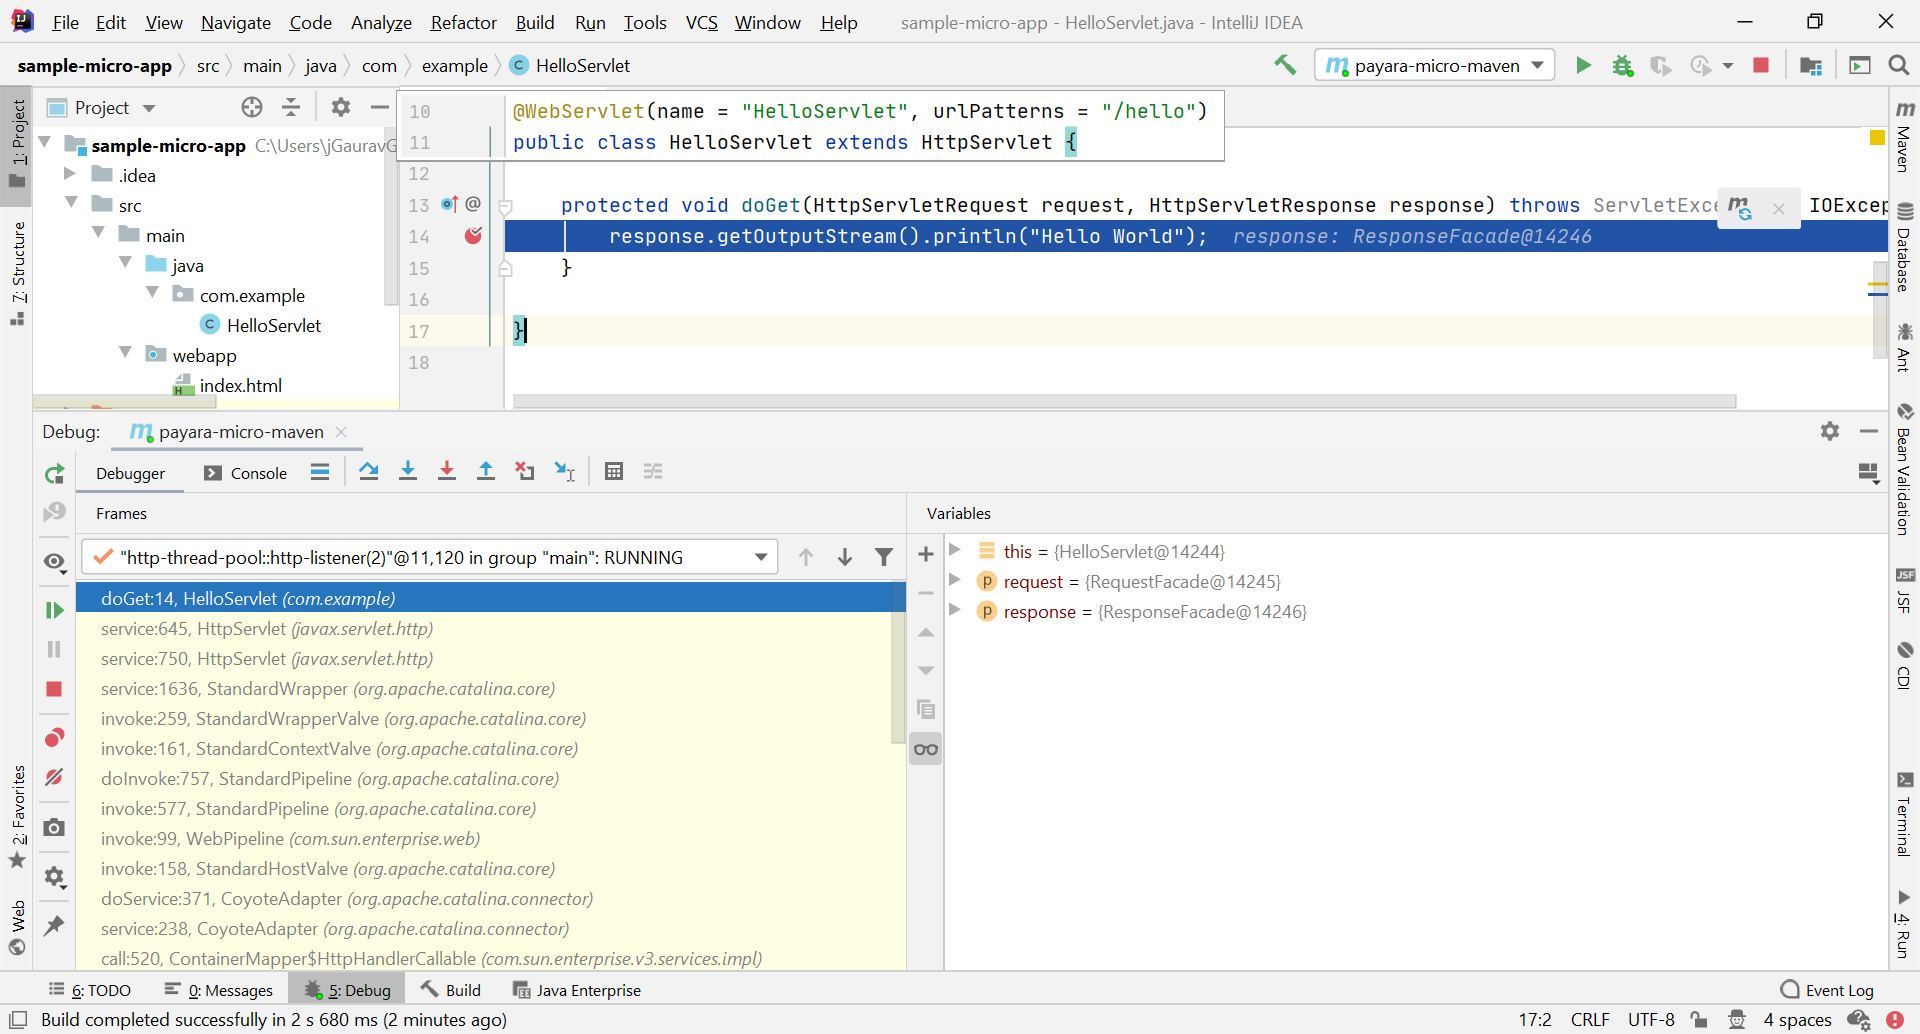
After debugging the Payara Micro application, you may see the log in the Debug > Console window:
-
After the debugger session starts and the application hits the breakpoint, the line where the servlet paused gets highlighted and the Debug tool window appears with the list of running threads and the stack-trace:
Run the Payara Micro Application via actions:
The Payara IntelliJ tools also provide inbuilt actions to manage the Payara Micro application without creating the project configuration, which internally executes Payara Micro Maven/Gradle plugin goals/tasks:
-
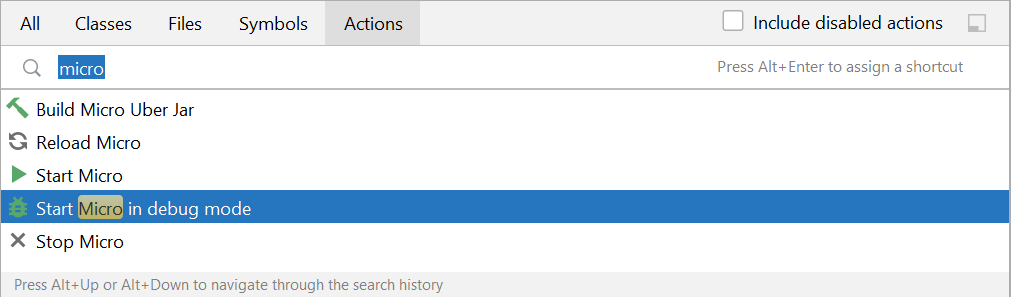
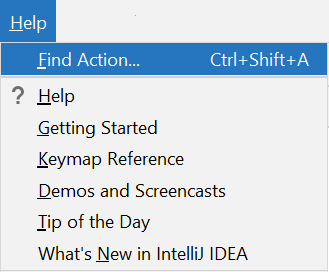
To invoke the actions, Goto Help > Find Action..:
-
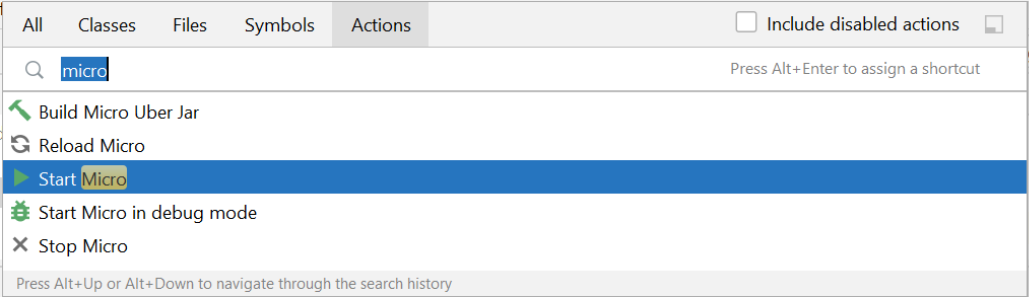
Search the Micro actions and press the enter key:
-
Similarly, you may also debug the Payara Micro application via actions: