Since Payara Server 4.1.1.171
The Java Message Service (JMS) API is a messaging API which can be used to enable asynchronous communication between clients. The Payara JMS notifier makes use of a JMS queue to send notification events from services such as the Request Tracing and HealthCheck services. These can then be consumed by a custom MDB or other JMS compatible client.
Requirements
To use JMS as a notification target, you will need the following:
-
A JMS broker
-
Payara Server Full Profile
| Payara Server Web Profile does not come with native JMS capabilities, so this notifier isn’t supported in it. |
| The easiest way to configure the JMS notifier is to use the embedded OpenMQ broker, since Payara Server Community ships with embedded OpenMQ by default. |
Configuration
Configuration requires the following few steps:
-
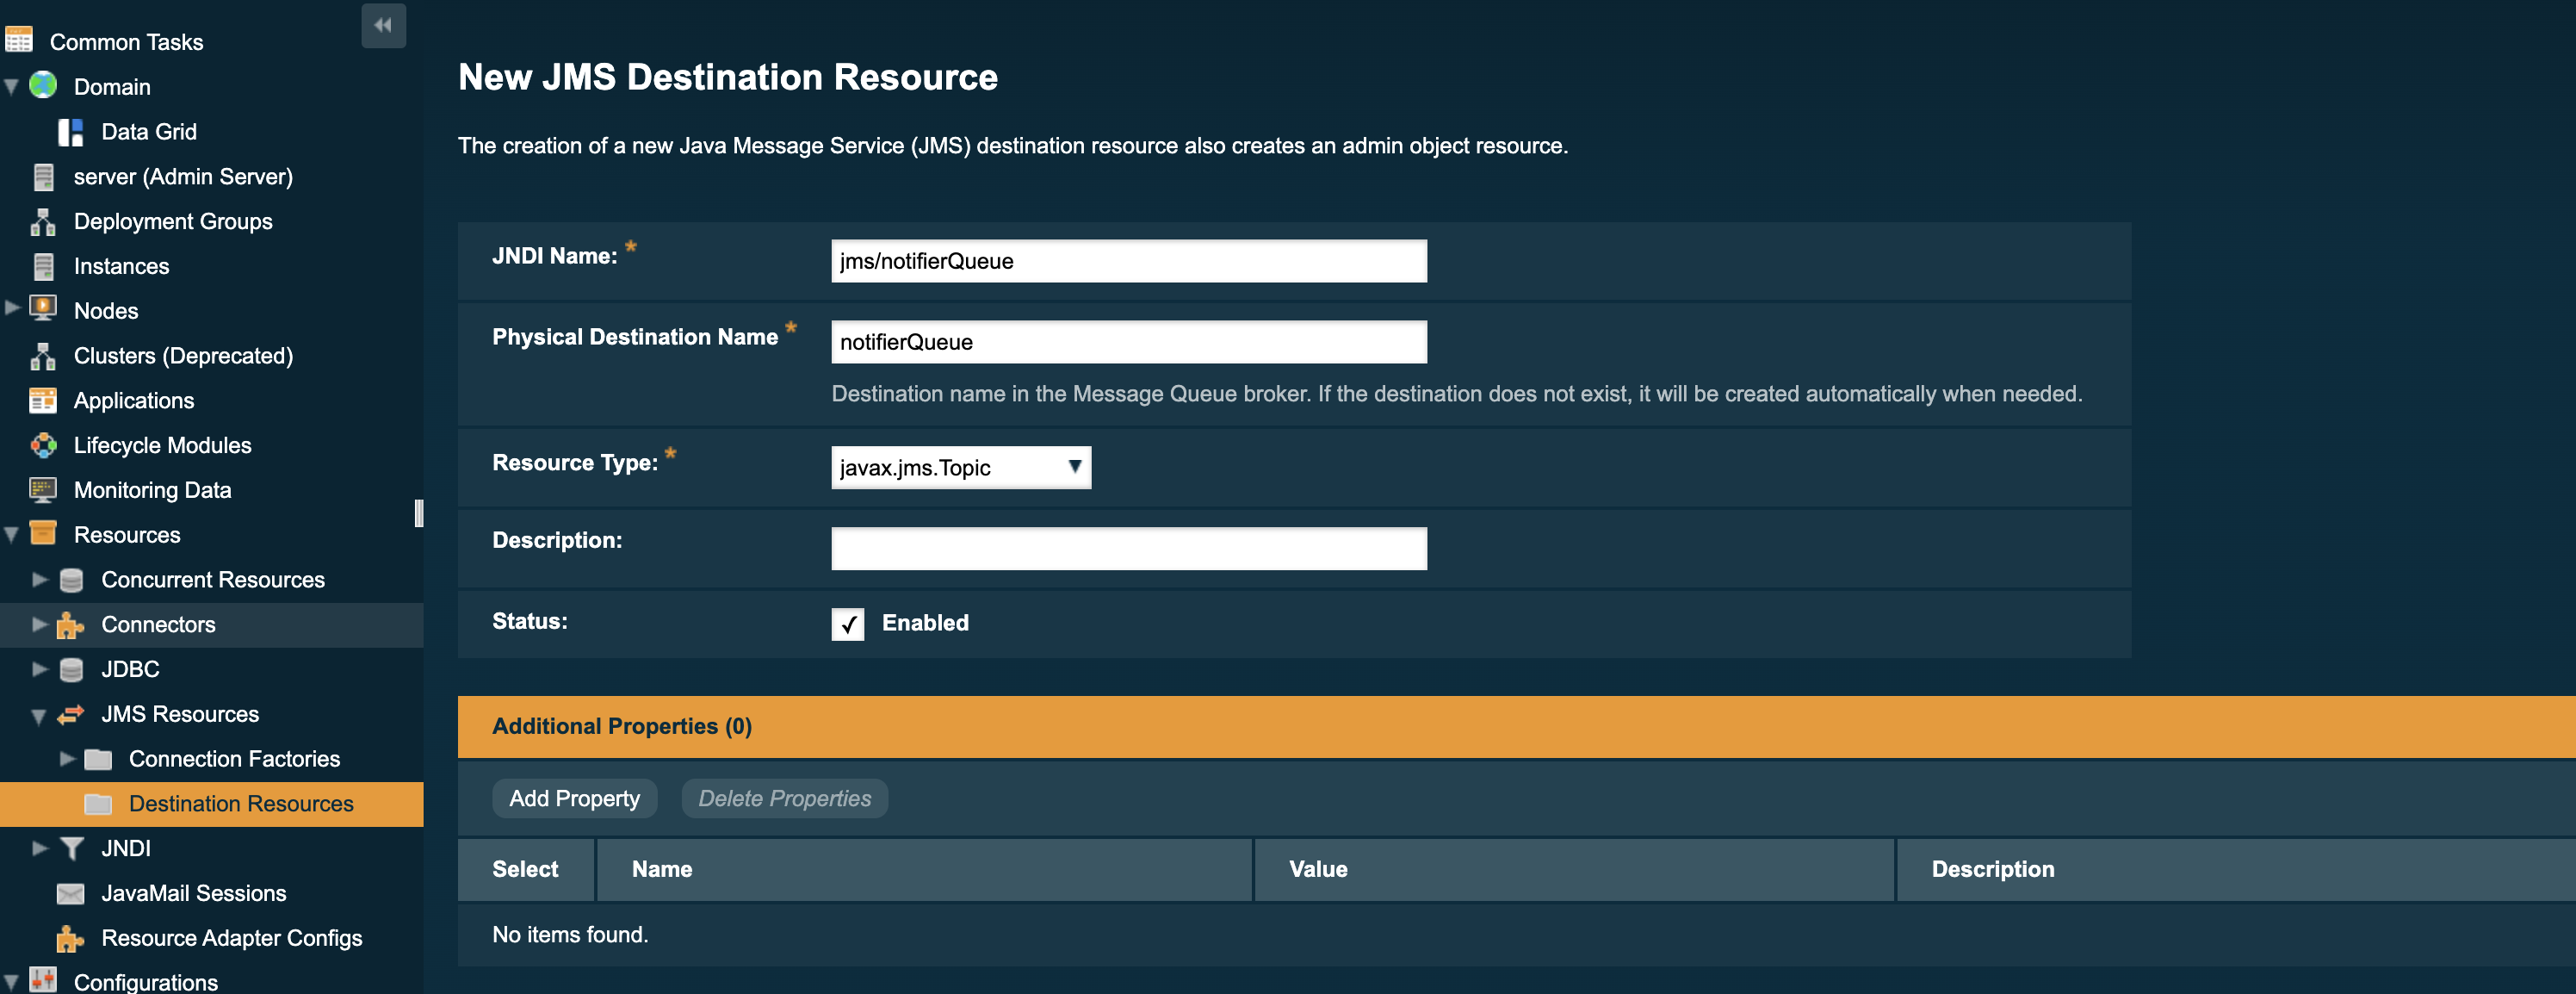
Create a new JMS Queue to receive the notification messages from the notifier:

To make this change via the asadmin tool, use the following command which mirrors the above screenshot:
asadmin create-jms-resource --enabled=true --property=Name=notifierQueue --restype=javax.jms.queue jms/notifierQueue -
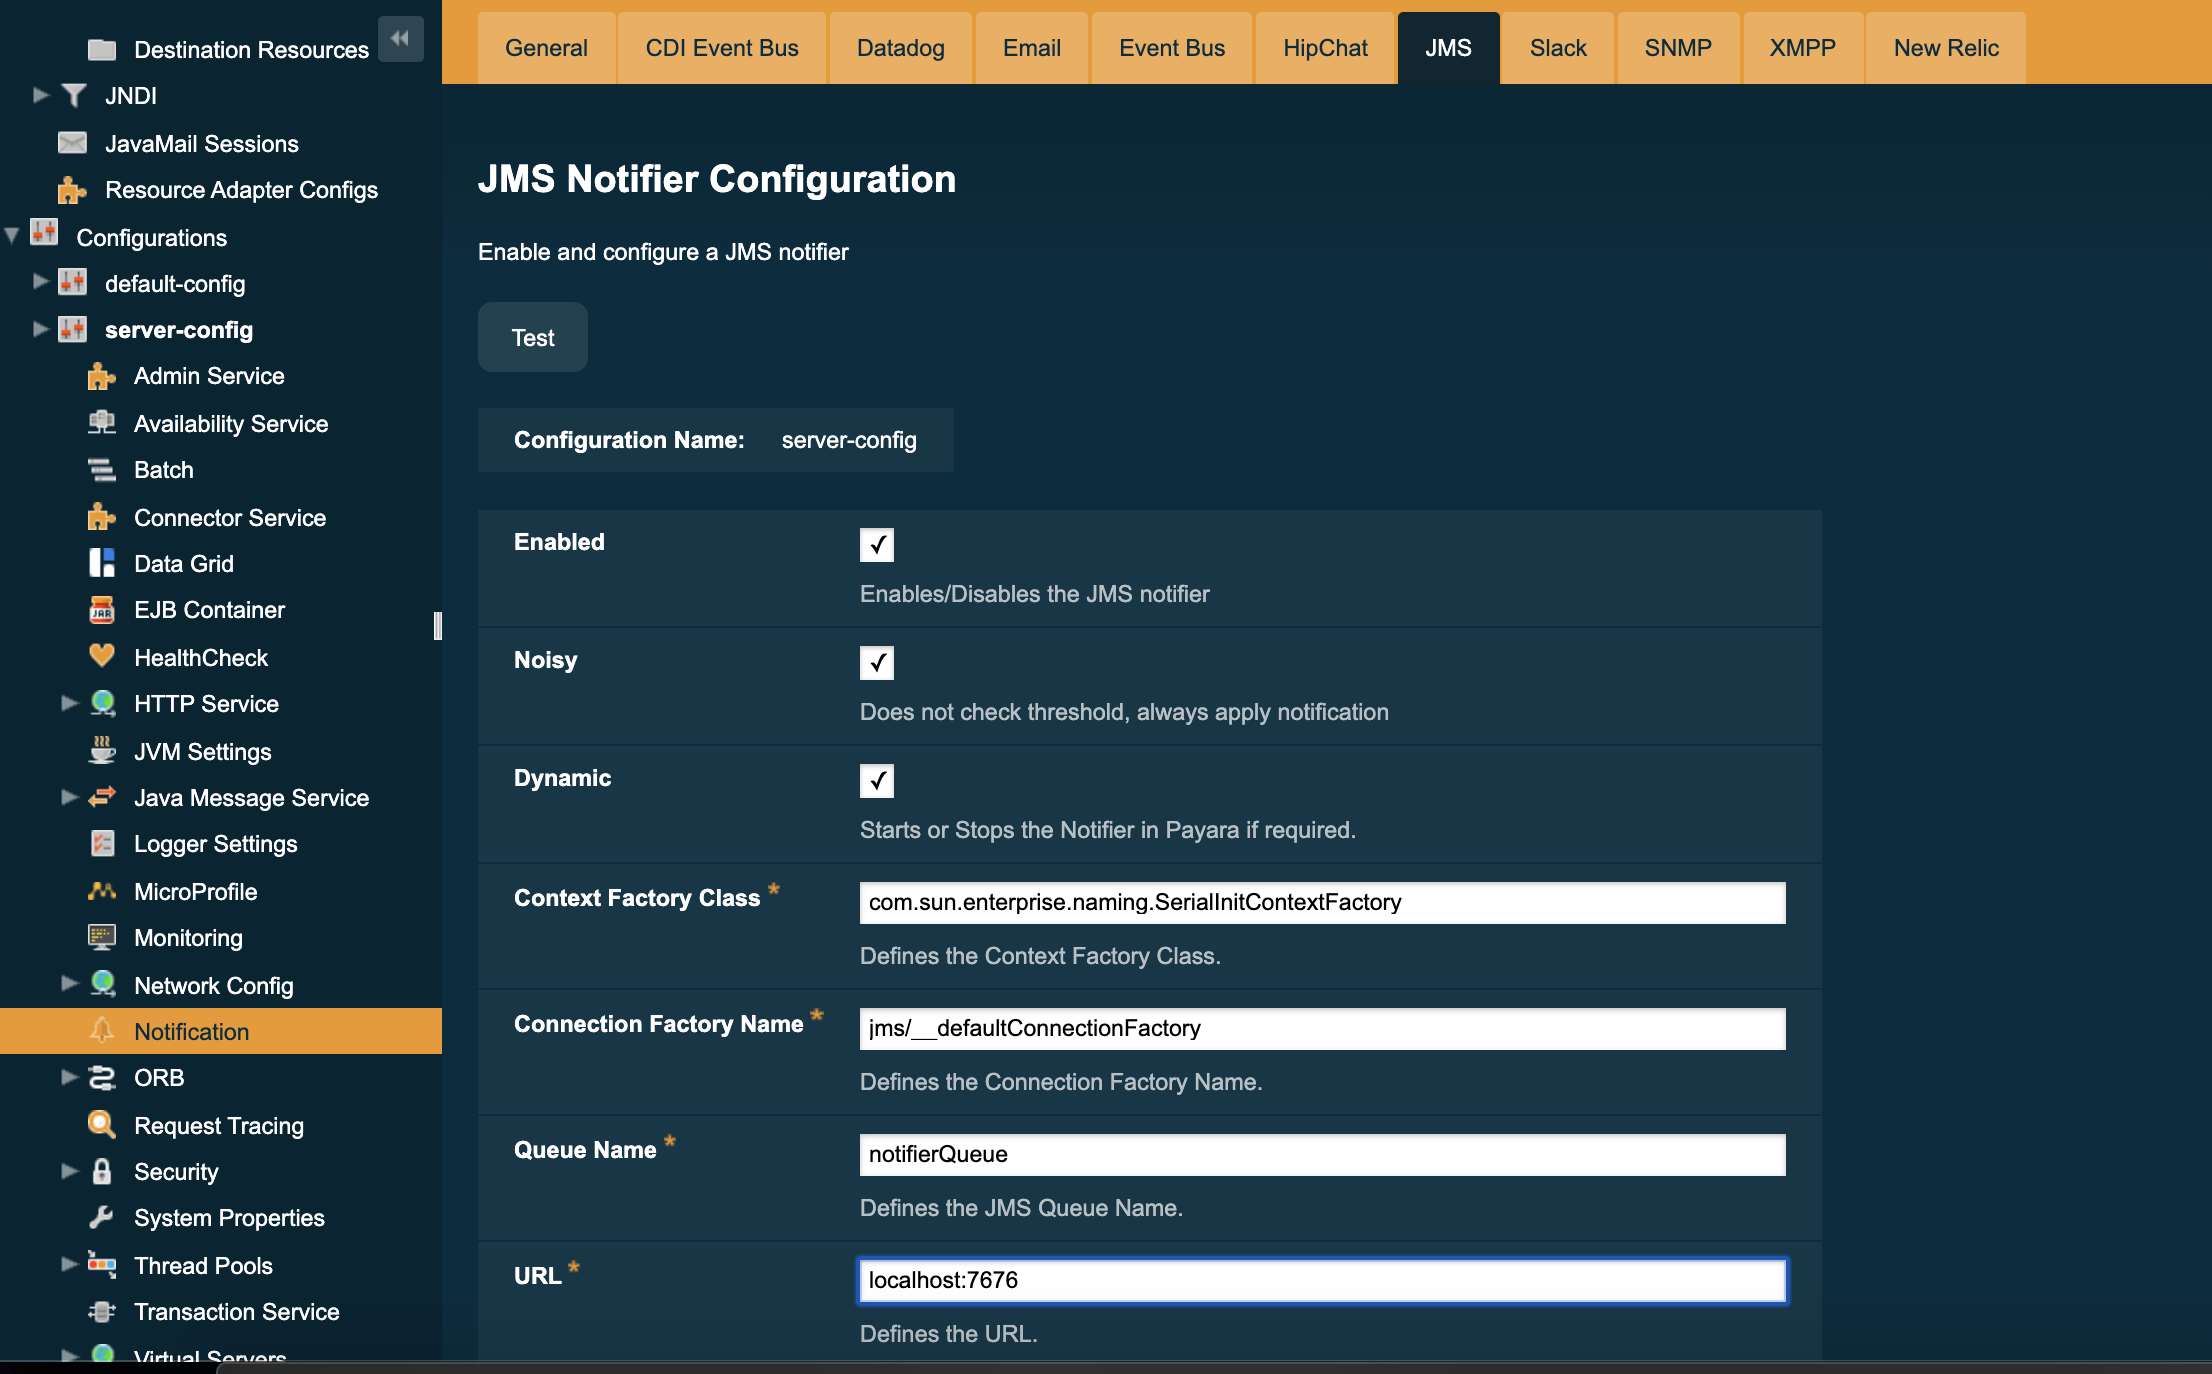
Set the properties for the JMS Notifier:

The above example uses the embedded OpenMQ broker default configuration.
To make this change via the asadmin tool, use the following command which mirrors the above screenshot:
asadmin set-jms-notifier-configuration --dynamic=true --enabled=true --contextFactoryClass=com.sun.enterprise.naming.SerialInitContextFactory --target=server-config --queueName=notifierQueue --url=localhost:7676 --connectionFactoryName=jms/_defaultConnectionFactory
Verify the Configuration
For verification purposes, it may be useful to enable a service to push notifications through the JMS notifier to demonstrate that it is working. To do this, we will also need a Message-Driven Bean (MDB) to consume the notifications and demonstrate that they are being received on the queue.
-
First, enable a service to push data through the notifier. For example, the HealthCheck service’s CPU metric can be configured to push CPU metrics to a notifier every 5 seconds:
asadmin> healthcheck-configure --enabled=true --dynamic=true --enableNotifiers=jms-notifier
asadmin> healthcheck-configure-service --serviceName=healthcheck-cpu --enabled=true --dynamic=true --time=5 --unit=SECONDS
This also configures the healthcheck service to send notifications to the JMS notifier, so these messages will begin to be sent to the configured queue right away.
-
To consume the messages using a JMS 2.0 compliant MDB, the following class will work for a pre-configured queue named
notifierQueue:@MessageDriven(activationConfig = { @ActivationConfigProperty(propertyName = "destinationLookup", propertyValue = "jms/notifierQueue"), @ActivationConfigProperty(propertyName = "destinationType", propertyValue = "javax.jms.Queue"), @ActivationConfigProperty(propertyName = "destination", propertyValue = "notifierQueue"), }) public class NotificationConsumer implements MessageListener { @Override public void onMessage(Message message) { try { System.out.println("Message received: " + message.getBody(String.class)); } catch (JMSException ex) {} } } -
View the result of the MessageDrivenBean’s
onMessage()command. In this example, the CPU metric of the health check service was configured to notify every 5 seconds, so the result of simply printing toSystem.outis following log entries:[2017-02-24T14:25:02.019+0000] [Payara 4.1] [INFO] [] [fish.payara.nucleus.healthcheck.HealthCheckService] [tid: _ThreadID=151 _ThreadName=admin-thread-pool::admin-listener(9)] [timeMillis: 1487946302019] [levelValue: 800] [[ Scheduling Health Check for task: CPUC]] [2017-02-24T14:25:02.019+0000] [Payara 4.1] [INFO] [] [fish.payara.nucleus.healthcheck.HealthCheckService] [tid: _ThreadID=151 _ThreadName=admin-thread-pool::admin-listener(9)] [timeMillis: 1487946302019] [levelValue: 800] [[ Payara Health Check Service Started.]] [2017-02-24T14:25:02.376+0000] [Payara 4.1] [INFO] [] [] [tid: _ThreadID=48 _ThreadName=p: thread-pool-1; w: 3] [timeMillis: 1487946302376] [levelValue: 800] [[ Message received: Health Check notification with severity level: INFO. (host:mike-payara, server:server, domain:domain1,instance:server) CPUC:Health Check Result:[[status=GOOD, message='CPU%: 1.45, Time CPU used: 3 seconds 797 milliseconds'']']]] [2017-02-24T14:25:02.380+0000] [Payara 4.1] [INFO] [] [] [tid: _ThreadID=50 _ThreadName=p: thread-pool-1; w: 5] [timeMillis: 1487946302380] [levelValue: 800] [[ Message received: Health Check notification with severity level: SEVERE. (host:mike-payara, server:server, domain:domain1,instance:server) CPUC:Health Check Result:[[status=CRITICAL, message='CPU%: 109.71, Time CPU used: 7 milliseconds'']']]]
Asadmin Commands
Set the JMS notifier configuration
To set the JMS notifier configuration, the following asadmin command will reflect the configuration done in the previous section:
asadmin> set-jms-notifier-configuration --dynamic=true --enabled=true
  --contextFactoryClass=com.sun.enterprise.naming.SerialInitContextFactory
  --connectionFactoryName=jms/__defaultConnectionFactory
  --queueName=notifierQueue
  --url=localhost:7676
  --username= ****
  --password= ****
  --target=server-config
Get the JMS notifier configuration
To get the current JMS notifier configuration using asadmin, run the following command:
asadmin> get-jms-notifier-configurationIt will return the details of the current JMS notifier configuation, like in the following example:
Enabled  Noisy  Context Factory Class                               Connection Factory Name         Queue Name     URL             Username    Password
true     true   com.sun.enterprise.naming.SerialInitContextFactory  jms/__defaultConnectionFactory  notifierQueue  localhost:7676  myusername  mypassword
Troubleshooting
When you have correctly configured the JMS notifier, it can be used to push notifications to your configured queue. If you do not see any notifications, check the following:
-
Is your MDB or other JMS client correctly configured to consume messages from the correct queue? (e.g. check for typos)
-
Are the JMS queue details correctly entered in the JMS notifier configuration? (check the server.log for errors)
-
Is the JMS queue available? If you have configured your own JMS broker, is it responding? If the broker is remote, check that it is reachable.
-
Is the service using the notifier configured to send notifications frequently enough to observe?
-
Is the service using the notifier correctly configured and also enabled?
