Since Payara Server 4.1.2.181 and 5.181
Provided version of the API: MicroProfile Metrics 1.1
Background
The Metrics API was designed to provide monitoring support for applications as well as the underlying runtime. This is considered separate to health checks which are concerned with a binary status of "healthy" or "unhealthy". In design, the Metrics API has borrowed heavily from DropWizard Metrics, so many of the concepts in the API will be familiar.
For a full overview of the API, review the documentation for the appropriate release.
A key goal of the specification was to provide HTTP endpoints in Prometheus format (as well as JSON). Since the Prometheus Text format is widely used by monitoring products other than Prometheus, this gives a lot of compatibility out-of-the-box.
MicroProfile Metrics 1.1 was released in MicroProfile 1.3
| Version 1.1 of the Metrics specification does not define the behaviour of implementations where multiple applications are deployed to the same container. This limitation will be addressed in a later version of the Metrics specification. |
REST Endpoint
MicroProfile Metrics specifies that all metrics are published at the endpoint /metrics. For both Payara Server and Payara Micro, this means that the endpoint can be found on the HTTP port (default 8080). By visiting these endpoints in a browser, the Prometheus text format can be viewed directly.
Metric Scopes
The Metrics specification defines three Scopes, Base, Vendor and Application which correspond to the following purposes:
- Base
-
Base metrics are mandatory for all implementations to provide. This is so that there is a predictable baseline of metrics which will be available on any MicroProfile implementation.
These metrics can be accessed under
/metrics/base. - Vendor
-
Vendor metrics are specific to each implementation and are intended to offer metrics which are unique to each vendor.
These metrics can be accessed under
/metrics/vendor. - Application
-
Application metrics are reserved for those metrics which are to be exposed from the application by using the developer API.
These metrics can be accessed under
/metrics/application.
Custom Vendor Metrics
JMX Mbeans can be exposed as Custom Vendor Metrics by the user by supplying a custom metrics.xml file in the ${PAYARA_HOME}/glassfish/domains/${DOMAIN_NAME}/config/ folder with the following format:
<config>
    <base>
        ...
    </base>
    <vendor>
        <!--sample metadata-->
        <metadata>
            <name>system.cpu.load</name>
            <mbean>java.lang:type=OperatingSystem/SystemCpuLoad</mbean>
            <type>gauge</type>
            <unit>none</unit>
            <displayName>System CPU Load</displayName>
            <description>Recent CPU usage for the whole system.</description>
        </metadata>
    </vendor>
</config>| Payara Server has a more extensive range of MBeans available than Payara Micro, but these AMX MBeans need to be enabled through the Monitoring section of the admin console before they will be usable. Each of these AMX MBeans are also lazily loaded so, for example, JDBC connection pool MBeans will not be visible until an application that uses the connection pool is deployed. |
Templating Metrics for AMX MBeans
Since Payara Server 4.1.2.182 and 5.182
It is possible to create a template for a metric based on AMX MBeans properties for multiple resource configurations or similar objects (like JDBC connection pools for example).
Simple Templating
You can use the %s placeholder to define a template in the metadata definition of the metric using the mbean element. The server will look for all MBeans that match the expression defined and will generate metrics for each one of them.
You will need to use the %s placeholder in the name element as well to allow each metric to have a different name and avoid collisions.
|
Example
Here’s a simple example of defining a custom metric definition template that will generate metrics for the number of free connections available to all JDBC connections pools:
<metadata>
     <name>jdbc.connection.pool.%sPool.numconnfree</name>
     <mbean>amx:pp=/mon/server-mon[server],type=jdbc-connection-pool-mon,name=resources/%sPool/numconnfree#current</mbean>
     <type>counter</type>
     <unit>none</unit>
     <displayName>numconnfreePool</displayName>
     <description>The total number of free connections in the pool as of the last sampling.</description>
</metadata>
Which will yield the following results:
# TYPE vendor:jdbc_connection_pool_resources/_timer_pool_pool_numconnfree counter
# HELP vendor:jdbc_connection_pool_resources/_timer_pool_pool_numconnfree The total number of free connections in the pool as of the last sampling.
vendor:jdbc_connection_pool_resources/_timer_pool_pool_numconnfree 0
# TYPE vendor:jdbc_connection_pool_resources/_derby_pool_pool_numconnfree counter
# HELP vendor:jdbc_connection_pool_resources/_derby_pool_pool_numconnfree The total number of free connections in the pool as of the last sampling.
vendor:jdbc_connection_pool_resources/_derby_pool_pool_numconnfree 0
# TYPE vendor:jdbc_connection_pool_resources/_h2_pool_pool_numconnfree counter
# HELP vendor:jdbc_connection_pool_resources/_h2_pool_pool_numconnfree The total number of free connections in the pool as of the last sampling.
vendor:jdbc_connection_pool_resources/_h2_pool_pool_numconnfree 0
Advanced Templating
Since Payara Server 4.1.2.184 and 5.184
If you need more control on the attributes of specific MBeans used in a metric definition, you can use the ${key}, ${attribute} and ${subattribute} placeholders to define more fine-grained metrics.
These placeholders are used as follow:
key-
Used as a placeholder of the name (or part of the name) of an AMX MBean.
attribute-
Used as a placeholder for the name of an attribute of an AMX MBean.
subattribute-
Used as a placeholder for the name of a sub-attribute (or second-level attribute), which corresponds to the attribute of a
CompositeDataobject.
You will need to use the ${key}, ${attribute} and ${subattribute} placeholders in the name element as well to prevent name collisions between different templated metrics.
|
Example
Here’s an example of defining a custom metric definition template with these placeholders that will generate a counter metric for each specific connection metric that is available to all JDBC connection pools:
<metadata>
     <name>jdbc.connection.pool.${key}Pool.${attribute}#${subattribute}</name>
     <mbean>amx:pp=/mon/server-mon[server],type=jdbc-connection-pool-mon,name=resources/${key}Pool/${attribute}#${subattribute}</mbean>
     <type>counter</type>
     <unit>none</unit>
</metadata>
Which will yield the following results:
# TYPE vendor:jdbc_connection_pool_resources/_derby_pool_pool_numconnsuccessfullymatched#start_time counter
vendor:jdbc_connection_pool_resources/_derby_pool_pool_numconnsuccessfullymatched#start_time 1540463722554
# TYPE vendor:jdbc_connection_pool_resources/_derby_pool_pool_numconncreated#count counter
vendor:jdbc_connection_pool_resources/_derby_pool_pool_numconncreated#count 0
# TYPE vendor:jdbc_connection_pool_resources/_derby_pool_pool_connrequestwaittime#last_sample_time counter
vendor:jdbc_connection_pool_resources/_derby_pool_pool_connrequestwaittime#last_sample_time -1
# TYPE vendor:jdbc_connection_pool_resources/_derby_pool_pool_numconnused#start_time counter
vendor:jdbc_connection_pool_resources/_derby_pool_pool_numconnused#start_time 1540463106138
# TYPE vendor:jdbc_connection_pool_resources/_derby_pool_pool_numconnused#last_sample_time counter
vendor:jdbc_connection_pool_resources/_derby_pool_pool_numconnused#last_sample_time 1540463722554
# TYPE vendor:jdbc_connection_pool_resources/_derby_pool_pool_numconntimedout#start_time counter
vendor:jdbc_connection_pool_resources/_derby_pool_pool_numconntimedout#start_time 1540463722554
# TYPE vendor:jdbc_connection_pool_resources/_derby_pool_pool_connrequestwaittime#start_time counter
vendor:jdbc_connection_pool_resources/_derby_pool_pool_connrequestwaittime#start_time 1540463722554
# TYPE vendor:jdbc_connection_pool_resources/_derby_pool_pool_numconnfree#start_time counter
vendor:jdbc_connection_pool_resources/_derby_pool_pool_numconnfree#start_time 1540463106138
# TYPE vendor:jdbc_connection_pool_resources/_derby_pool_pool_numconnfailedvalidation#count counter
vendor:jdbc_connection_pool_resources/_derby_pool_pool_numconnfailedvalidation#count 0
......
# TYPE vendor:jdbc_connection_pool_resources/_h2_pool_pool_numconnsuccessfullymatched#start_time counter
vendor:jdbc_connection_pool_resources/_h2_pool_pool_numconnsuccessfullymatched#start_time 1540463722554
# TYPE vendor:jdbc_connection_pool_resources/_h2_pool_pool_numconncreated#count counter
vendor:jdbc_connection_pool_resources/_h2_pool_pool_numconncreated#count 0
......
......
Metrics Configuration
Metrics can be configured by using Admin Console or Asadmin commands.
Since Payara Platform 5.183
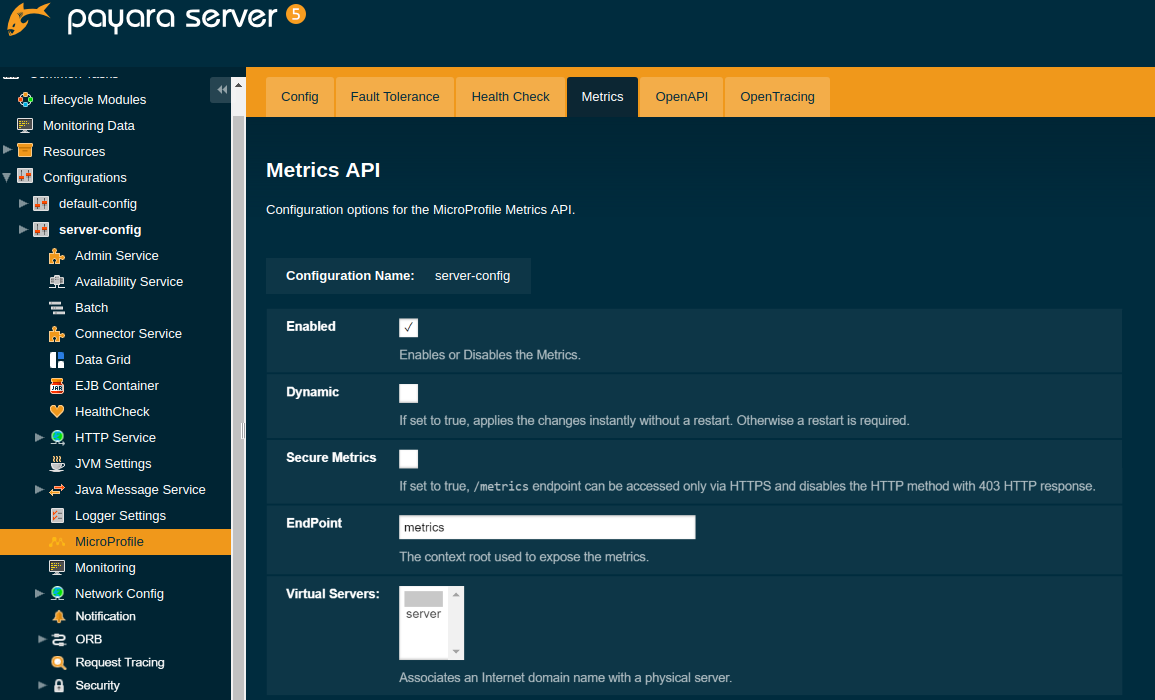
Using the Admin Console
To configure the Metrics in the Admin Console, go to Configuration → [instance-configuration (like server-config)] → MicroProfile → Metrics:
Using Asadmin Commands
set-metrics-configuration
- Usage
-
asadmin> set-metrics-configuration [--enabled=true|false] [--securemetrics=true|false] [--dynamic=true|false] [--target <instance-name>] - Aim
-
Provides a way to set the configuration of the metrics service of the targeted config.
Command Options
| Option | Type | Description | Default | Mandatory |
|---|---|---|---|---|
|
Boolean |
Enables or disables the metrics service. |
true |
No |
|
String |
The context root used to expose the metrics endpoint. |
|
No |
|
Boolean |
If set to |
false |
No |
|
Boolean |
If set to |
true |
No |
|
String |
The target server/instance configuration. |
|
No |
|
String |
If defined, the endpoint will be assigned to a list of virtual servers specified as a comma-separated list of names. Otherwise, the endpoint will be assigned to all virtual servers available. Since Payara Server 4.1.2.184 and 5.184 |
- |
No |
get-metrics-configuration
- Usage
-
asadmin> get-metrics-configuration [--target <instance-name>] - Aim
-
Returns the current configuration options for the metrics service on the targeted configuration.