Payara Server provides capabilities for monitoring its runtime environment. The Monitoring Service can be used to collect statistics of a running server instance. This information is critical for discovering possible issues, troubleshooting, improving performance and making sure everything is running as excepted.
Configuring Monitoring Service
The following mechanisms are available to configure the Monitoring Service settings.
Using the Administration Console
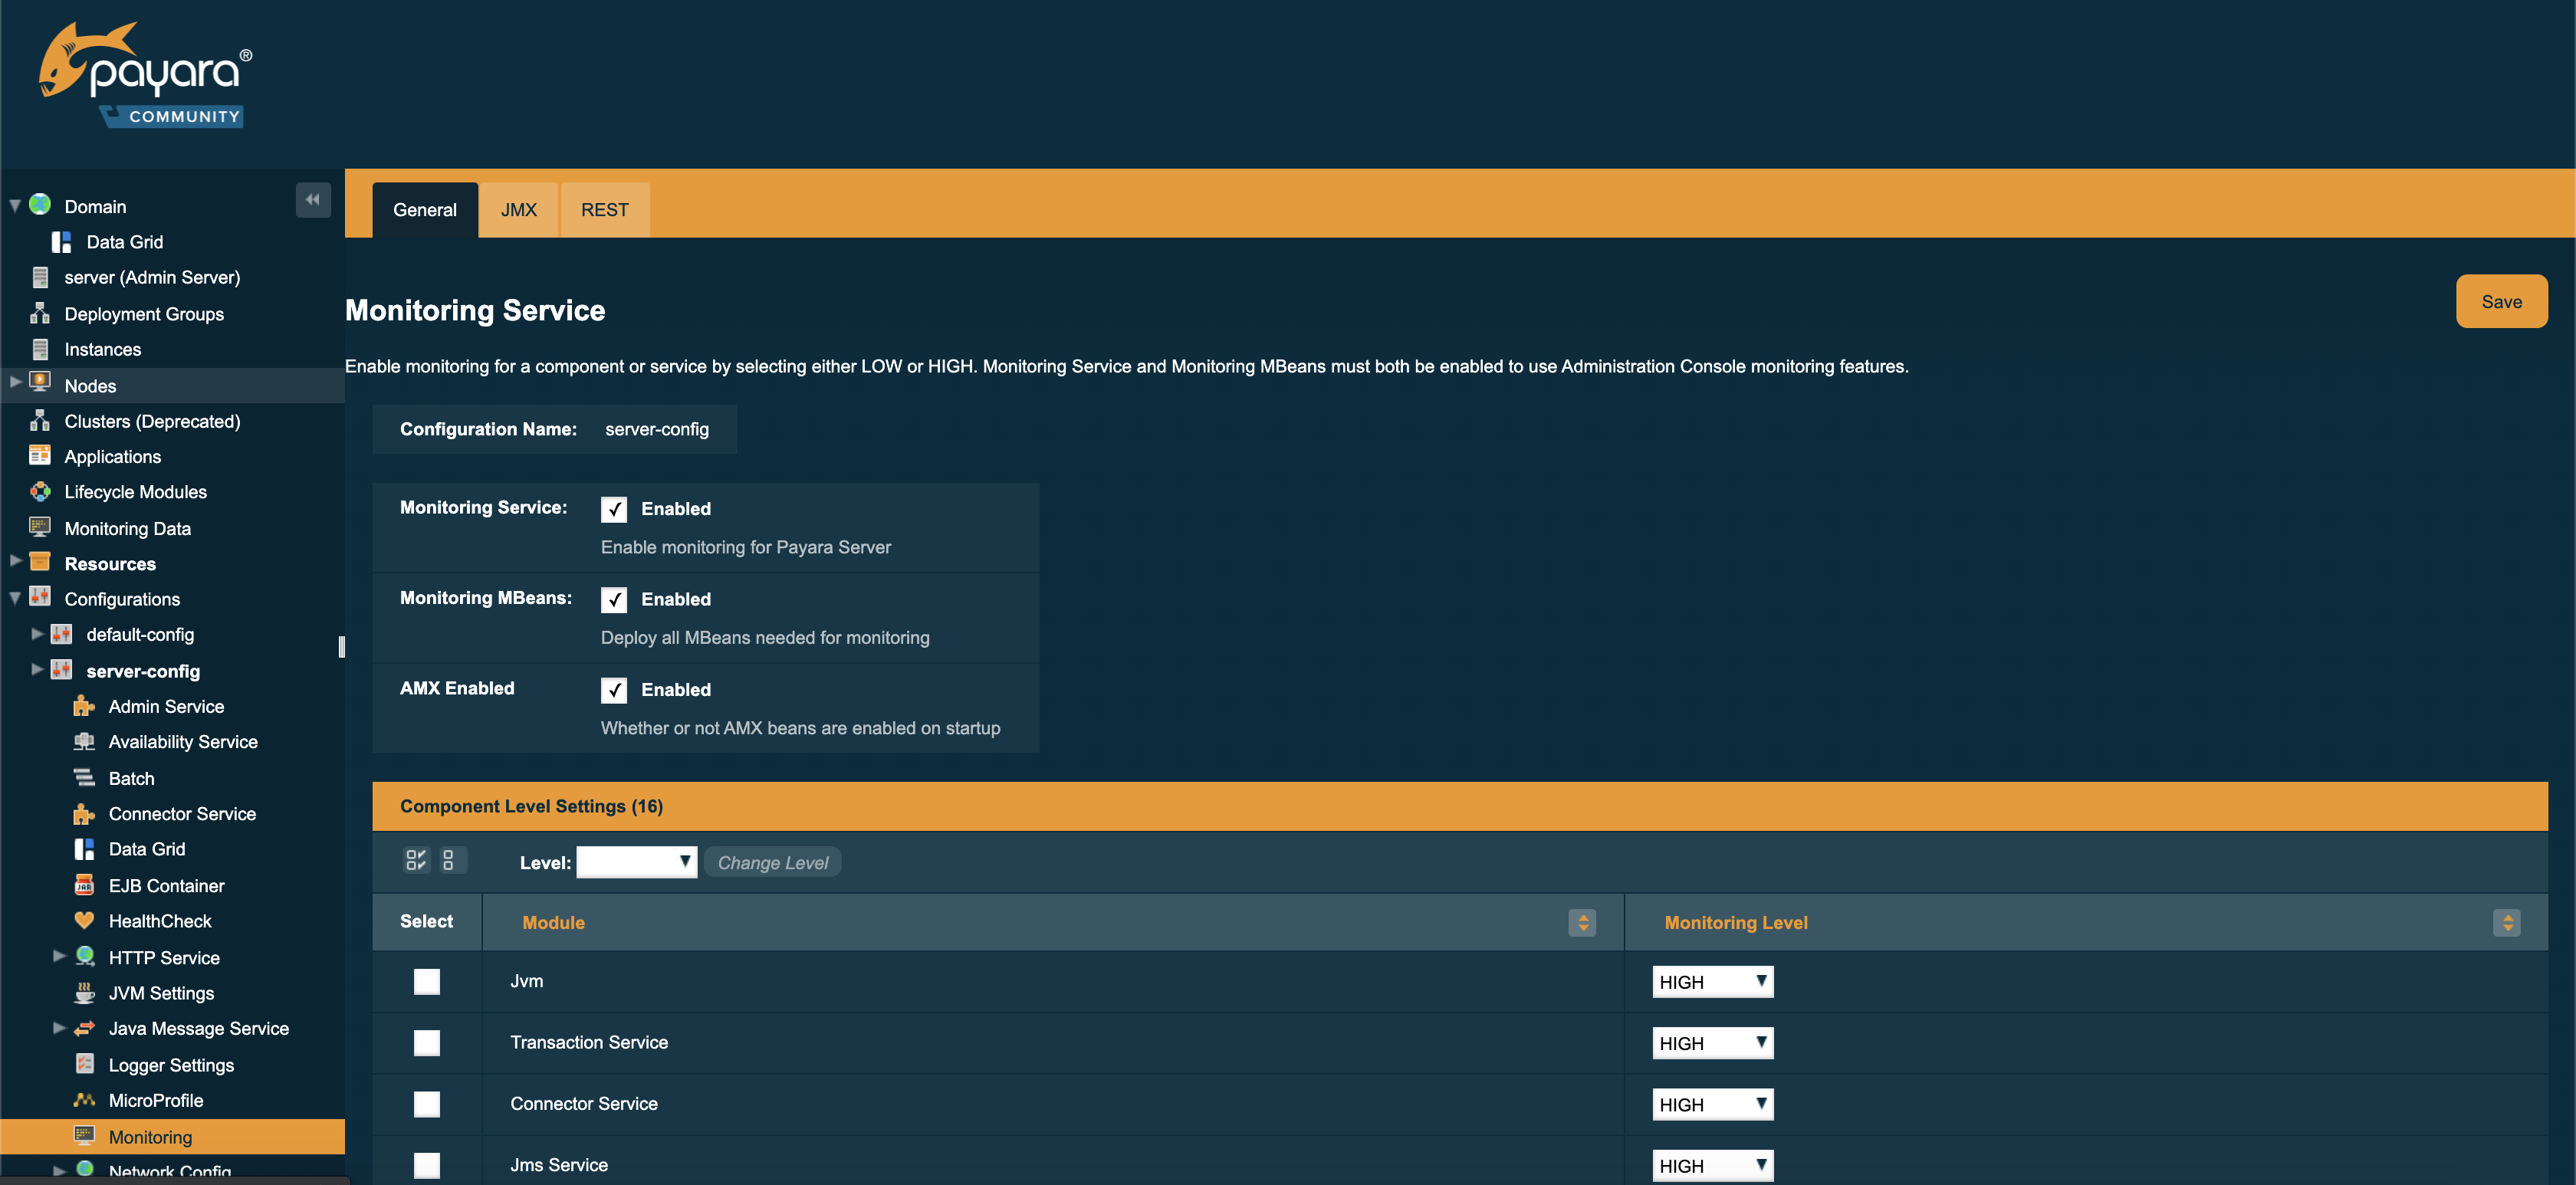
To configure the Monitoring Service in the Administration Console, go to Configuration → [instance-configuration (like server-config)] → Monitoring:

Using the Asadmin CLI
To configure the Monitoring Service from the command line, run the following command:
asadmin> set-monitoring-service-configuration --enabled=true --mbeansenabled=true --target=serverMore information on the options available to this command and how it works can be found in the following section.
Monitoring Service Asadmin Command Reference
The following is a detailed list of the administration commands that can be used to correctly configure the Monitoring Service.
set-monitoring-service-configuration
- Usage
-
asadmin> set-monitoring-service-configuration --enabled=true|false --mbeansenabled=true|false --amxenabled=true|false - Aim
-
This command can be used to set all configuration of the Monitoring Service at once.
Command Options
| Option | Type | Description | Default | Mandatory |
|---|---|---|---|---|
|
|
Whether to enable or disable the service. |
N/A |
no |
|
|
Whether to enable or disable MBean monitoring. |
N/A |
no |
|
|
Whether to enable or disable AMX on boot. |
N/A |
no |
|
|
The name of the configuration to set the monitoring service configuration on. |
|
no |
get-monitoring-service-configuration
- Usage
-
asadmin> get-monitoring-service-configuration - Aim
-
This command can be used to list the configuration settings of the Monitoring Service.
set-monitoring-level
- Usage
-
asadmin> set-monitoring-level - Aim
-
This command can be used set monitoring level of a module.
Command Options
| Option | Type | Description | Default | Mandatory |
|---|---|---|---|---|
|
|
The name of the module. |
N/A |
yes |
|
|
Allows you to change monitoring level for a module to |
N/A |
yes |
|
|
The name of the configuration to get the monitoring service configuration from. |
server |
no |
get-monitoring-level
- Usage
-
asadmin> get-monitoring-level - Aim
-
This command can be used to get monitoring level of a module.
Command Options
| Option | Type | Description | Default | Mandatory |
|---|---|---|---|---|
|
|
The name of the module. |
N/A |
no |
|
|
The name of the configuration to get the monitoring service configuration from. |
|
no |
Example
asadmin > get-monitoring-level
     --module=jvm
     --target=server
You can also get monitoring level for all available modules using example below:
asadmin > get-monitoring-level
     --target=server
This will generate an output similar to the following:
Module                       Monitoring Level
cloud                        OFF
cloud-elasticity             OFF
cloud-orchestrator           OFF
cloud-tenant-manager         OFF
cloud-virt-assembly-service  OFF
connector-connection-pool    OFF
connector-service            OFF
deployment                   OFF
ejb-container                OFF
http-service                 LOW
jdbc-connection-pool         OFF
jersey                       OFF
jms-service                  OFF
jpa                          OFF
jvm                          HIGH
orb                          OFF
security                     OFF
thread-pool                  OFF
transaction-service          OFF
web-container                OFF
web-services-container       OFF
restart-monitoring
- Usage
-
asadmin> restart-monitoring - Aim
-
This command can be used to restart monitoring levels.
The command will set all modules to OFF before setting them to their previous level.
|
Command Options
| Option | Type | Description | Default | Mandatory |
|---|---|---|---|---|
|
|
The name of the configuration to get the monitoring service configuration from. |
|
no |
|
|
Enable verbose output for the current command. |
|
no |
Example
asadmin > restart-monitoring --target=server-configThis will generate an output similar to the following:
Restarted 3 modulesYou can use the verbose mode to see which modules were affected and what monitoring level they are currently set to:
asadmin > restart-monitoring
     --target=server
     --verbose
This will generate an output similar to the following:
Module                       Monitoring Level
cloud                        HIGH
cloud-elasticity             LOW
cloud-orchestrator           HIGH