JMX Monitoring can be configured to send notifications using the notification service. This allows you to forward data from exposed MBeans to your configured notifiers.
Configuration
The JMX Monitoring configuration page can be found under Configurations →
<config-name> → Monitoring.
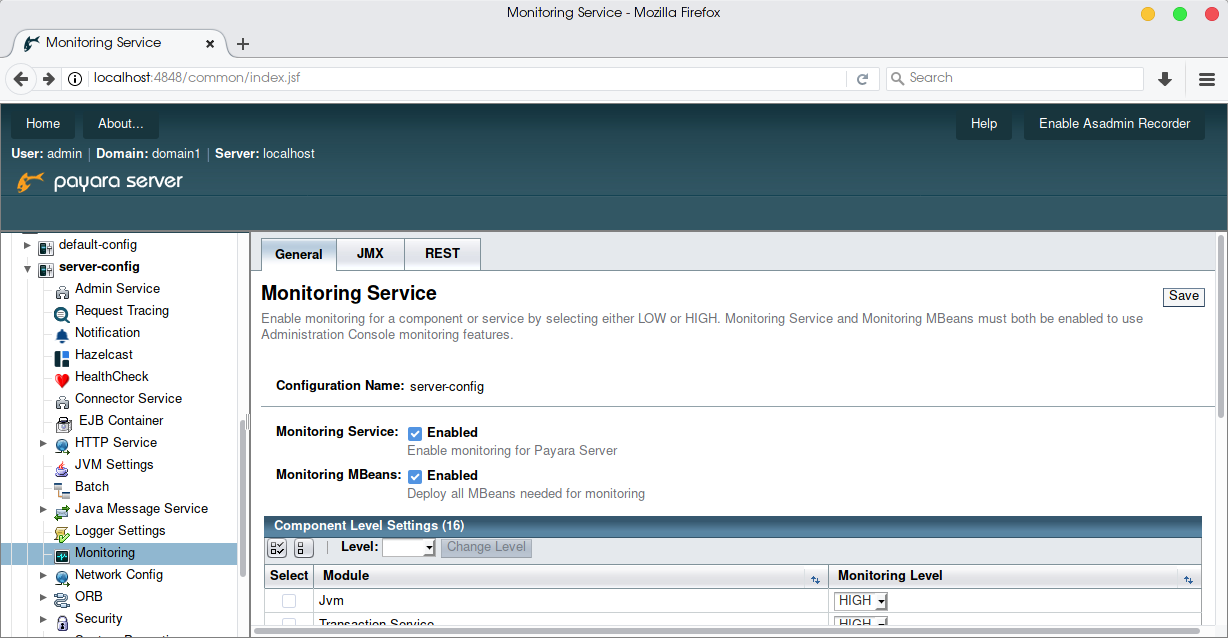
From the Monitoring page, select the tab labelled JMX:
The JMX page allows you to specify the time between notifications, how notifications will be delivered, and the MBeans which will be included within the message.
Enabling JMX Monitoring via the Admin Console
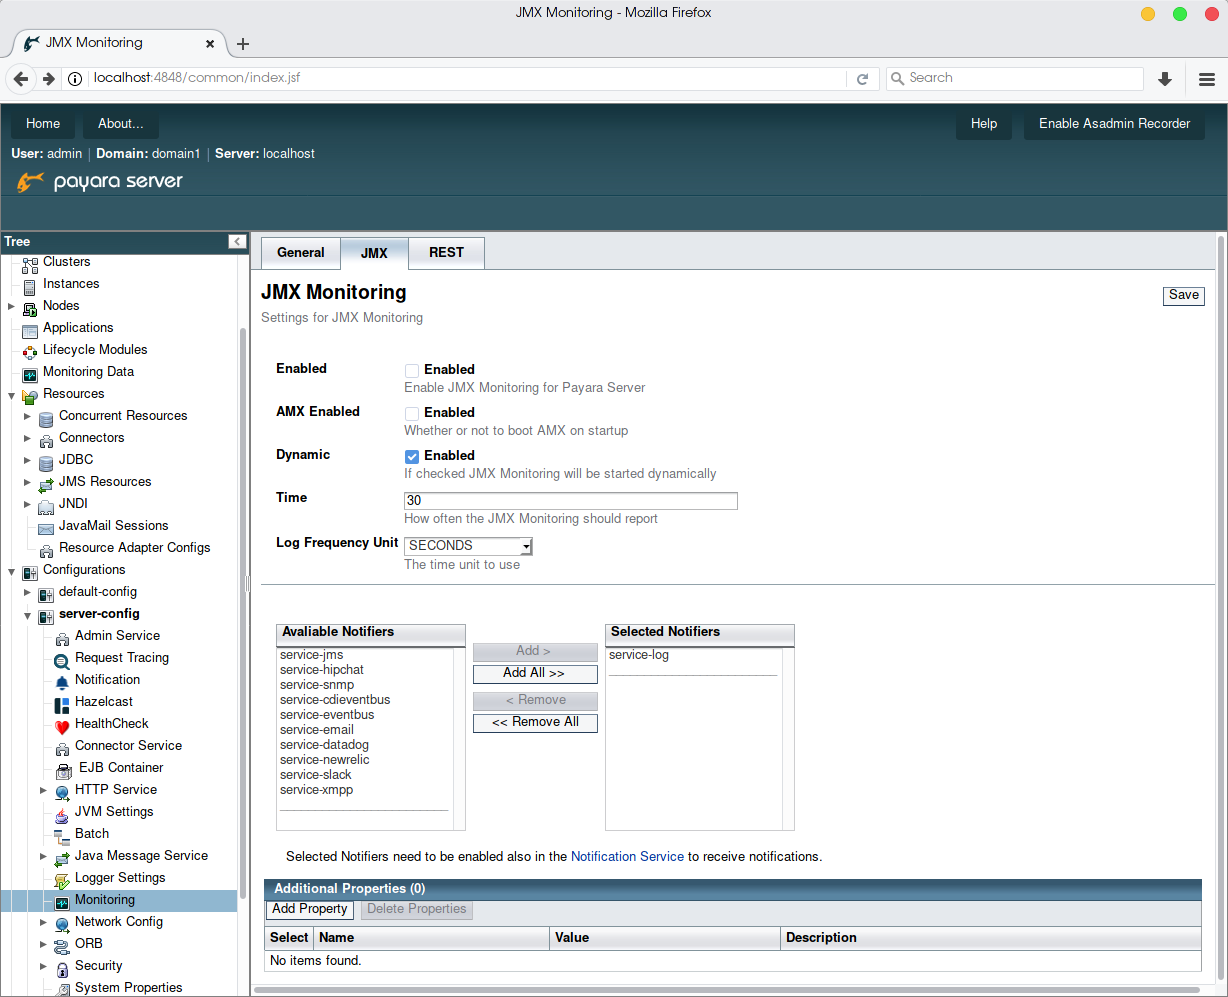
By default, both JMX and AMX start disabled.
To enable JMX Monitoring for the JVM, select Enabled. To also access extra
data from Payara Server via AMX (recommended), select AMX Enabled:
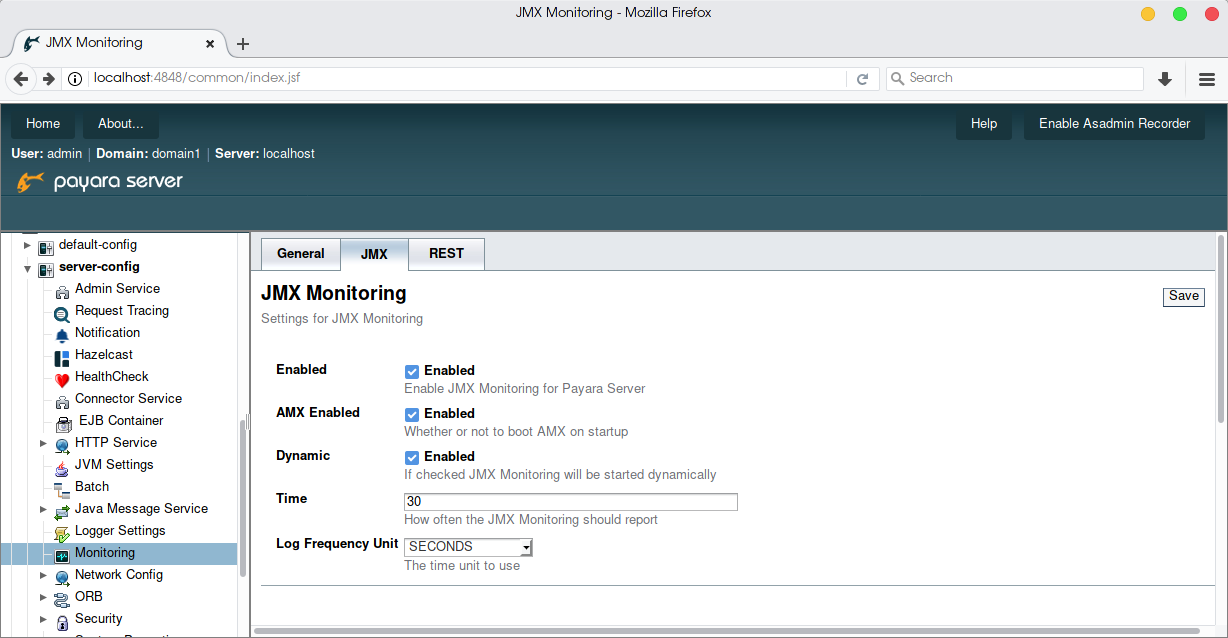
Finally, to save your changes, click Save.
Enabling JMX Monitoring via asadmin
To enable JMX Monitoring for the JVM via asadmin, use the command:
asadmin> set-monitoring-configuration --enabled=true --amx trueConfiguring JMX Monitoring Time via the Admin Console
To configure the frequency of logged data, enter both the intended frequency of logs and the unit of time.
For example, to log every 10 milliseconds:
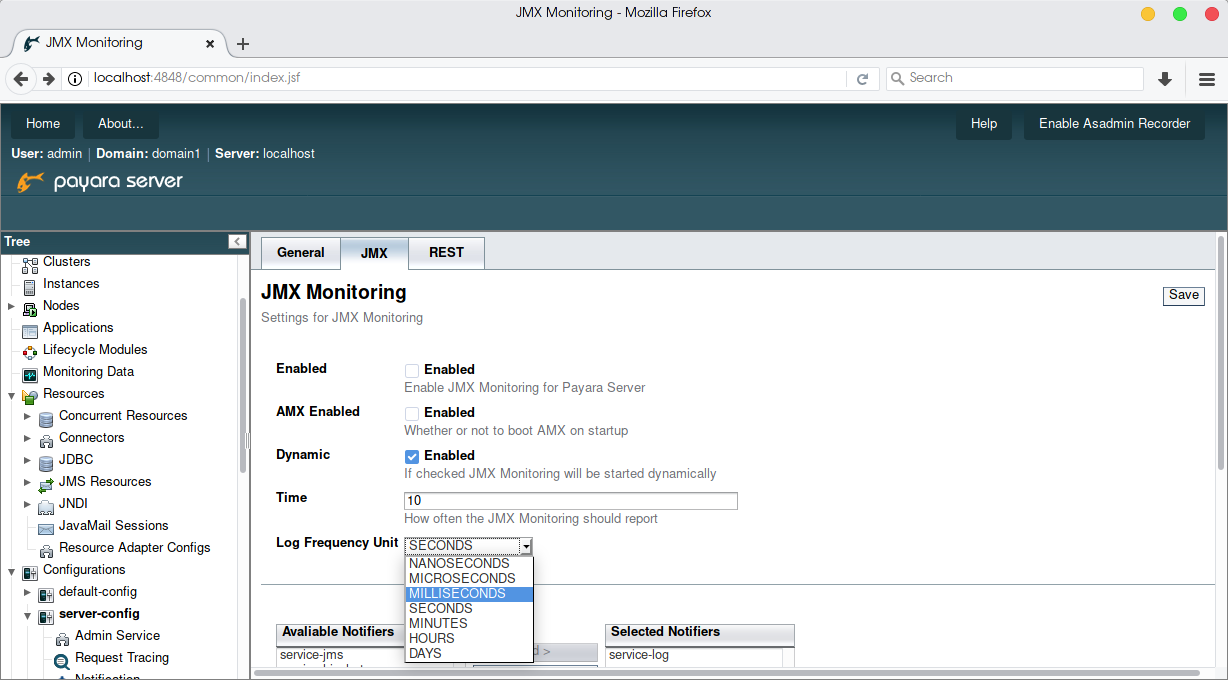
Configuring JMX Monitoring Time via asadmin
To configure the data logging frequency via asadmin, use the command:
asadmin> set-monitoring-configuration --logfrequency <frequency> --logfrequencyunit NANOSECONDS|MICROSECONDS|MILLISECONDS|SECONDS|MINUTES|HOURS|DAYSAdding Notifiers via the Admin Console
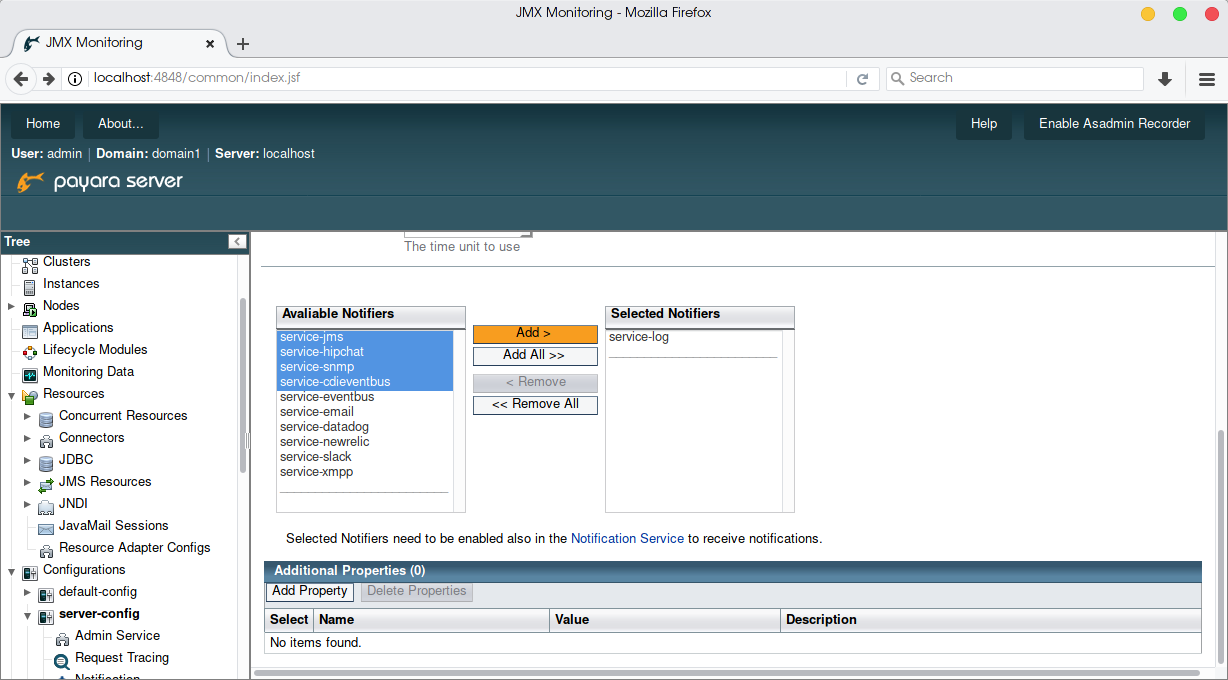
Before you receive notifications from your chosen notifier, please ensure that you have configured the notification service.
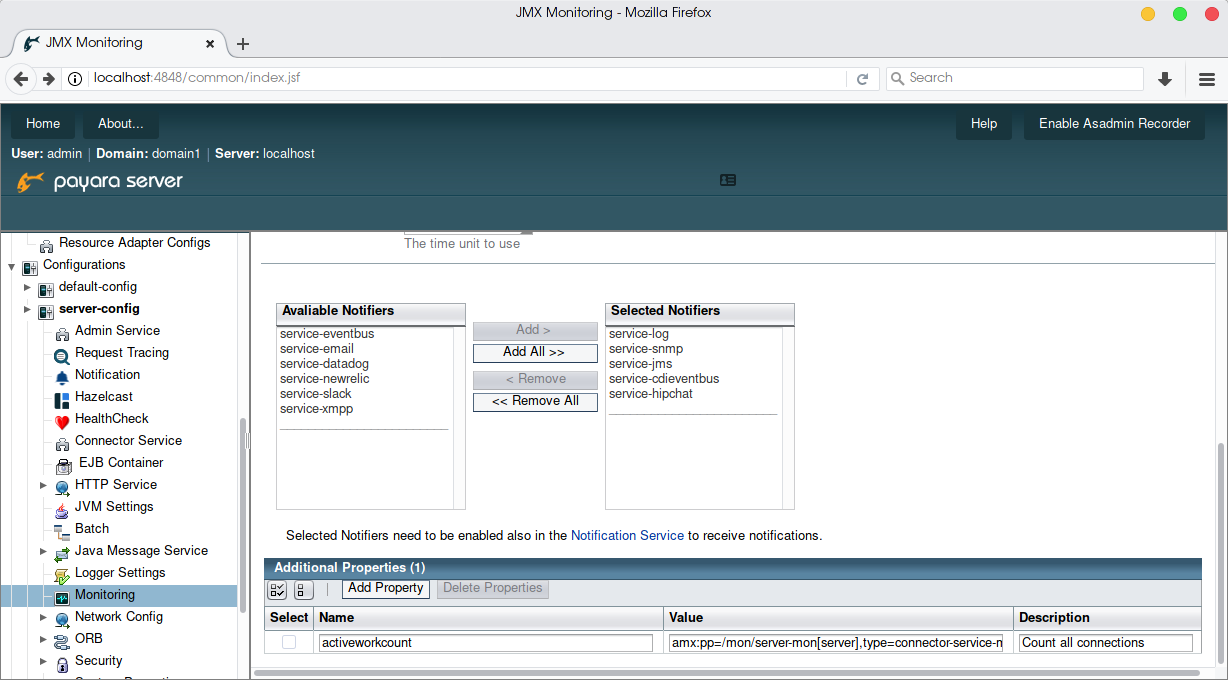
To select notifiers to use for JMX Monitoring, hold the CTRL or SHIFT key
to select multiple notifiers, and then click Add >.
Adding Notifiers via asadmin
For each notifier you wish to enable use the command:
asadmin> monitoring-<notifier>-notifier-configure --enabled trueAvailable Notifiers can be viewed on the notifiers page.
Adding Properties via the admin console
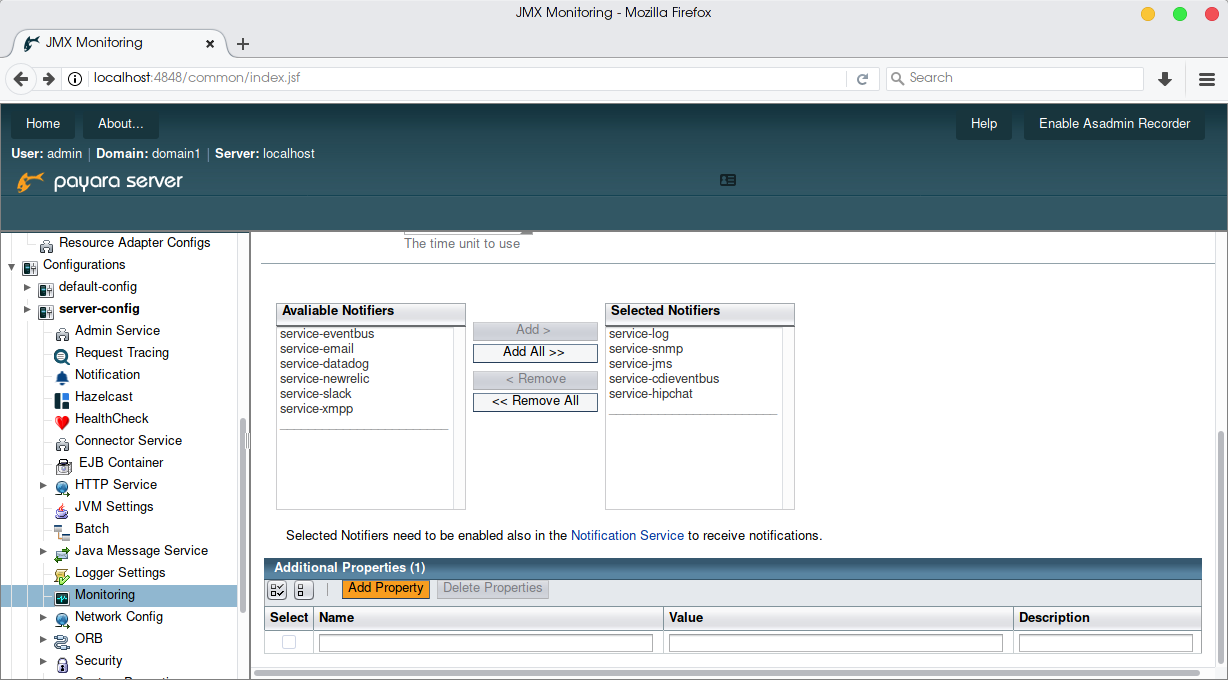
By default, JMX will output an empty message as there are no MBeans configured.
To add an MBean to the monitoring service, click Add Property on the
Additional Properties table at the bottom of the page:
You can now add your monitoring attributes to the notification service using the following values:
-
name: the MBean attribute name
-
value: the MBean domain name
-
description: displayed in the
get-monitoring-configurationasadmin command, optional
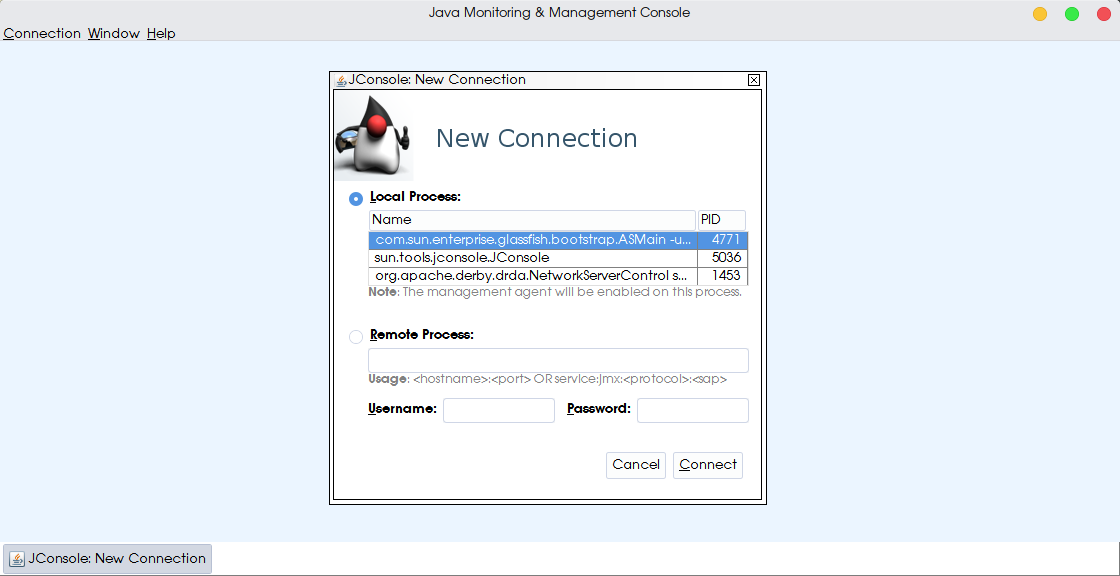
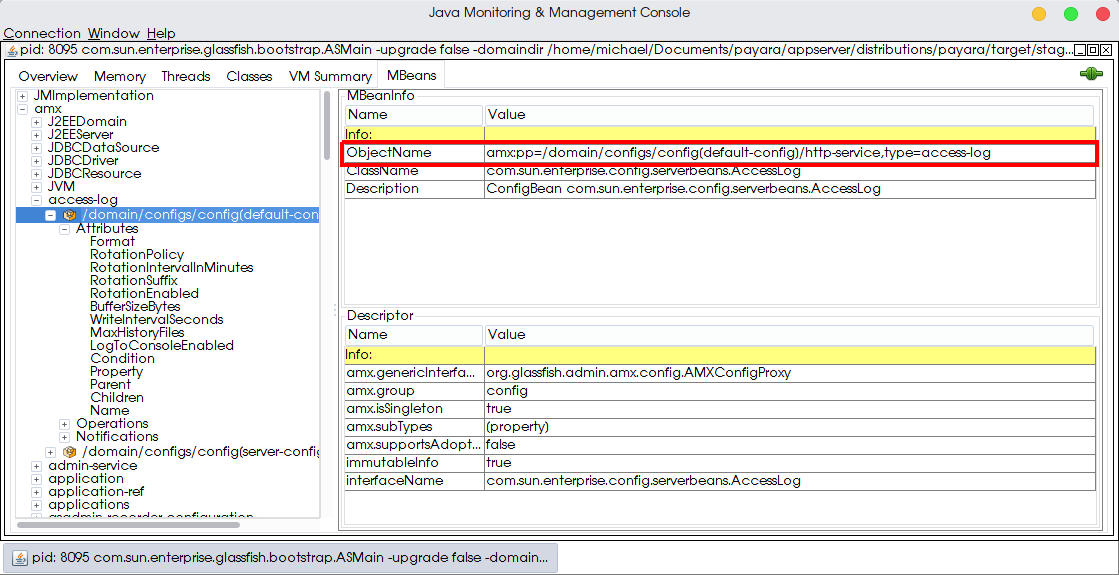
MBean attribute names and domain names can be discovered using JConsole, JVisualVM, Java Mission Control or other programs. To browse available MBean attributes, after enabling JMX and AMX in the admin console, connect to your Payara Server instance from your chosen program:
From here, to find an MBean, select the MBeans tab to view all MBeans on the server. If you have enabled "HIGH" monitoring for all components along with JMX monitoring you should be able to see the following files:
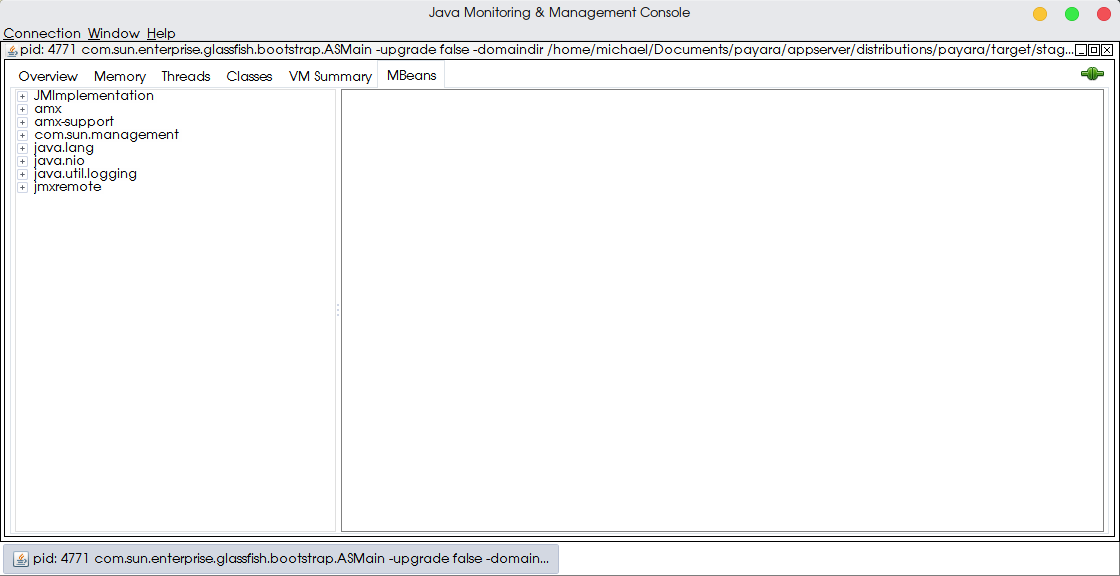
From here you can search MBeans for attributes which you wish to monitor. Once you have located an MBean attributes you can add it to the DAS using the given object name (or, if not present, the type, name, and location of the MBean in the following format):
For example, to monitor the activeworkcount of the MBean on the DAS with a
domain (Object Name) of amx:pp=/mon/server-mon[server],type=connector-service-mon,name=jms-service/work-management,
you would enter:
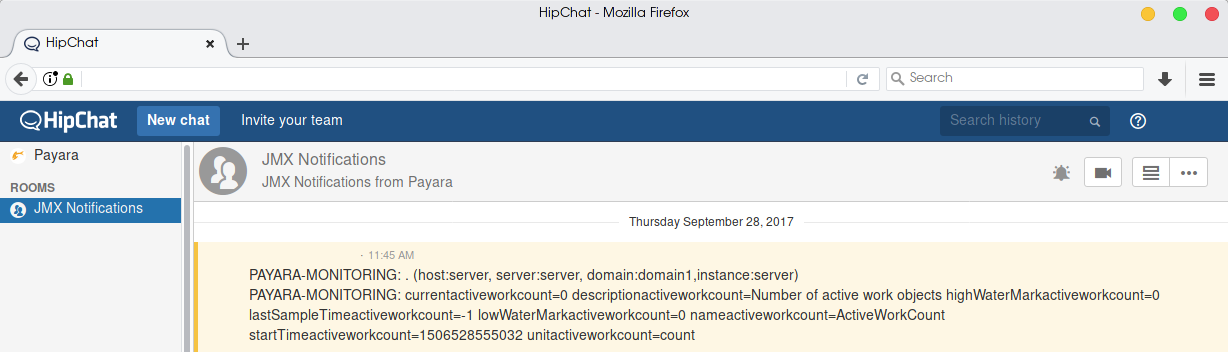
Click the Save button at the top of the page to save and exit. If you have
entered all values correctly, you should see a message via your chosen notifier
with the MBeans contents:
Via the logs:
[2017-09-28T11:40:29.794+0100] [Payara 4.1] [INFO] [] [fish.payara.nucleus.notification.log.LogNotifierService] [tid: _ThreadID=283 _ThreadName=payara-monitoring-service(12)] [timeMillis: 1506595229794] [levelValue: 800] [[
  PAYARA-MONITORING:  - PAYARA-MONITORING: currentactiveworkcount=0 descriptionactiveworkcount=Number of active work objects highWaterMarkactiveworkcount=0 lastSampleTimeactiveworkcount=-1 lowWaterMarkactiveworkcount=0 nameactiveworkcount=ActiveWorkCount startTimeactiveworkcount=1506528555032 unitactiveworkcount=count ]]
Via HipChat:
Adding Properties via asadmin
To add a property via asadmin, use the command:
asadmin> set-monitoring-configuration --addproperty <property>So to replicate the above properties, use the command:
asadmin> set-monitoring-configuration --addproperty name activeworkcount value amx:pp=/mon/server-mon[server],type=connector-service-mon,name=jms-service/work-management description "Count all connections"