Payara Server Community keeps track of the recently executed SQL statements for monitoring purposes. This way, one can review which SQL statements are executed, how many times the same statement is executed and how long it took.
Activate Overview
The activation of the collection is controlled by the monitoring service.
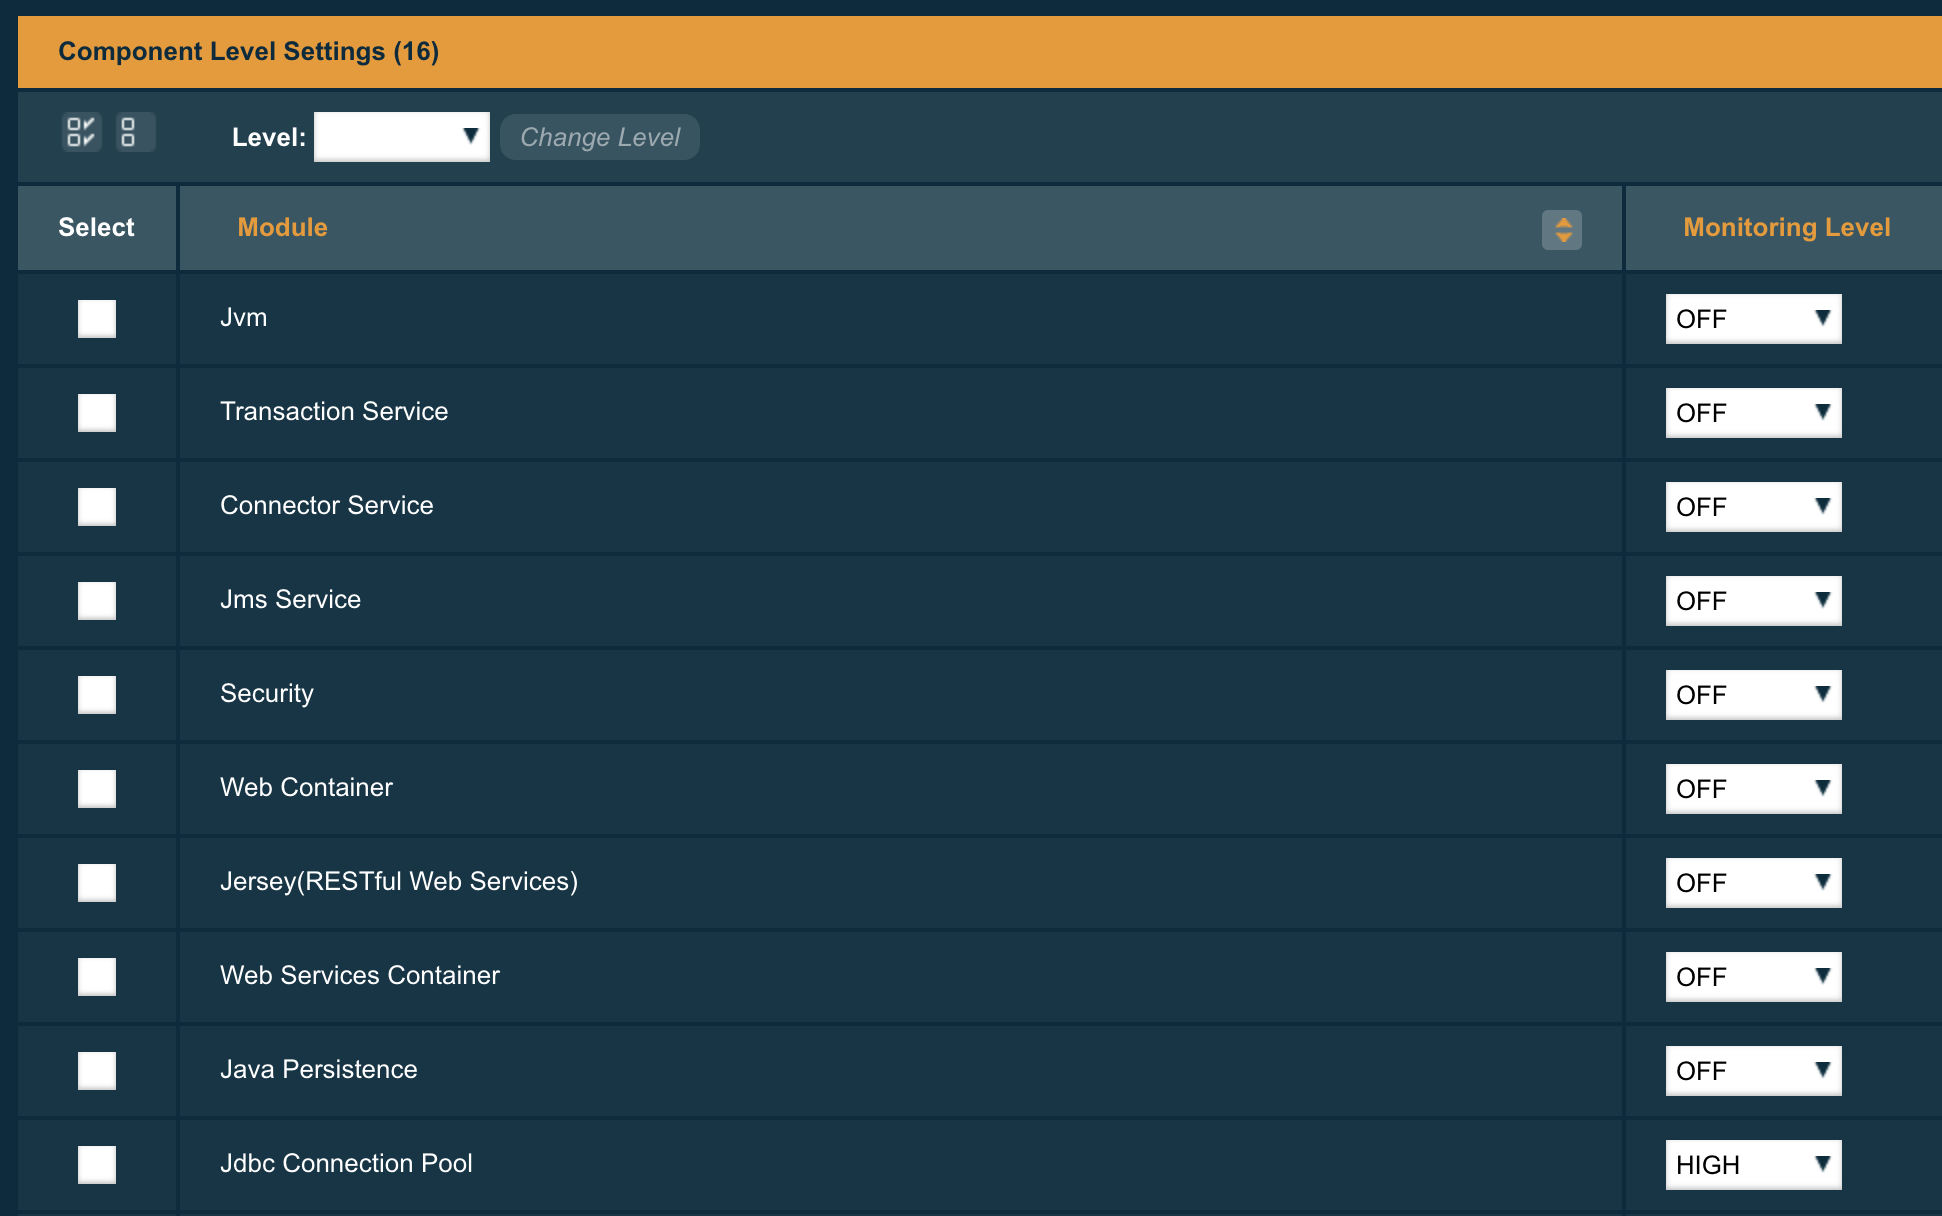
When using the Web Administration console, go to Configuration → [instance-configuration (like server-config)] → Monitoring: and select the level High for the JDBC Connection pool component.
When using the asadmin CLI, you can execute the following command to set the Level Value
set configs.config.server-config.monitoring-service.module-monitoring-levels.jdbc-connection-pool=HIGH
The information can be consulted via the JMX beans or the Rest monitoring interface. These need to be activated also, see [monitoring-service-configuration] and [rest-monitoring-configuration] on how to do this.
Viewing statements
When you want to retrieve the information through the JMX channel, you can find the information in the bean
amx:pp=/mon/server-mon[server],type=jdbcra-mon,name=resources/<pool-name>
When using the Rest monitoring interface, you can access the following URL
http://localhost:4848/monitoring/domain/server/resources/<pool-name>
In both cases, the <pool-name> is the actual pool name you have created within Payara Server and which you like to retrieve the information for.
The properties we want to highlight here are
-
frequsedsqlqueries: Contains the list of all SQL statements and their execution count, which are executed during the collection time frame.
-
slowSqlQueries: Contains again the list of all SQL statements but this time with the maximum execution time they took.
Configuring parameters
The SQL statement collection has a few configuration values which have default values.
-
Timeframe: By default, the info about the SQL statements are retained during 5 minutes
-
Cache size: The information is kept in a cache which has by default place for 100000 items.
These values can be configured by defining some key-value pairs in the properties for the connection pool. This can be done during the creation or afterward by updating the pool.
-
TIME-TO-KEEP-QUERIES-IN-MINUTES: This defines the number of minutes the SQL statement info is retained.
-
MAX-CACHE-SIZE: This defines the maximum size of the cache. When specifying the value 0, it disables the feature.
When the cache size is too small, you see an information message in the log to indicate that not all statements could be retained.