Payara Server can trace all SQL calls made through a JDBC connection pool, with the time taken to execute the call also recorded. SQL Tracing is ideal for debugging those hard to pin down performance issues during the development phase and as all SQL is visible SQL tracing is also a great way to see the SQL generated out of your JPA code.
With Log JDBC Calls configured on the connection call each call into the
Connection pool is timed and logged to the server log
at the FINE level. A typical log message with Log JDBC Enabled is shown
below;
[#|2016-02-04T18:51:01.467+0000|FINE|Payara 4.1|javax.enterprise.resource.sqltrace.com.sun.gjc.util|_ThreadID=35;_ThreadName=http-listener-1(5);_TimeMillis=1454611861467;_LevelValue=500;ClassName=com.sun.gjc.util.SQLTraceLogger;MethodName=sqlTrace;|
  PoolName=DerbyPool | ExecutionTime=1ms | ClassName=org.apache.derby.client.net.NetConnection40 | MethodName=prepareStatement | arg[0]=SELECT ID, AGE, BIO, BIRTHDATE, BIRTHDAY, DATEFORMAT, DATEOFBIRTH, DATEOFHIRE, EMAIL, HIREDATE, HIREDAY, MEMBERAGE, NAME, TODAYSDATE FROM MEMBERENTITY WHERE (NAME = ?) | arg[1]=1003 | arg[2]=1007 | |#]

[#|2016-02-04T18:51:01.467+0000|FINE|Payara 4.1|javax.enterprise.resource.sqltrace.com.sun.gjc.util|_ThreadID=35;_ThreadName=http-listener-1(5);_TimeMillis=1454611861467;_LevelValue=500;ClassName=com.sun.gjc.util.SQLTraceLogger;MethodName=sqlTrace;|
  PoolName=DerbyPool | ExecutionTime=0ms | ClassName=com.sun.gjc.spi.jdbc40.PreparedStatementWrapper40 | MethodName=setString | arg[0]=1 | arg[1]=test | |#]

[#|2016-02-04T18:51:01.468+0000|FINE|Payara 4.1|javax.enterprise.resource.sqltrace.com.sun.gjc.util|_ThreadID=35;_ThreadName=http-listener-1(5);_TimeMillis=1454611861468;_LevelValue=500;ClassName=com.sun.gjc.util.SQLTraceLogger;MethodName=sqlTrace;|
  PoolName=DerbyPool | ExecutionTime=1ms | ClassName=com.sun.gjc.spi.jdbc40.PreparedStatementWrapper40 | MethodName=executeQuery | |#]

[#|2016-02-04T18:51:01.483+0000|FINE|Payara 4.1|javax.enterprise.resource.sqltrace.com.sun.gjc.util|_ThreadID=35;_ThreadName=http-listener-1(5);_TimeMillis=1454611861483;_LevelValue=500;ClassName=com.sun.gjc.util.SQLTraceLogger;MethodName=sqlTrace;|
  PoolName=DerbyPool | ExecutionTime=0ms | ClassName=com.sun.gjc.spi.jdbc40.PreparedStatementWrapper40 | MethodName=close | |#]
You can see in the log messages that the prepareStatement, setString,
executeQuery and close methods are all logged along with their execution
times and their parameters. This allows for exceptional debugging and
tracking down database connection related issues.
| This is a feature best used for development purposes due to the volume of trace that is produced. |
Enabling JDBC Call Logging
Using the Administration Console
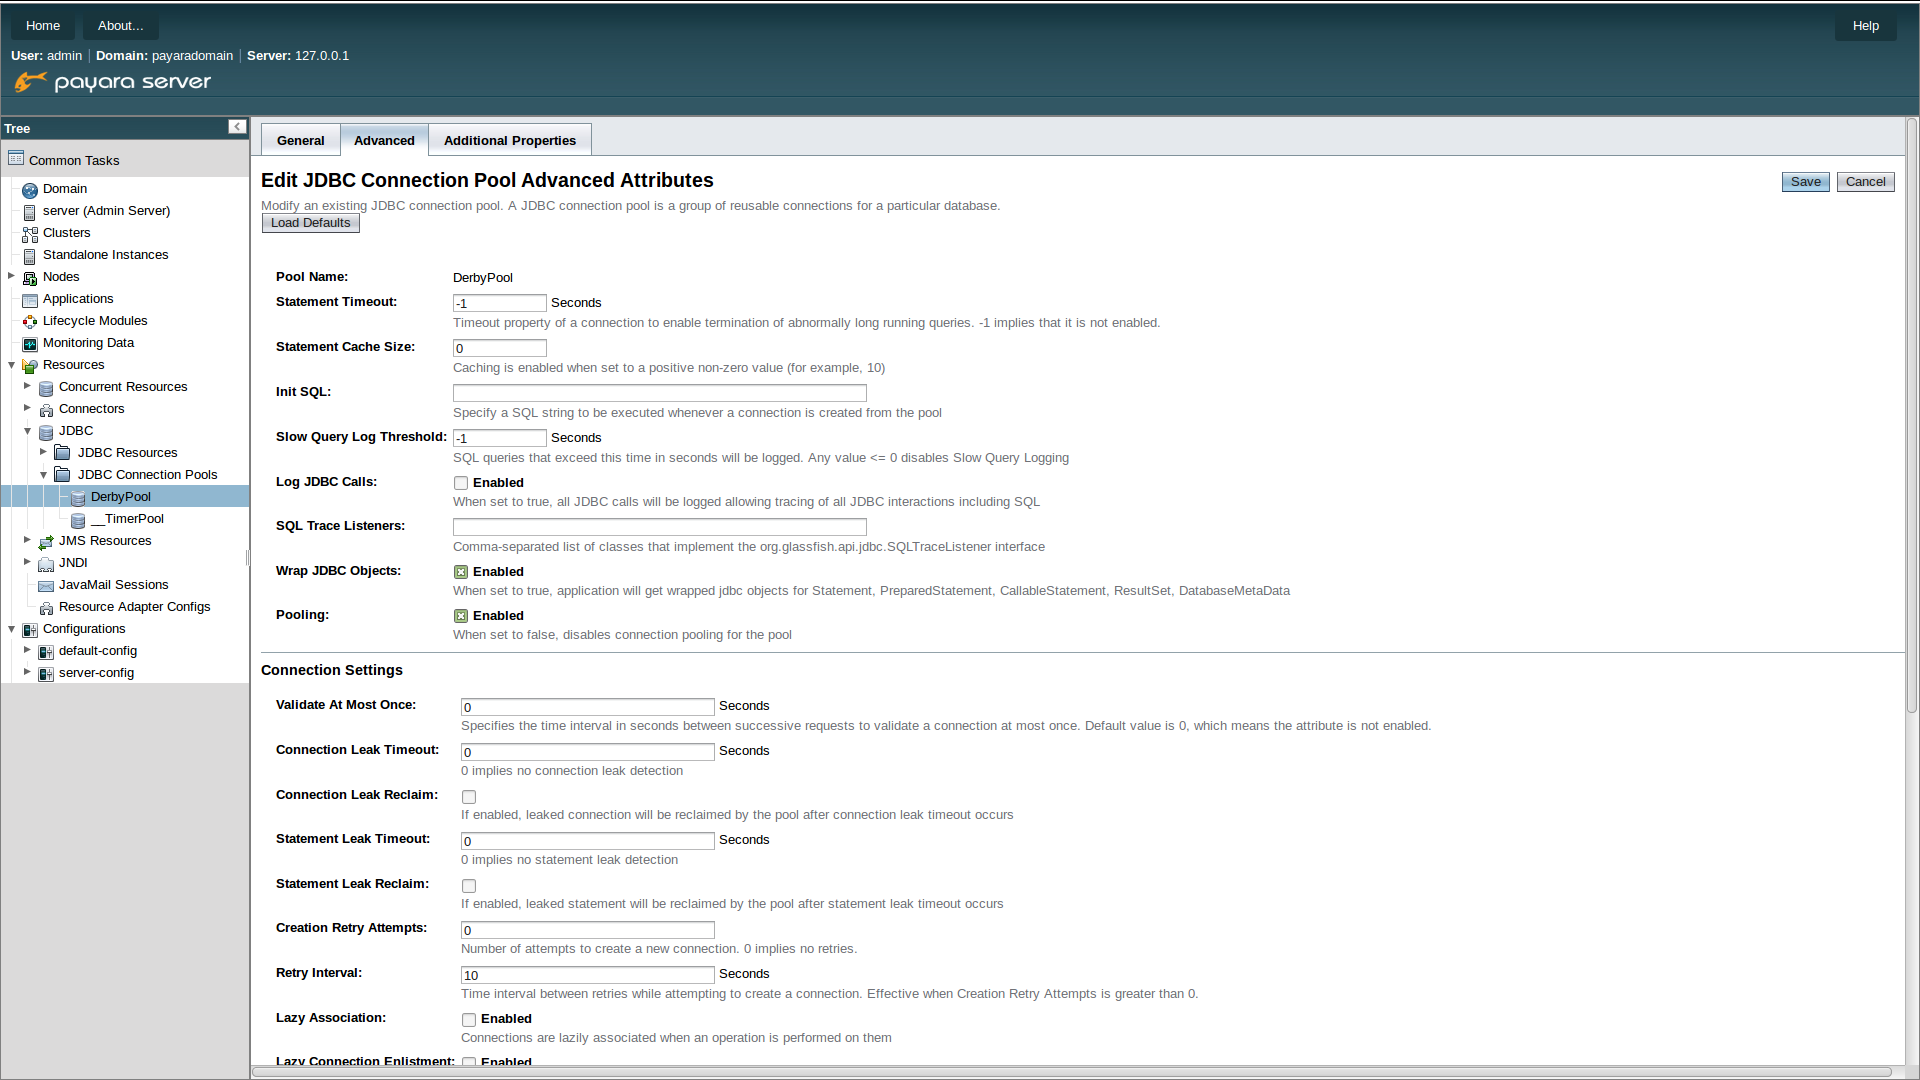
SQL Tracing can be enabled through the Payara Server administration console. First, navigate to the advanced table of your JDBC connection pool, then select the JDBC → JDBC Connection pools → <Your Connection pool>. Then select the Advanced Tab in the main window of the administration console. Then select the checkbox next to Log JDBC Calls to enable logging of all SQL calls:
Using Asadmin commands
The Log JDBC Calls setting for a JDBC connection pool can also be configured
via asadmin using the set command to set the fish.payara.log-jdbc-calls
property of your connection pool to true, like in the following example:
asadmin set domain.resources.jdbc-connection-pool.__TimerPool.log-jdbc-calls=trueApplication Deployment
In Java EE 7 applications, a JDBC data source can be deployed by adding the
@DataSourceDefinition annotation to a managed component (like and @Stateless
EJB bean for example). The Log JDBC Calls setting can be configured using
this annotation as well:
@DataSourceDefinition(
    name = "java:app/MyApp/MyDS",
    className = "org.h2.jdbcx.JdbcDataSource",
    url = "jdbc:h2:mem:test",
    properties = {"fish.payara.log-jdbc-calls=true"})
The Data source definition can also be added to a deployment descriptor of an application, for example in the web.xml standard deployment descriptor:
<data-source>
   <name>java:global/ExampleDataSource</name>
   <class-name>com.mysql.jdbc.jdbc2.optional.MysqlXADataSource</class-name>
   <server-name>localhost</server-name>
   <port-number>3306</port-number>
   <database-name>mysql</database-name>
   <user>test</user>
   <password>test</password>
   <!-- Example of how to use a Payara specific custom connection pool setting -->
   <property>
       <name>fish.payara.log-jdbc-calls</name>
       <value>true</value>
   </property>
</data-source>