Payara offers a custom JMX Monitoring Service. Once configured, Payara Server will monitor and log the values of attributes that have been listed for monitoring. The metrics are logged together in a single log message as a series of key-value pairs prefixed by the string JMX-MONITORING:.
| The default JMX listener is unauthenticated and open for local access. In an unsecure environment, open JMX ports should be disabled to prevent unwanted access. |
Enabling JMX Monitoring
| Payara uses the AMX API for working with JMX MBeans. AMX is not fully exposed by default and as such needs to be loaded to access most JMX MBean objects. The JMX Monitoring Service can be used without AMX but there is a limit to what can be monitored without it. |
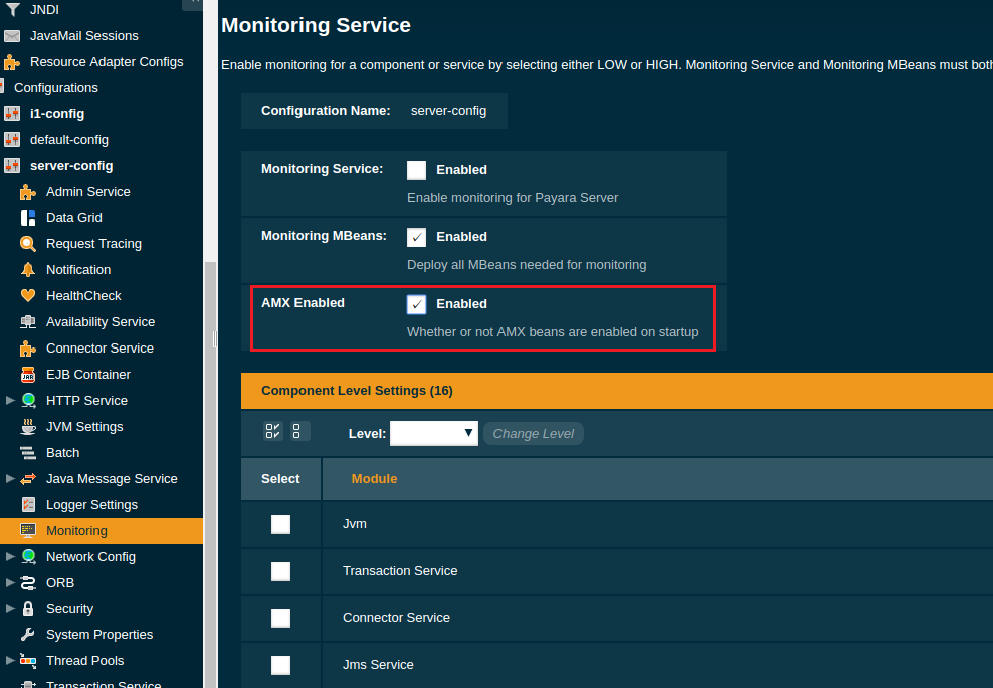
Boot AMX
To boot AMX at startup or independently of the JMX Monitoring service, run the command below:
asadmin>set-amx-enabled --enabled true --dynamic true --target serverBoot AMX Using the Admin Console
You can now enable JMX Monitoring using the set-jmx-monitoring-configuration asadmin command
JMX Monitoring can either be enabled for next startup or the service can be dynamically enabled on a running instance of Payara (provided a non-empty configuration exists at server startup). To enable the service dynamically on the default running instance of Payara the command to run is:
asadmin> set-jmx-monitoring-configuration --dynamic true --enabled trueTo enable the service for next startup the --dynamic option would need to be dropped from the command.
Getting The JMX Monitoring Configuration
- Usage
-
asadmin> get-jmx-monitoring-configuration --pretty false|true - Aim
-
Retrieves the monitoring service configuration and outputs it.
Setting The JMX Monitoring Configuration
You can configure JMX Monitoring using the set-jmx-monitoring-configuration asadmin command.
Adding a monitoring attribute
To add the HeapMemoryUsage attribute to the list of MBean attributes to monitor using the service the following command can be used:
asadmin> set-jmx-monitoring-configuration --addattribute 'attributeName=HeapMemoryUsage objectName=java.lang:type=Memory' --enabled falseBreaking this command down, two arguments have been used:
-
--addattribute -
--enabled
Passing --addattribute to set-jmx-monitoring-configuration provides a way to add a new MBean attribute to monitor using the service. This argument takes in a string of space-delimited key-value pairs corresponding to the values listed earlier. The attributeName and objectName fields are required, but description is not. Providing attributeName=HeapMemoryUsage denotes that the name of the MBean attribute to log is HeapMemoryUsage, while objectName=java.lang:type=Memory denotes the ObjectName of the MBean to look for the attribute on is java.lang:type=Memory.
The second argument, --enabled, is the only required option for the asadmin command. The only valid values to give this option are true or false. Passing false to the option will disable the logging service on next startup if it is currently enabled, but will otherwise do nothing. Under this scenario the monitoring service has not been configured yet so false was passed.
Dealing with composite MBean attributes
The MBean attribute added, HeapMemoryUsage, is a composite attribute.
It has metrics for the commited, init, max and used attributes. The monitoring service will by default monitor each metric and log it as {$metric}{$attribute_name}:{$attribute_value}.
If this is not the desired result, it is possible to monitor a single metric for a composite MBean attribute. To monitor a single metric for the attribute the value of attributeName passed to the --addattribute option should be modified like so:
attributeName=HeapMemoryUsage.metric
So to log only the used heap memory the asadmin command would be:
asadmin> set-jmx-monitoring-configuration --addattribute 'attributeName=HeapMemoryUsage.used objectName=java.lang:type=Memory' --enabled falseSetting logging frequency
There are two configuration attributes related to the frequency at which log messages are written: logfrequency and logfrequencyunit. The first is a numerical value used for the rate, while the second is the unit for the rate. The default configuration is set to have a message logged every 15 seconds.
If the value of logfrequencyunit is the default of SECONDS then to have the monitoring service log messages every one minute execute the following command:
asadmin> set-jmx-monitoring-configuration --logfrequency 60 --enabled false