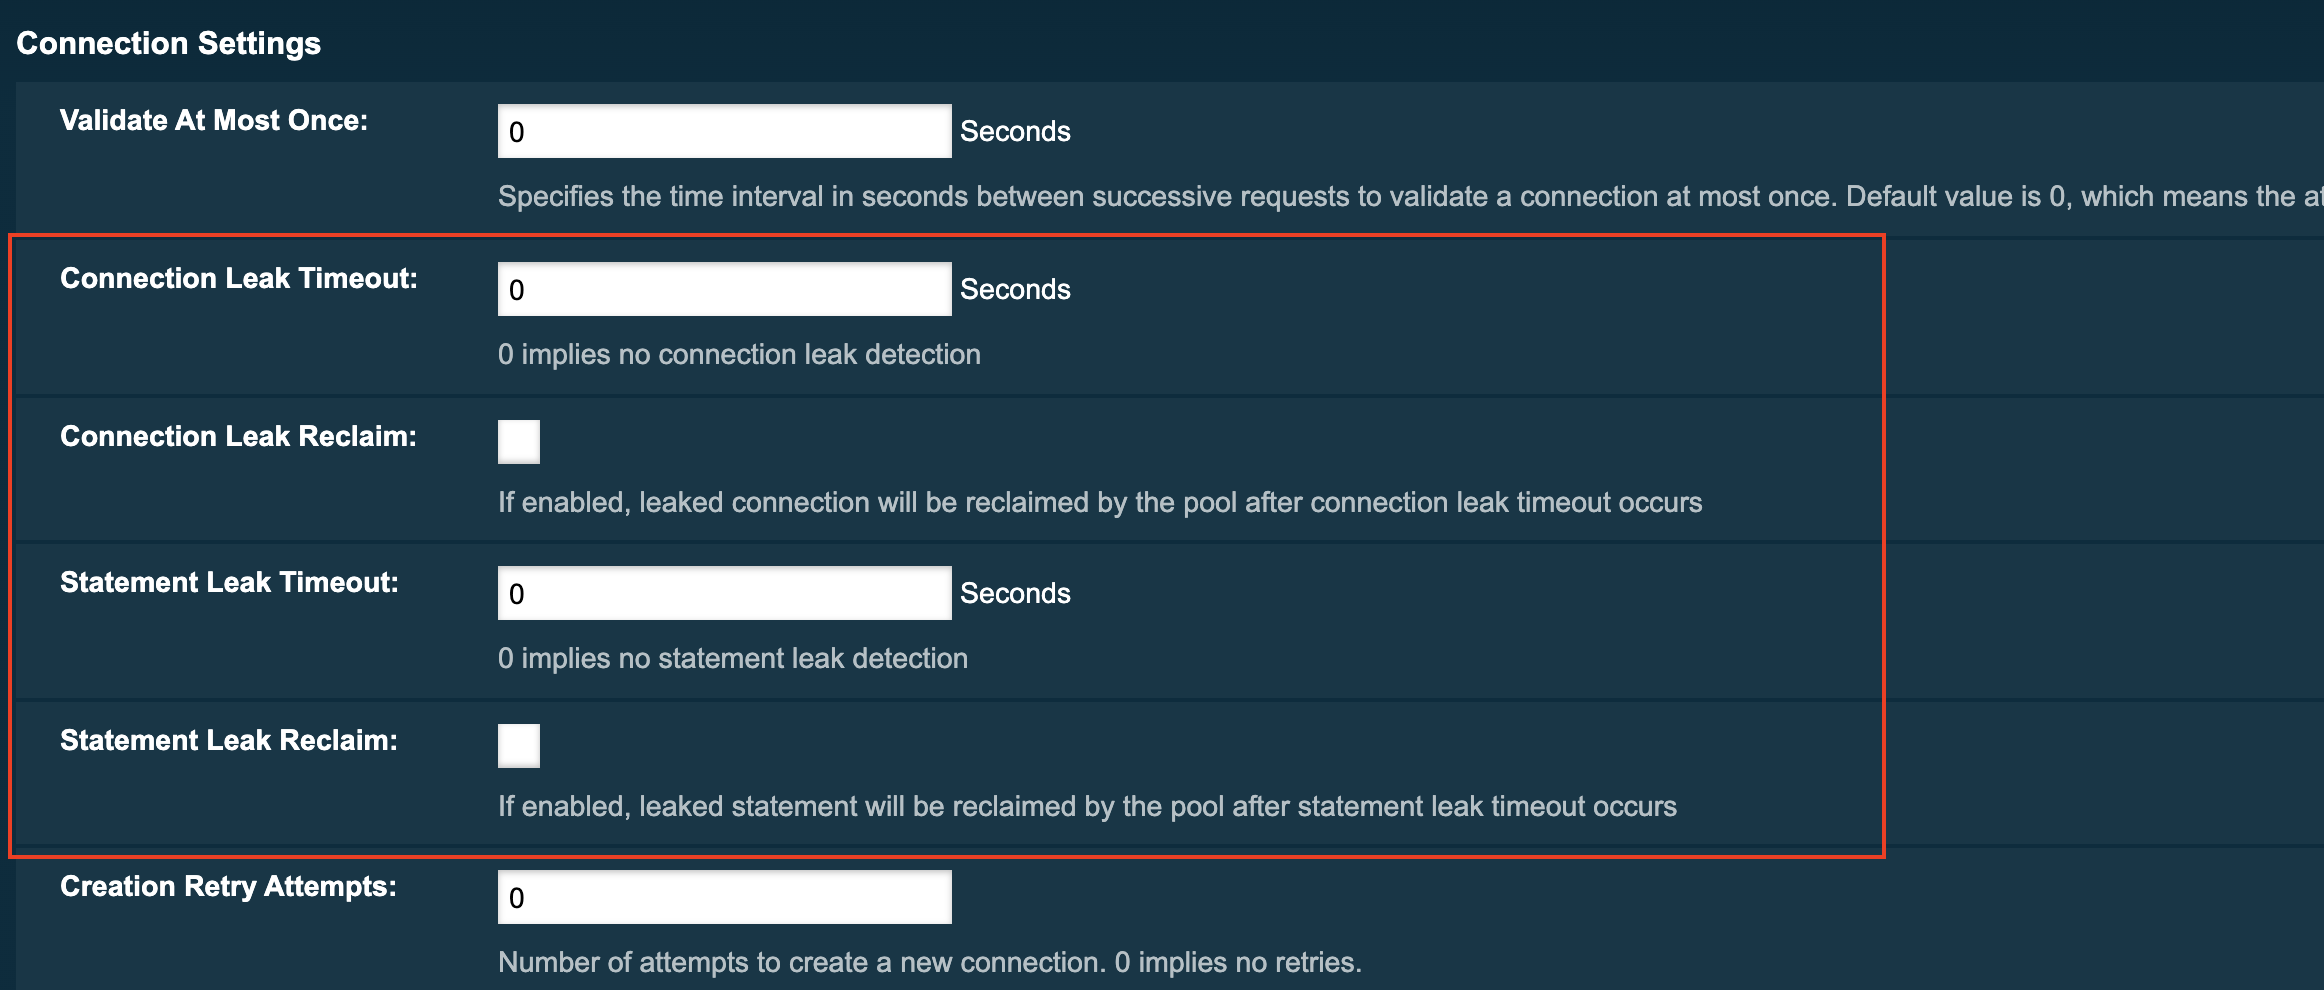
This feature allows you to set specific time-outs so that if SQL statements or JDBC connections haven’t been closed by an application (potentially leading to a memory leak) they can be logged and/or closed.
By default these values are set to 0 meaning this detection feature is turned off.
| When working on a test or staging environment, it is recommended that leaks are logged after a short timeout but not closed. On production environments, it is recommended that leaks are closed and all logged leaks are monitored instead. |
Configuring Leak Detection using the admin console
-
Click on the name of the JDBC connections pool
-
Select the Advanced tab
-
Scroll down to Connection Settings
-
Set the Connection Leak Timeout and Statement Leak Timeout value in seconds

Configuring Leak Detection using administration commands
You also can set the time-out values using the following asadmin commands:
asadmin> set resources.jdbc-connection-pool.test-pool.statement-leak-timeout-in-seconds=5
asadmin> set resources.jdbc-connection-pool.test-pool.connection-leak-timeout-in-seconds=5
You can turn on reclaiming of the leaking resources with the following commands:
asadmin> set resources.jdbc-connection-pool.DerbyPool.connection-leak-reclaim=true
asadmin> setresources.jdbc-connection-pool.DerbyPool.statement-leak-reclaim=true
Once these values are set, if connection or statement leaks are detected, you will see messages similar to the example below in the application log:
WARNING: A potential connection leak detected for connection pool test-pool. The stack trace of the thread is provided below:
 ...