Many performance problems in Enterprise Applications can be traced to slow database access. Payara Server Community includes capabilities to detect and log slow SQL queries executed via a JDBC Connection pool. The Slow SQL logger monitors all queries executed on the connection pool and if they exceed a configurable execution time in seconds a warning message is logged into the server log.
The warning message (see below) logs the SQL query and the stack trace to the code executing the query. This enables rapid diagnosis by pinpointing the exact lines of code to investigate.
Configuring the Slow SQL Logger
Ensure Wrap JDBC Objects is enabled in your JDBC Connection Pool (enabled by default) for the Slow SQL Logger to function correctly.
There are a number of ways to configure the slow SQL threshold time on a JDBC connection pool.
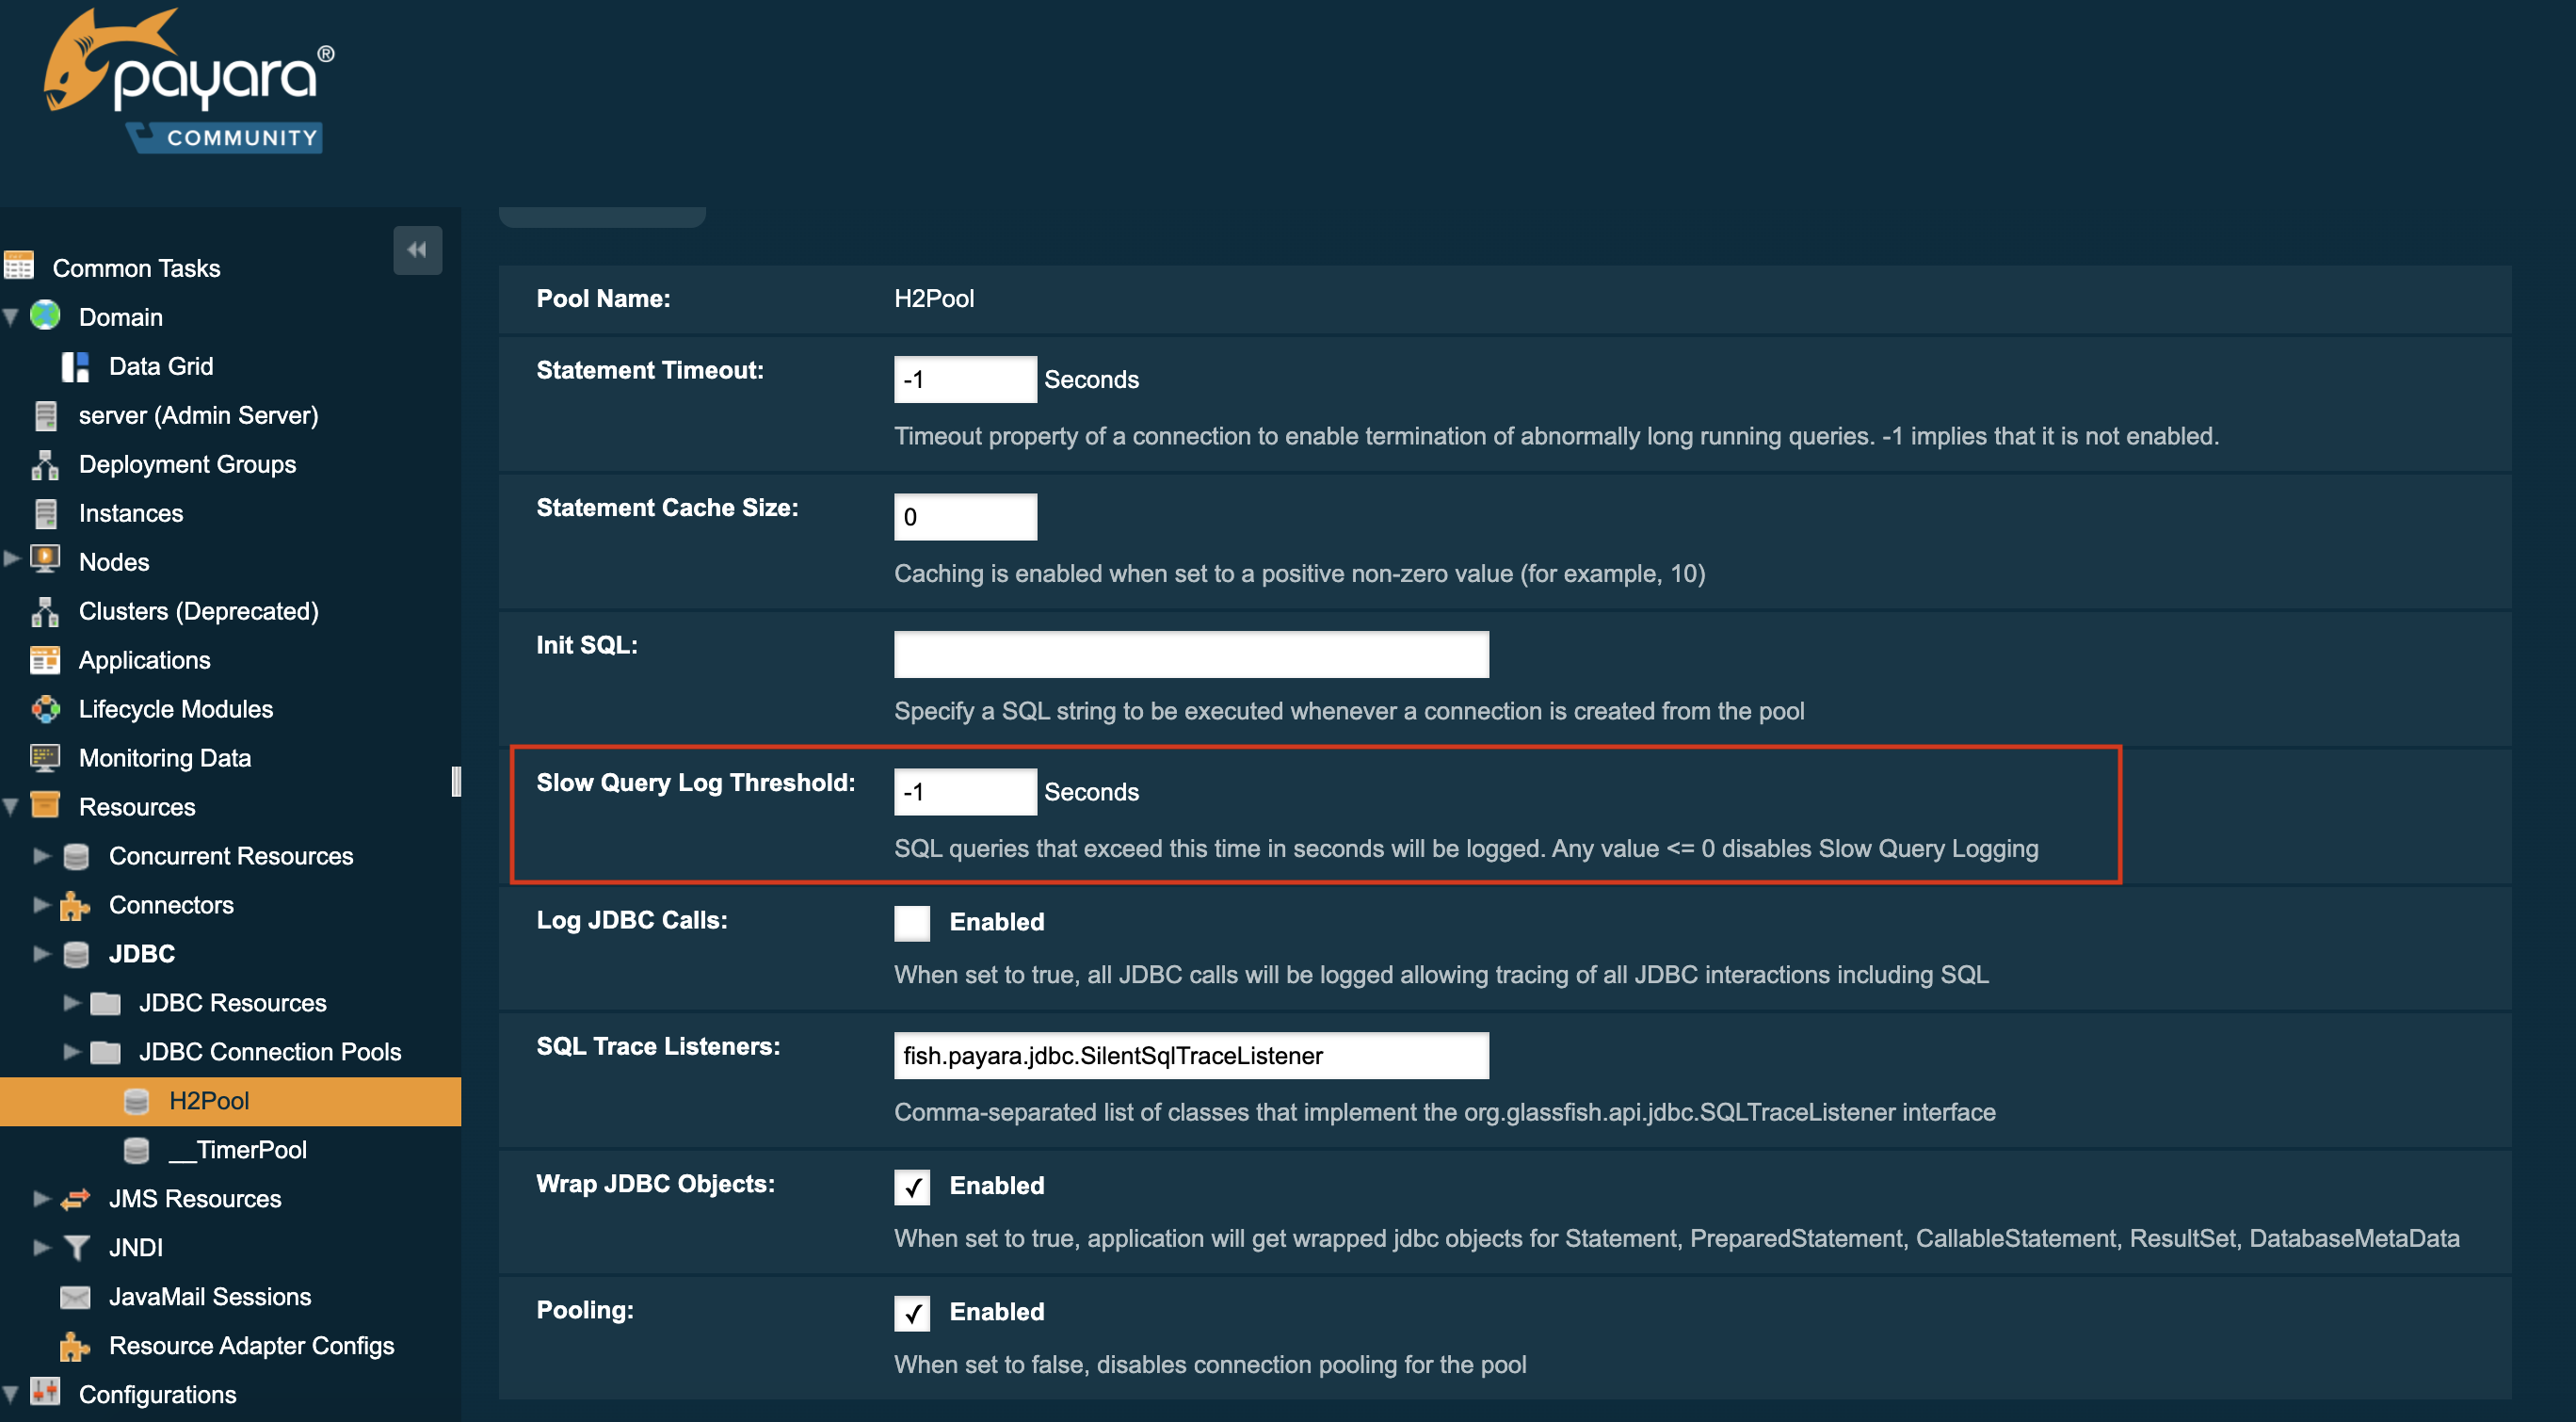
Using the Administration Console
To configure slow SQL logging on a JDBC connection pool via the administration console, navigate to the Connection Pool’s Advanced Properties tab. Then specify the Slow Query Log Threshold time in seconds or use a decimal value to signify milliseconds. The value -1 disables the feature:
Using Asadmin commands
The Slow Query Log Threshold time for a JDBC connection pool can also be
configured with an asadmin command, by using the set command to set the
slow-query-threshold-in-seconds property, like in the following example:
asadmin set domain.resources.jdbc-connection-pool.__TimerPool.slow-query-threshold-in-seconds=50You can also set the threshold time to milliseconds simply by passing a
decimal value. Below is a example of setting the threshold on the
__TimerPool JDBC connection pool to 200 milliseconds:
asadmin set domain.resources.jdbc-connection-pool.__TimerPool.slow-query-threshold-in-seconds=0.2Application Deployment
In Java EE 7 applications, a JDBC data source can be deployed by adding the
@DataSourceDefinition annotation to a managed component (like and @Stateless
EJB bean for example). The Slow Query Log Threshold time can be configured
using this annotation, like in the following example:
@DataSourceDefinition(
    name = "java:app/MyApp/MyDS",
    className = "org.h2.jdbcx.JdbcDataSource",
    url = "jdbc:h2:mem:test",
    properties = {"fish.payara.slow-query-threshold-in-seconds=5"})
The Data source definition can also be added to a deployment descriptor of an application, for example in the web.xml standard deployment descriptor:
<data-source>
    <name>java:global/ExampleDataSource</name>
    <class-name>com.mysql.jdbc.jdbc2.optional.MysqlXADataSource</class-name>
    <server-name>localhost</server-name>
    <port-number>3306</port-number>
    <database-name>mysql</database-name>
    <user>test</user>
    <password>test</password>
    <!-- Example of how to use a Payara specific custom connection pool setting -->
    <property>
       <name>fish.payara.slow-query-threshold-in-seconds</name>
       <value>5</value>
    </property>
</data-source>
Example Trace
Below is an example WARNING trace for a slow query recollected from the
server’s log:
[#|2016-02-01T22:39:29.289+0000|WARNING|Payara 4.1|javax.enterprise.resource.sqltrace.com.sun.gjc.util|_ThreadID=61;_ThreadName=http-listener-1(2);_TimeMillis=1454366369289;_LevelValue=900;|
  SQL Query Exceeded Threshold Time: 5000(ms): Time Taken: 10000(ms)
Query was SELECT ID, AGE, BIO, BIRTHDATE, BIRTHDAY, DATEFORMAT, DATEOFBIRTH, DATEOFHIRE, EMAIL, HIREDATE, HIREDAY, MEMBERAGE, NAME, TODAYSDATE FROM MEMBERENTITY WHERE (NAME = ?);

java.lang.Exception: Stack Trace shows code path to SQL
    at fish.payara.jdbc.SlowSQLLogger.sqlTrace(SlowSQLLogger.java:123)
    at com.sun.gjc.util.SQLTraceDelegator.sqlTrace(SQLTraceDelegator.java:122)
    at com.sun.gjc.spi.jdbc40.ProfiledConnectionWrapper40$1.invoke(ProfiledConnectionWrapper40.java:448)
    at com.sun.proxy.$Proxy265.executeQuery(Unknown Source)
    at org.eclipse.persistence.internal.databaseaccess.DatabaseAccessor.executeSelect(DatabaseAccessor.java:1009)
    at org.eclipse.persistence.internal.databaseaccess.DatabaseAccessor.basicExecuteCall(DatabaseAccessor.java:644)
    at org.eclipse.persistence.internal.databaseaccess.DatabaseAccessor.executeCall(DatabaseAccessor.java:560)
    at org.eclipse.persistence.internal.sessions.AbstractSession.basicExecuteCall(AbstractSession.java:2055)
    at org.eclipse.persistence.sessions.server.ServerSession.executeCall(ServerSession.java:570)
    at org.eclipse.persistence.internal.queries.DatasourceCallQueryMechanism.executeCall(DatasourceCallQueryMechanism.java:242)
    at org.eclipse.persistence.internal.queries.DatasourceCallQueryMechanism.executeCall(DatasourceCallQueryMechanism.java:228)
    at org.eclipse.persistence.internal.queries.DatasourceCallQueryMechanism.executeSelectCall(DatasourceCallQueryMechanism.java:299)
    at org.eclipse.persistence.internal.queries.DatasourceCallQueryMechanism.selectAllRows(DatasourceCallQueryMechanism.java:694)
    at org.eclipse.persistence.internal.queries.ExpressionQueryMechanism.selectAllRowsFromTable(ExpressionQueryMechanism.java:2740)
    at org.eclipse.persistence.internal.queries.ExpressionQueryMechanism.selectAllRows(ExpressionQueryMechanism.java:2693)
    at org.eclipse.persistence.queries.ReadAllQuery.executeObjectLevelReadQuery(ReadAllQuery.java:559)
    at org.eclipse.persistence.queries.ObjectLevelReadQuery.executeDatabaseQuery(ObjectLevelReadQuery.java:1175)
    at org.eclipse.persistence.queries.DatabaseQuery.execute(DatabaseQuery.java:904)
    at org.eclipse.persistence.queries.ObjectLevelReadQuery.execute(ObjectLevelReadQuery.java:1134)
    at org.eclipse.persistence.queries.ReadAllQuery.execute(ReadAllQuery.java:460)
    at org.eclipse.persistence.queries.ObjectLevelReadQuery.executeInUnitOfWork(ObjectLevelReadQuery.java:1222)
    at org.eclipse.persistence.internal.sessions.UnitOfWorkImpl.internalExecuteQuery(UnitOfWorkImpl.java:2896)
    at org.eclipse.persistence.internal.sessions.AbstractSession.executeQuery(AbstractSession.java:1857)
    at org.eclipse.persistence.internal.sessions.AbstractSession.executeQuery(AbstractSession.java:1839)
    at org.eclipse.persistence.internal.sessions.AbstractSession.executeQuery(AbstractSession.java:1804)
    at org.eclipse.persistence.internal.jpa.QueryImpl.executeReadQuery(QueryImpl.java:258)
    at org.eclipse.persistence.internal.jpa.QueryImpl.getResultList(QueryImpl.java:473)
    at fish.payara.team.info.controllers.MemberSessionBean.getTeamMemberByName(MemberSessionBean.java:35)
Payara Micro Support
Payara Micro Community also supports slow logging of SQL queries which brings powerful operational diagnostics to your micro-services platform. To enable it on applications deployed on Payara Micro, use the annotation or deployment descriptor methods described in the previous section.