An instance of CDI Probe is attached to each application in CDI Development Mode and is available at the context root of the application suffixed by path /weld-probe. For example, http://localhost:8080/cargo-tracker/weld-probe .
Access from Admin Console
Once CDI Development Mode is enabled for an application, the Edit Application page in the Admin Console provides a link to open the CDI Probe web application.
You can find the link called CDI Probe in the Modules and Components table, in the Action column:
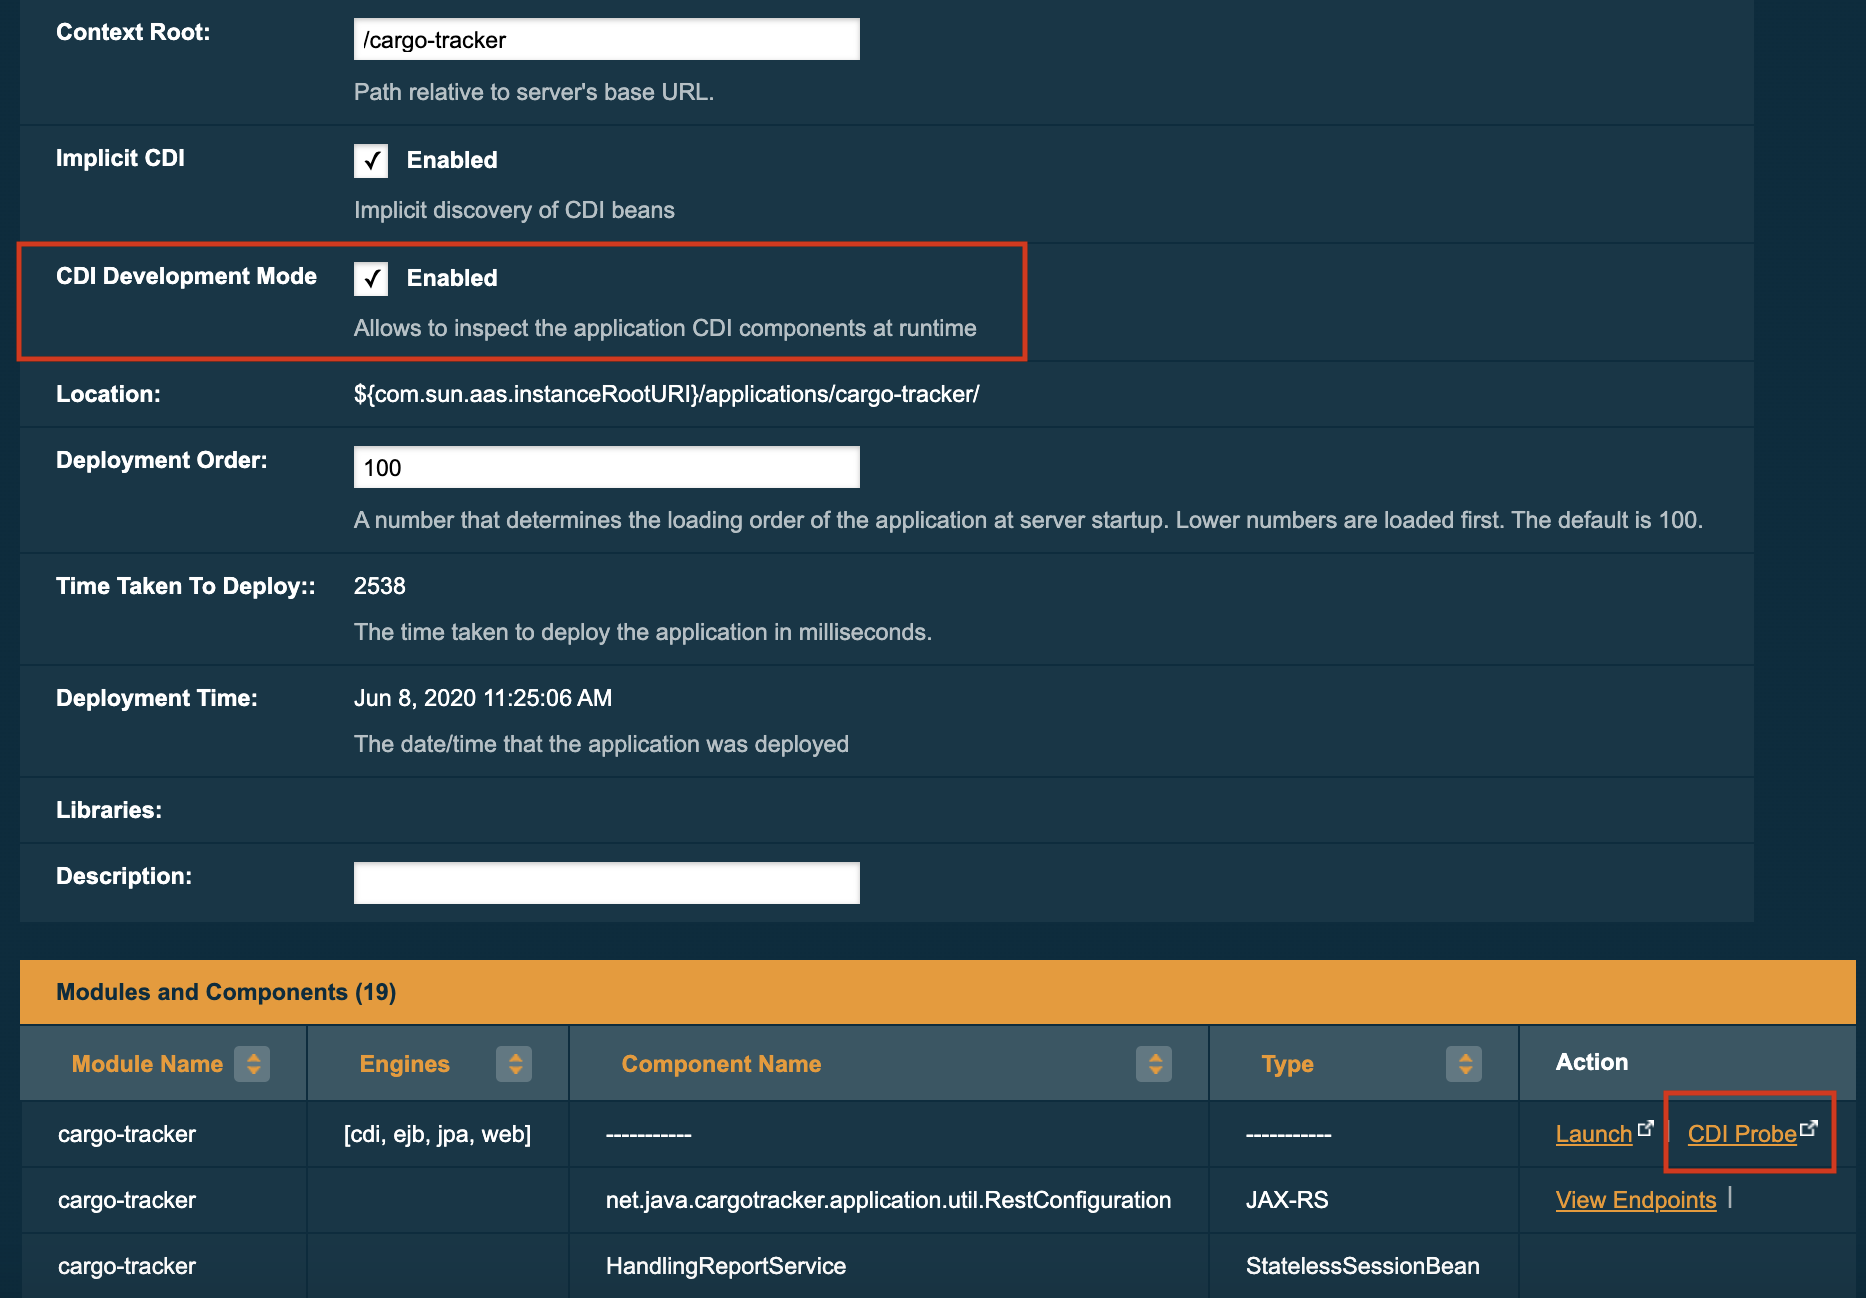
It may happen that the CDI Probe link isn’t visible if the CDI Development Mode checkbox on this page isn’t checked. If the development mode is enabled by other means, the CDI Probe is still accessible. Either check the CDI Development Mode checkbox and press Save or access CDI Probe directly by adding /weld-probe to the URL of your application.
|
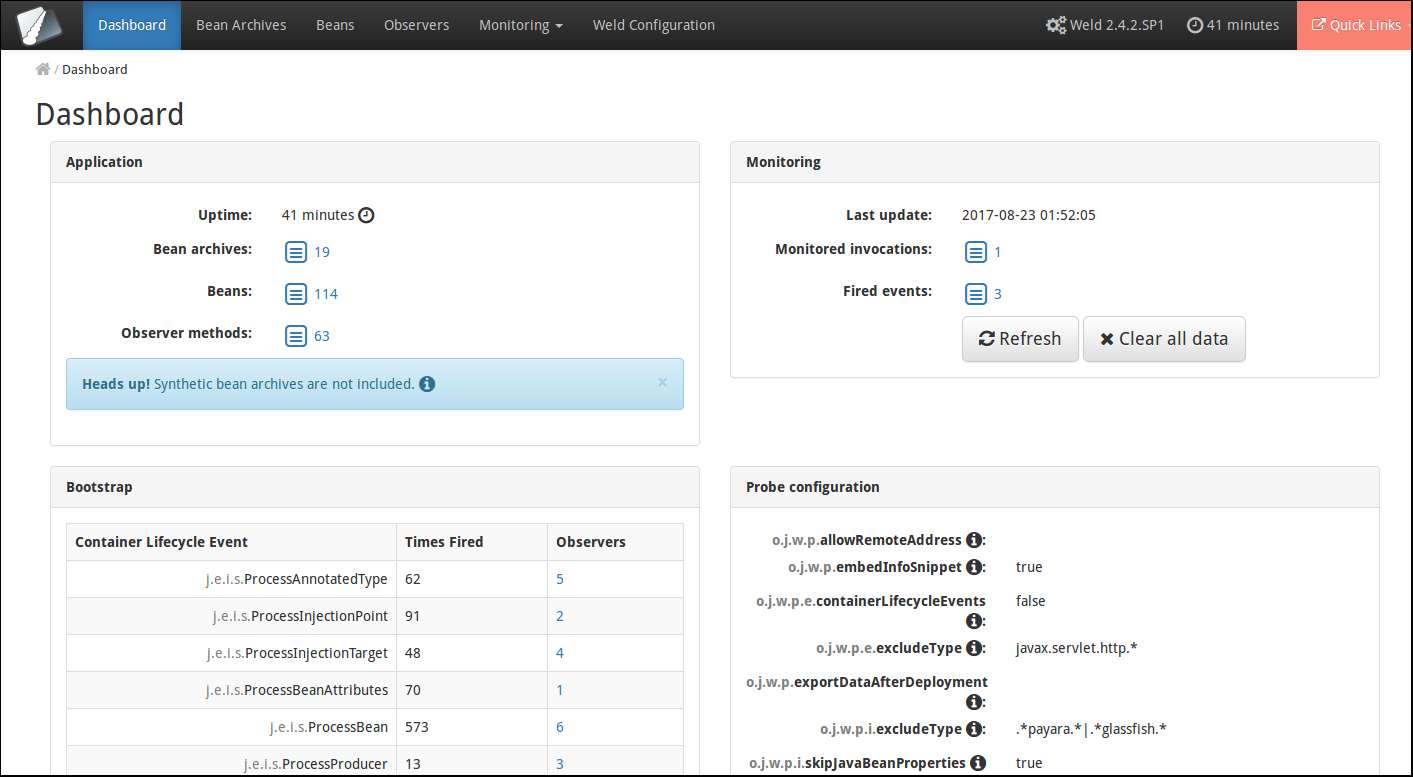
The CDI Probe link will open a new window, which will open the CDI Probe web application:
Access from application page
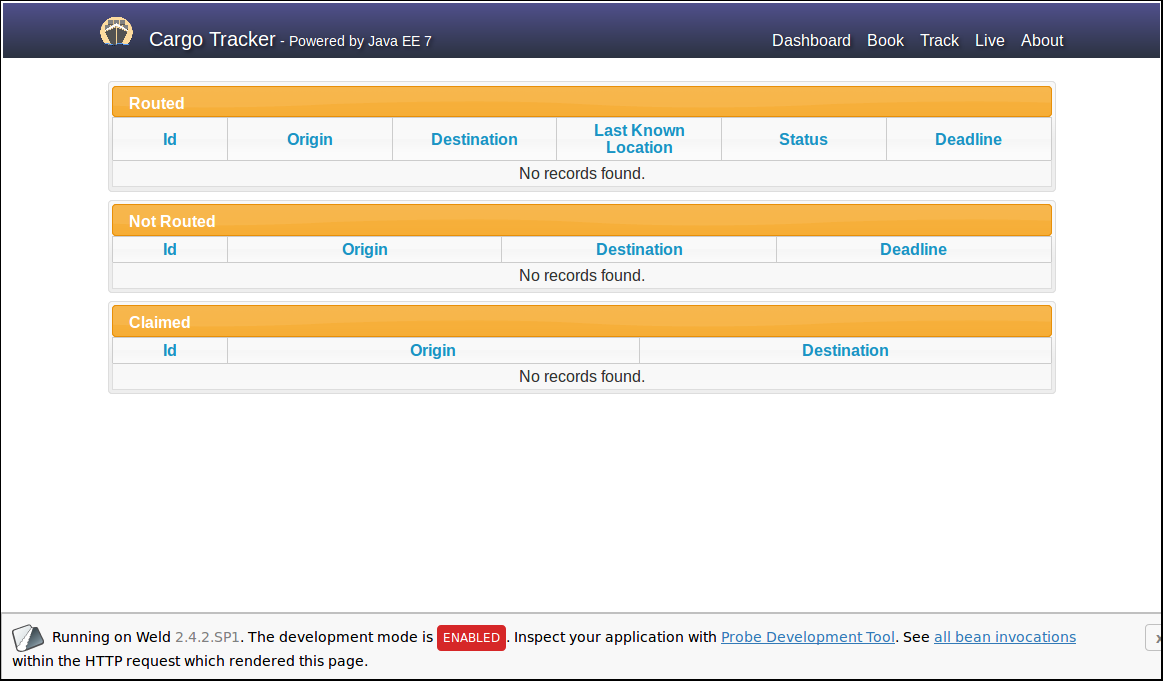
If your application serves web pages, you can also access the CDI Probe web application from the toolbar that is added by the CDI Development Mode at the bottom of every web page. Below is an example what the toolbar looks like in a sample Cargo Tracker application:
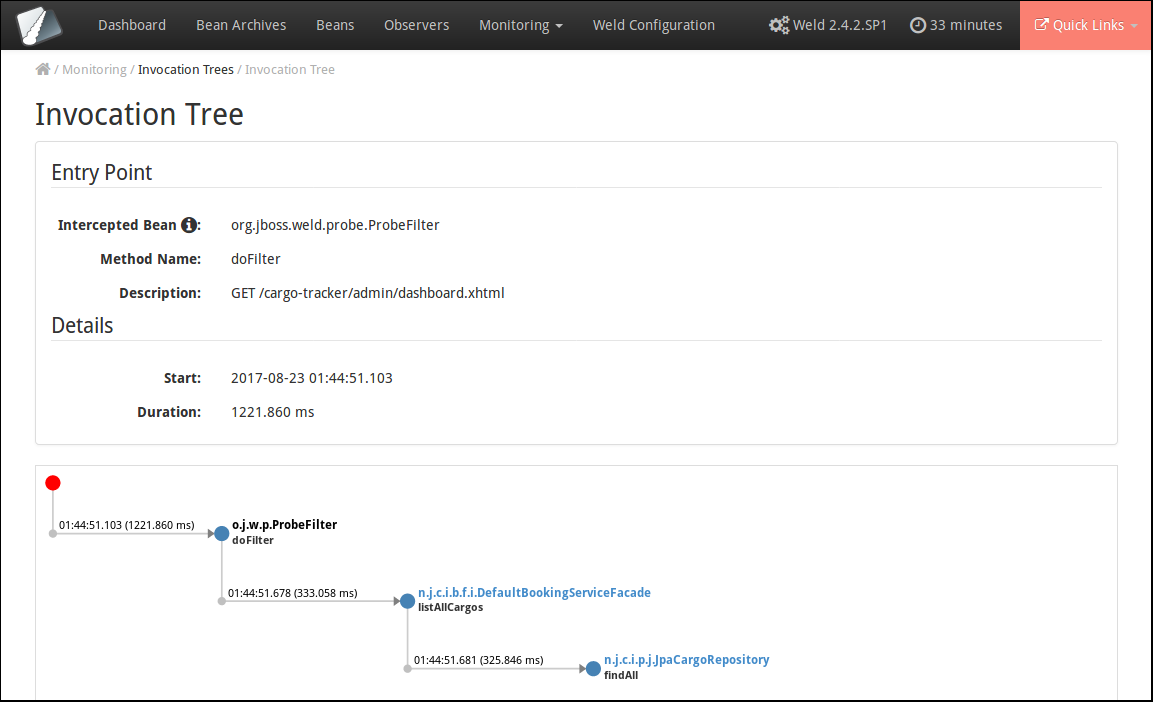
If the application used some CDI beans during processing of the HTTP request, the toolbar will also contain a link to see all bean invocations as a tree of events, which may look like this: