Monitoring Console
The monitoring console module collects a multitude of metrics from all nodes and accumulates the data on the DAS. This can include user defined metrics. The data is visualised by the monitoring console web-application that for the time being is installed on the DAS explicitly like any normal web-application.
| Please be aware that following details reflect the current state of a evolving product that are likely to change in the future. |
Installation
To start the monitoring console run the following asadmin command:
asadmin> set-monitoring-console-configuration --enabled=true
The console is now available at http://localhost:8080/monitoring-console/ . Like the admin GUI the monnitoring console only runs on the DAS.
To stop the monitoring console run:
asadmin> set-monitoring-console-configuration --enabled=false
| The monitoring console feature is only contained in Payara Server distribution. |
Enabling Data Collection
The collection of monitoring data gets enabled and disabled in connection with the general configuration: Monitoring ⇒ Monitoring Service ⇒ Enabled
To remove only the monitoring data collection from the server without disabling the monitoring service itself delete the monitoring-console-core.jar from the /glassfish/modules folder of your installation(s) and restart the server.
|
Graphical User Interface
After enabling the monitoring console open the home page at /monitoring-console/.
The console comes with a set of preconfigured pages each focussing on a different aspects of the server.
The console will let you know that some metrics are only available when the monitoring configuration of certain server parts is set to HIGH.
|
Pages
The monitoring console is organized in fully customisable pages. A page is a collection of widgets arranged in columns. Usually pages are focussed on visualising metrics of a specific area of the server, like HTTP or request tracing. The monitoring console has preconfigured pages as a starting point that can be changed and extended by the user. New custom pages can be created.

Changing Page Layout
Each page uses a column layout of 1-4 columns. The number of columns for a page can be changed using top right Layout menu.
Changing the column layout of a page does not change the preferred position of the widgets. If a widget is set to column 3 but a 2-column layout is used all widgets of the 3rd or 4th column get pushed to the 2nd column instead. This allows switching layouts without redoing the configuration entirely.
Changing Page Update Interval
By default the graphs on a page update every 2 seconds. To control the interval use top right Data Refresh menu or open the Settings and change the interval in the Global settings.
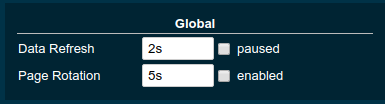
The interval can be paused and continued without changing the interval duration by using the paused checkbox next to the interval setting.
Adding Pages
To add a new page use the top right Page menu and select New….
This creates a new Unnamed page which can be renamed in the Page settings.
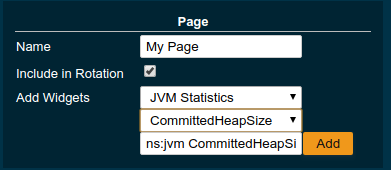
After naming the page add widgets.
Deleting a Page
To delete a page open top right Page menu, select Delete and confirm the browser confirmation dialogue.
| Pages that are based on a preset cannot be deleted. They can only be reset to default preset configuration. |
Reset a Page
When the configuration of a preconfigured page or any of the widgets on it was changed by the user the page can be reset by selecting Reset from the top right Page menu.
| The reset will affect all widgets and the general page settings of the currently shown page. All changes made by the user will be overridden. |
To reset all pages and remove all user created pages clear the browser’s local storage for the monitoring console page.
Widgets
Widgets are the components that can be placed on a page to show a particular metric. While there are different types of widgets usually a widget shows a line graph of one or more metrics for the entire cluster.
Adding a Widget
Widgets can be added to any page. Open the side panel by clicking on Settings top right menu. Use the dropdown in the Add Widgets property of the Page settings to select the category of the metric to add. This populates the second dropdown with all metrics for that category. Select a metric from the second dropdown to prefill the widget series name field below and press the Add button.
When added, widgets are automatically placed in a column so that they are evenly distributed on the page. Use the side panel widget settings to change column, span or item position of the widget or use the quick menu for the widget by clicking the cog symbol in the top right corner of the widget and select the action you want to apply to the widget.
| The widget series name field allows you to enter the name manually for advanced use cases or in case a metric is not available now but known to become available at some point. See Series with Wildcards for more details. |
Configuring a Widget
To configure a widget select it by clicking on its title (light blue background in image below).
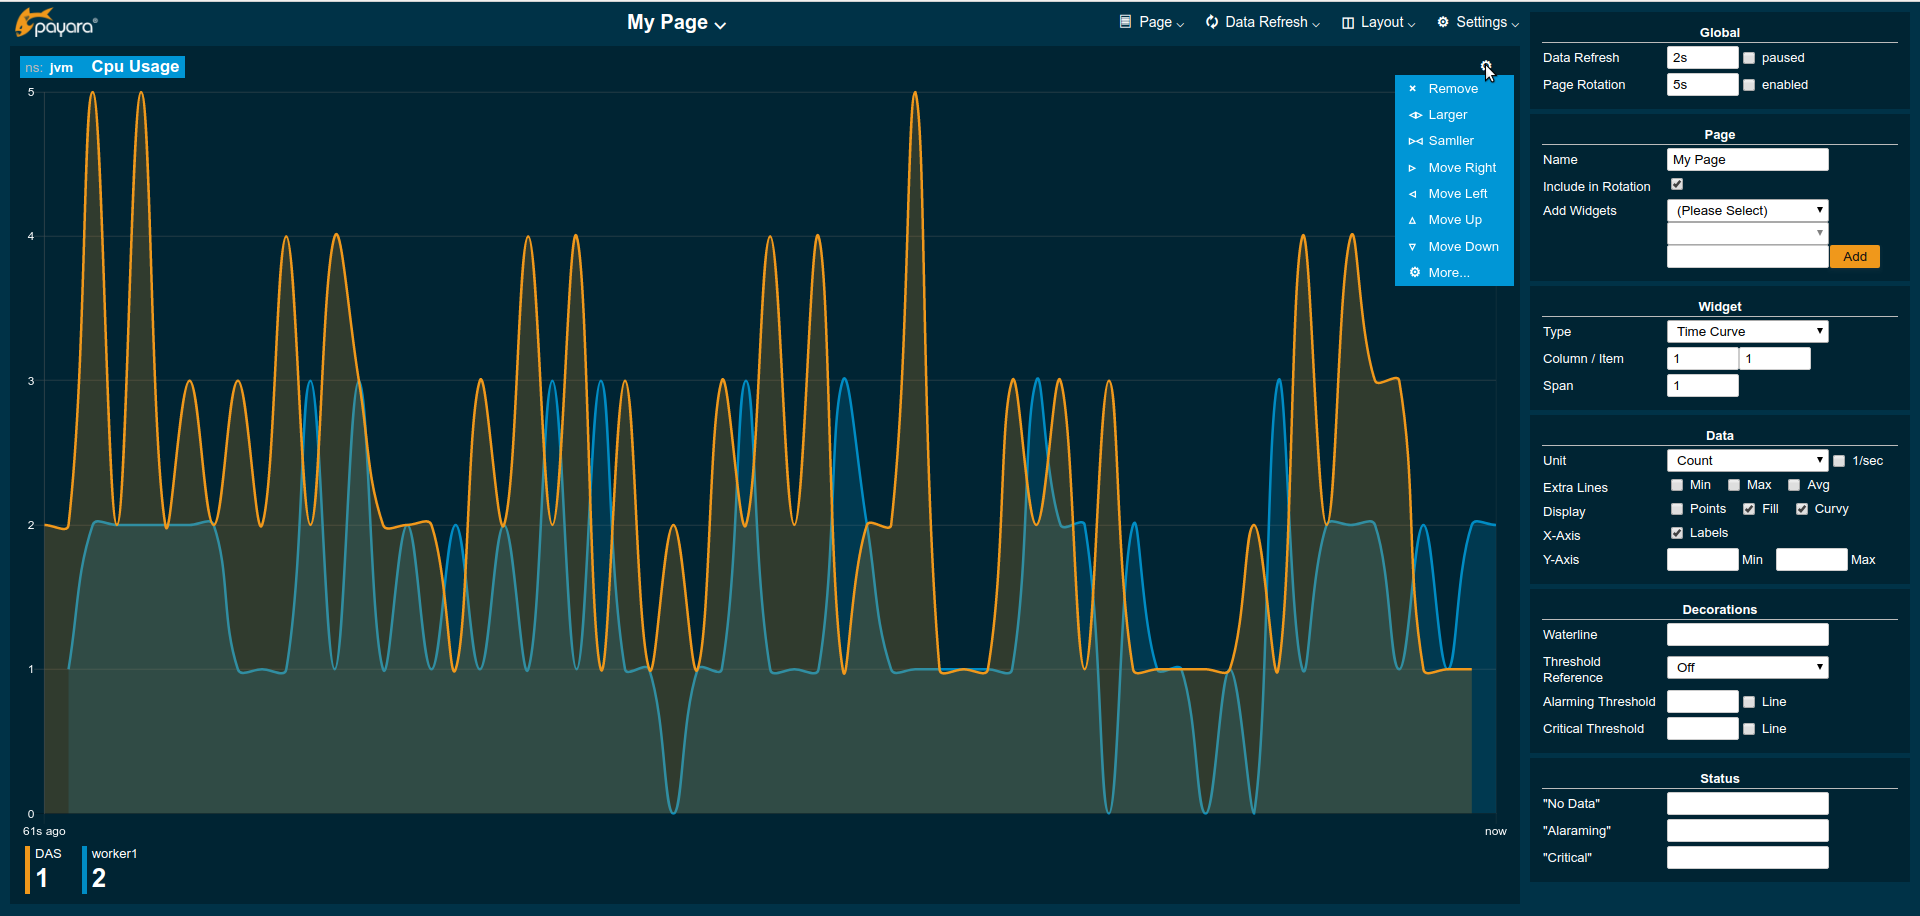
This opens the side panel and shows the detail configuration of the widget. The side panel can be closed by either deselecting the widget, by clicking on its title again, or by clicking the Settings menu or its Hide item.
| If the settings have been opened explicitly through the Settings menu an empty selection will not close the settings side panel. |
The Widget settings are concerned with the widgets position within the page.
| Property | Default | Description |
|---|---|---|
Display Name |
(undefined) |
Optional name to customise the displayed widget title. If no name is given the Data Series is shown. |
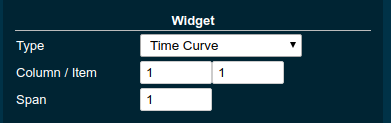
Type |
|
Changes the type of the graph used to show the metric. This also affects which data of the metric the widget is focussed on. |
Column |
1 |
The column in the layout the widget prefers to be in. |
Item |
1 |
Within columns widgets are sorted by their item value, lowest values first. The item position is automatically updated during page layout should it be needed. |
Span |
1 |
How many columns and rows the widget should span. |
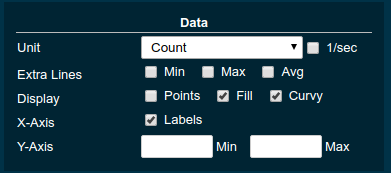
The Data settings are concerned with what and how the data is shown in the graph of a widget.
| Property | Default | Description |
|---|---|---|
Series |
- |
The metric key given when adding the metric (read-only) |
Unit |
|
The unit controls how the raw number of a metric is interpreted and represented e.g. when displaying in axis labels. The unit also controls what values are accepted as input for numbers, like thresholds, that are on the same axis. Possible units are: |
Unit 1/sec |
|
Whether or not to show the metric as change per second (delta between two points in the series normalised to average delta per second). |
Upscaling |
(undefined) |
When defined all values are multiplied by this factor. This can e.g. be used to move a decimal range between zero and one to a percentage range 0-100. |
Upscaling decimal value |
|
Check to mark the metric as one that is provided as a decimal value during collection (floats or doubles and alike). This will then revert the conversion applied during collection which converts decimal values to an integer number with 4 available decimal digits by multiplying them by 10,000. So this divides values by 10,000 again to move them back into their original value range. |
Extra Lines |
(none) |
Check to add the all time minimum, maximum or average line to the graph |
Display |
Fill, Curvy |
Options on how to display the current value line in the graph: With Points marked, with Fill under the area between line and axis and whether or not to use curves to draw the line. |
X-Axis |
Labels |
Whether or not to show labels for the x-axis. |
Y-Axis |
(undefined) |
Set a minimum or maximum number for the y-axis instead. When not set range is derived automatically from the data points. |
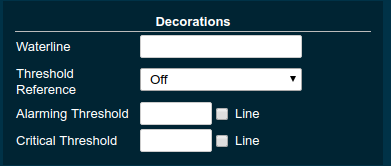
Configuring Widget Decorations
Decorations are visual helpers that can be added to a graph of a widget in order to make it easier to for the user to quickly understand the data displayed. In particular these are reference lines.
| Property | Default | Description |
|---|---|---|
Waterline |
(undefined) |
Adds a simple reference line that could mark a upper or lower limit. Enter in unit of y-axis, e.g. 20ms, 5s, 2GB, 4%, 123 |
Threshold Reference |
|
Controls what value the Alarming Threshold and Critical Threshold are compared to. Usually this is the most recent value but in some cases the all time minimum, maximum or average are useful too. |
Alarming Threshold |
(undefined) |
The limit for the "Alarming" state. If Critical Threshold is undefined or if it’s value is larger than this value the alarming threshold is exceeded if the reference value is larger than the threshold. Otherwise, if the Critical Threshold is lower than the Alarming Threshold, the threshold becomes 'inverse', and is exceeded when the reference value falls below the arlarming value. When exceeded the status becomes "Alaraming". Enter in unit of y-axis, e.g. 20ms, 5s, 2GB, 4%, 123 |
Critical Threshold |
(undefined) |
The limit of the "Critical" state. If Alarming Threshold is undefined or it’s value is smaller than this value the critical threshold is exceeded if the reference value is larger then the threshold. Otherwise, if the Critical Threshold is lower than the Alarming Threshold, the threshold becomes 'inverse', and is exceeded when the reference value falls below the critical value. When exceeded the status becomes "Critical", overrides staus "Alarming". Enter in unit of y-axis, e.g. 20ms, 5s, 2GB, 4%, 123 |
Besides adding a reference line to the graph the critical and alarming thresholds affect the status evaluation.
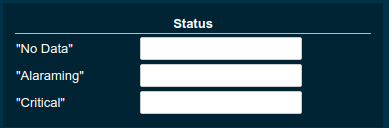
Configuring Widget Status Messages
The current value of a metric can automatically be categorised as a certain status. For example based on the threshold values of decorations or by encountered errors or missing data. The Status settings allows to set a custom message for a particular status.
| Property | Default | Description |
|---|---|---|
"No Data" |
(undefined) |
The message to show when no data for a metric is available. For example to hint about configurations needed to make the metric available. |
"Alarming" |
(undefined) |
The message to show when the threshold got exceeded and the status evaluates to Alarming. |
"Critical" |
(undefined) |
The message to show when the threshold got exceeded and the status evaluates to Critical. |
The messages support simple markup using *bold* and _italic_.
Removing a Widget
Any widget can be removed from any page. Click the cog symbol in the top right of the widget, select Remove and confirm the browser dialog.
Remember that a page originating from a preset can be reset to recover a widget that was removed accidentally.
Using Advanced Data Series
A series is a name or key for a particular metric shown in a widget. Each metric has a unique key or series name. Usually these names use tags to categorise metrics into groups. For example:
ns:jvm MetricName
ns:jvm @:groupName MetricName
The patterns shown above exemplify conventions used throughout Payara monitoring console.
The first grouping level usually is the ns (short for namespace), the second the @ (short for group).
In the example the metrics belong to the jvm namespace and the groupName group within that namespace.
When metrics are selected using the dropdowns these details are filled in for the user by selecting items from the dropdowns.
Alternatively a user may chose to enter the series key manually which allows to use a wild-card * instead of either a tag value (like jvm) or the MetricName. For example:
ns:jvm @:* Duration
This will then match all existing series that match the pattern. This feature can be used to automatically show all metrics of a certain pattern in a single widget as it is done by the request tracing page.
Global Configurations
Currently the configuration that controls the monitoring console UI is only stored in the browser’s local storage. It can be exported and imported in the form of JSON files to share or distribute configurations.
Export Configuration
A configuration contains all pages. All changes made to a page or widget setup are contained in this configuration. To download this configuraton as JSON file select Export from the Settings top right menu.
Import Configuration
To import a previously exported JSON file select Import in the top right Settings menu and select the JSON file to import. This feature can be used to version and distribute configurations for similar installations.
| Importing files will override any changes made to pages existing in both the current configuration and the imported file. Importing pages will not remove pages that are not contained in the imported file. |
Page Rotation
Monitoring console is built with the intention of being used to display metrics on status monitors. To allow viewing a variety of pages and their metrics on a single screen the pages can be automatically rotated showing each page for a configured interval duration.
To enable page rotation open the Settings and check the enabled checkbox in the Global Settings Page Rotation property. This starts the rotation immediately.
The duration can be adjusted changing the text field of the Page Rotation to another time value. Use units to express the duration, as for example: 1min, 30sec.
Changes take effect immediately.
The rotation will show each page for the configured duration. Pages can be excluded from rotation by switching to the page using the page menu. Open the Settings and uncheck the Include in Rotation checkbox in the Page settings.
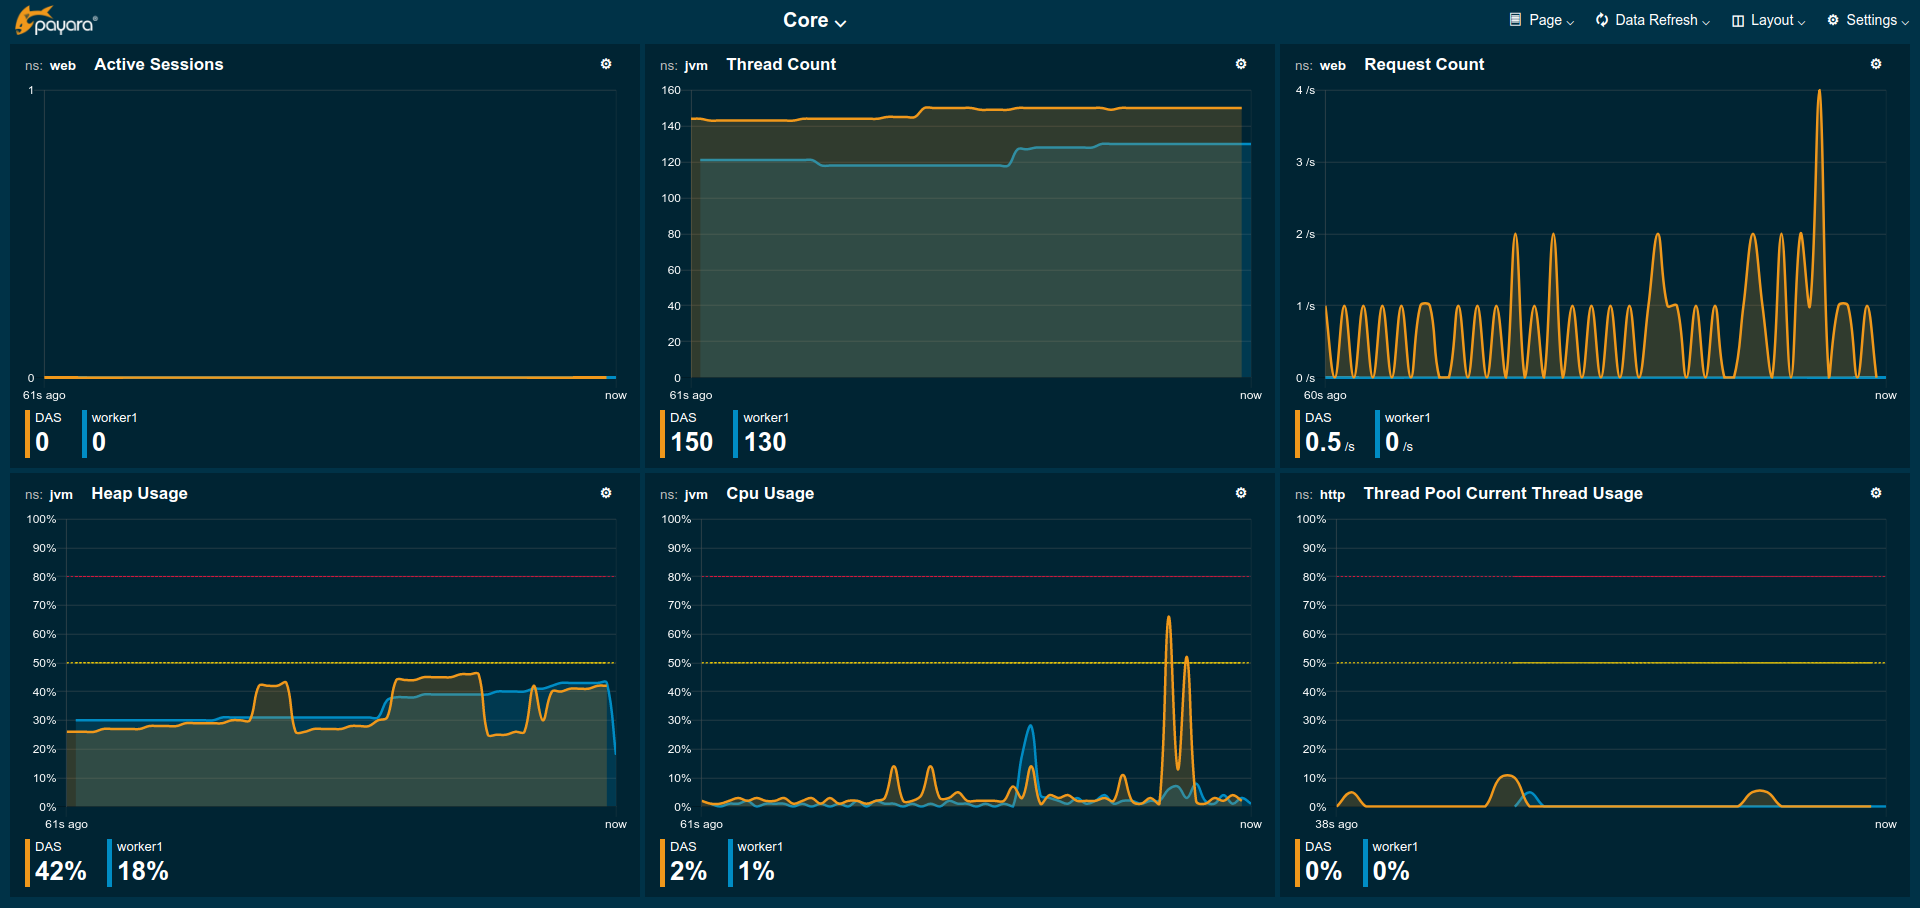
Preconfigured Pages
Core
The Core page gives an overview over some of the important instance metrics. Each instance in the grid is shown separately.
-
Active Sessions: Total number of active session for the instance.
-
Thread Count: Total number of threads used by the instance.
-
Request Count: Number of HTTP request per second processed by the instance.
-
Heap Usage: Percentage of the current instance maximum heap memory already used.
-
CPU Usage: Percentage CPU usage by the instance (not the machine but the process).
-
Thread Pool Current Thread Usage: Percentage of HTTP thread pool threads currently in use by the instance.
HTTP
The HTTP page gives a rough overview over the state of the HTTP services of each instance.
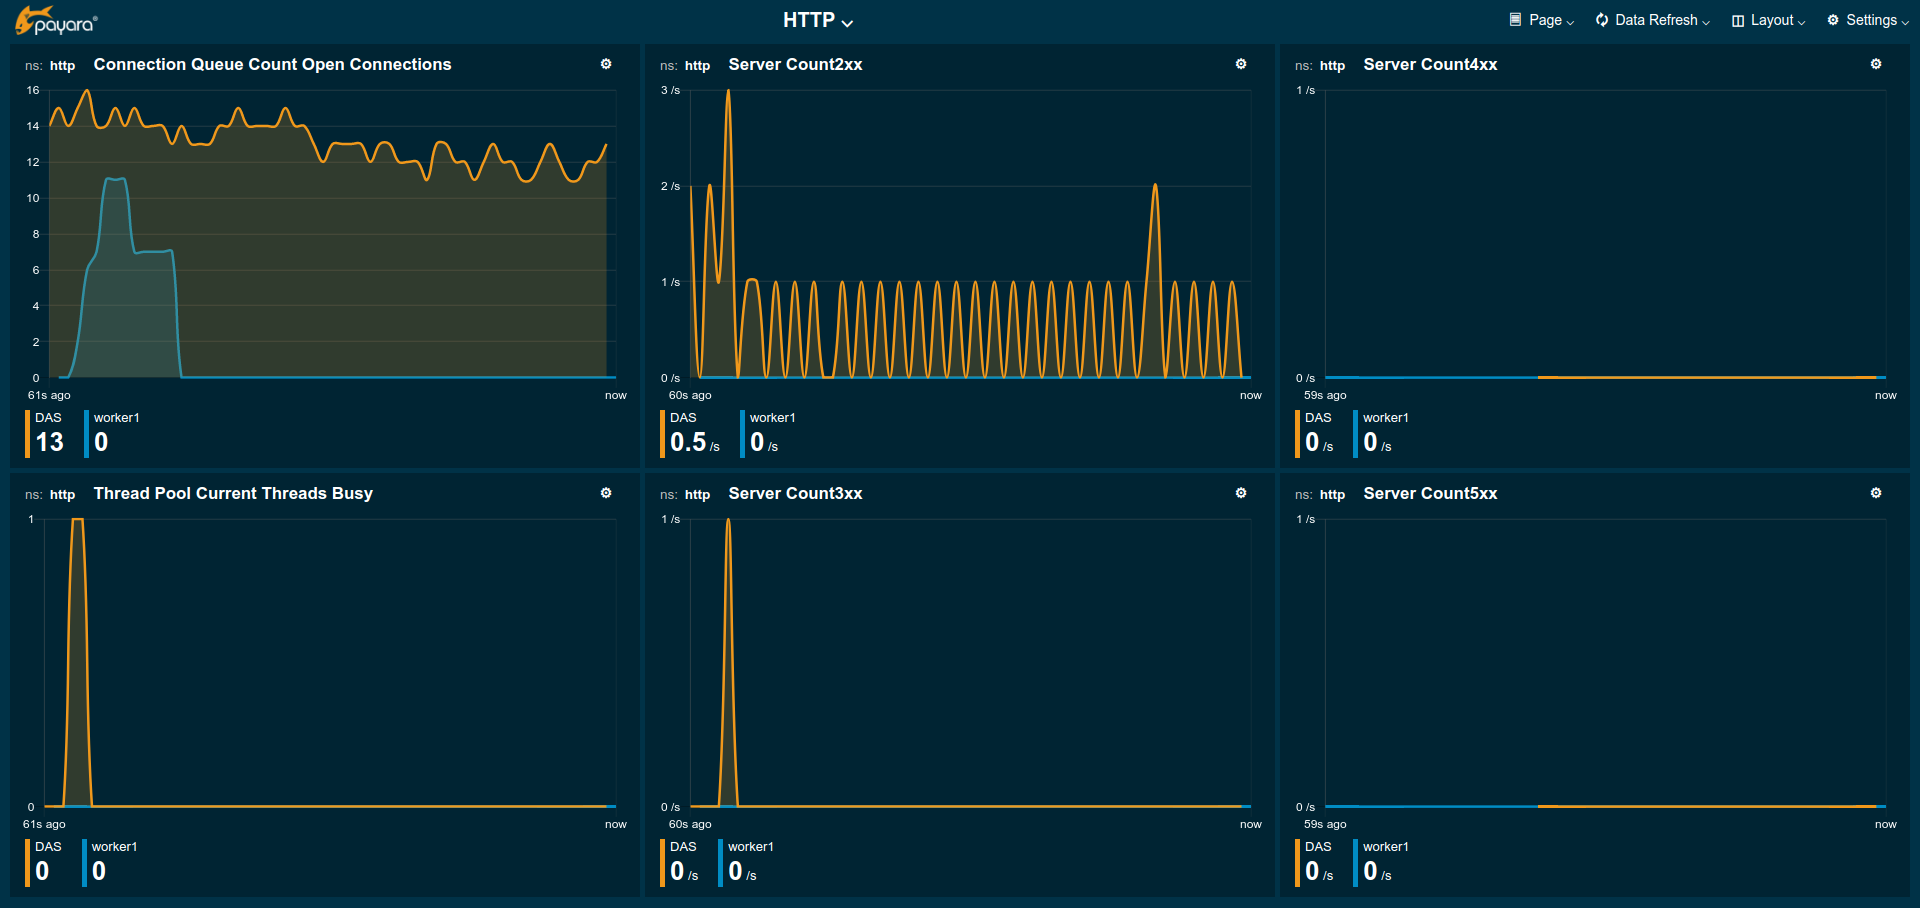
-
Connection Queue Count Open Connections: Total number of open connection in the connection queue
-
Thread Pool Current Threads Busy: Number of threads in the HTTP thread pool currently processing a HTTP request.
-
Server Count2xx: Requests per seconds and instance responding with Success.
-
Server Count3xx: Requests per seconds and instance responding with Redirection.
-
Server Count4xx: Requests per seconds and instance responding with Client Error.
-
Server Count5xx: Requests per seconds and instance responding with Server Error.
Request Tracing
The Request Tracing page overview page shows traces that exceeded the set threshold.
| If this page does not show any data, no request has exceeded the threshold or the request tracing has not been enabled. Check Configuration ⇒ Request Tracing. |
All traces for the same method are shown as a single bar. The length and position of the bar gives the range of total trace duration for all the occurrences that exceeded the threshold. The bar starts at the minimum duration observed and ends at the maximum duration observed in the last minute. The legend shows the average duration and the method traced (innermost trace span operation)
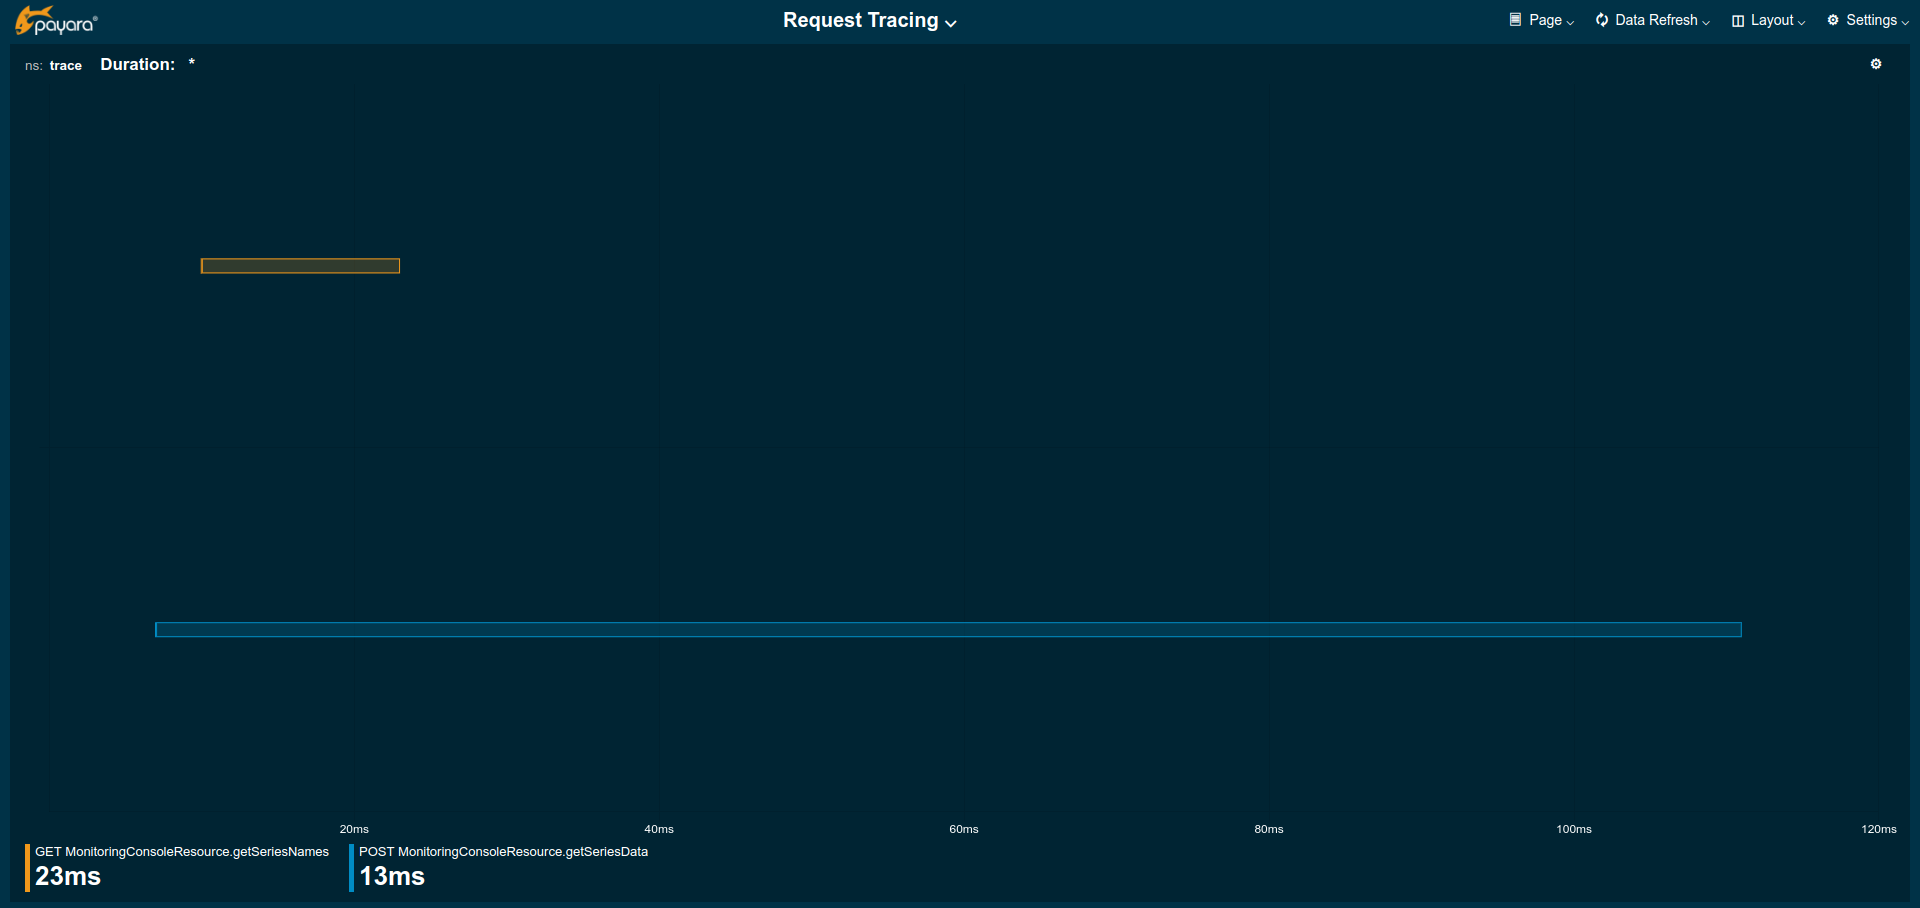
When all time minimum and/or maximum are added in the Widget Data settings the bar starts and/or ends at these "all time" values instead of the minumum and/or maximum within the last minute.
By clicking on one of the bars in the overview the details of all kept traces for this method can be viewed. This data corresponds to the traces stored in the trace-store. For each trace each of the spans corresponds to a bar in this graph.
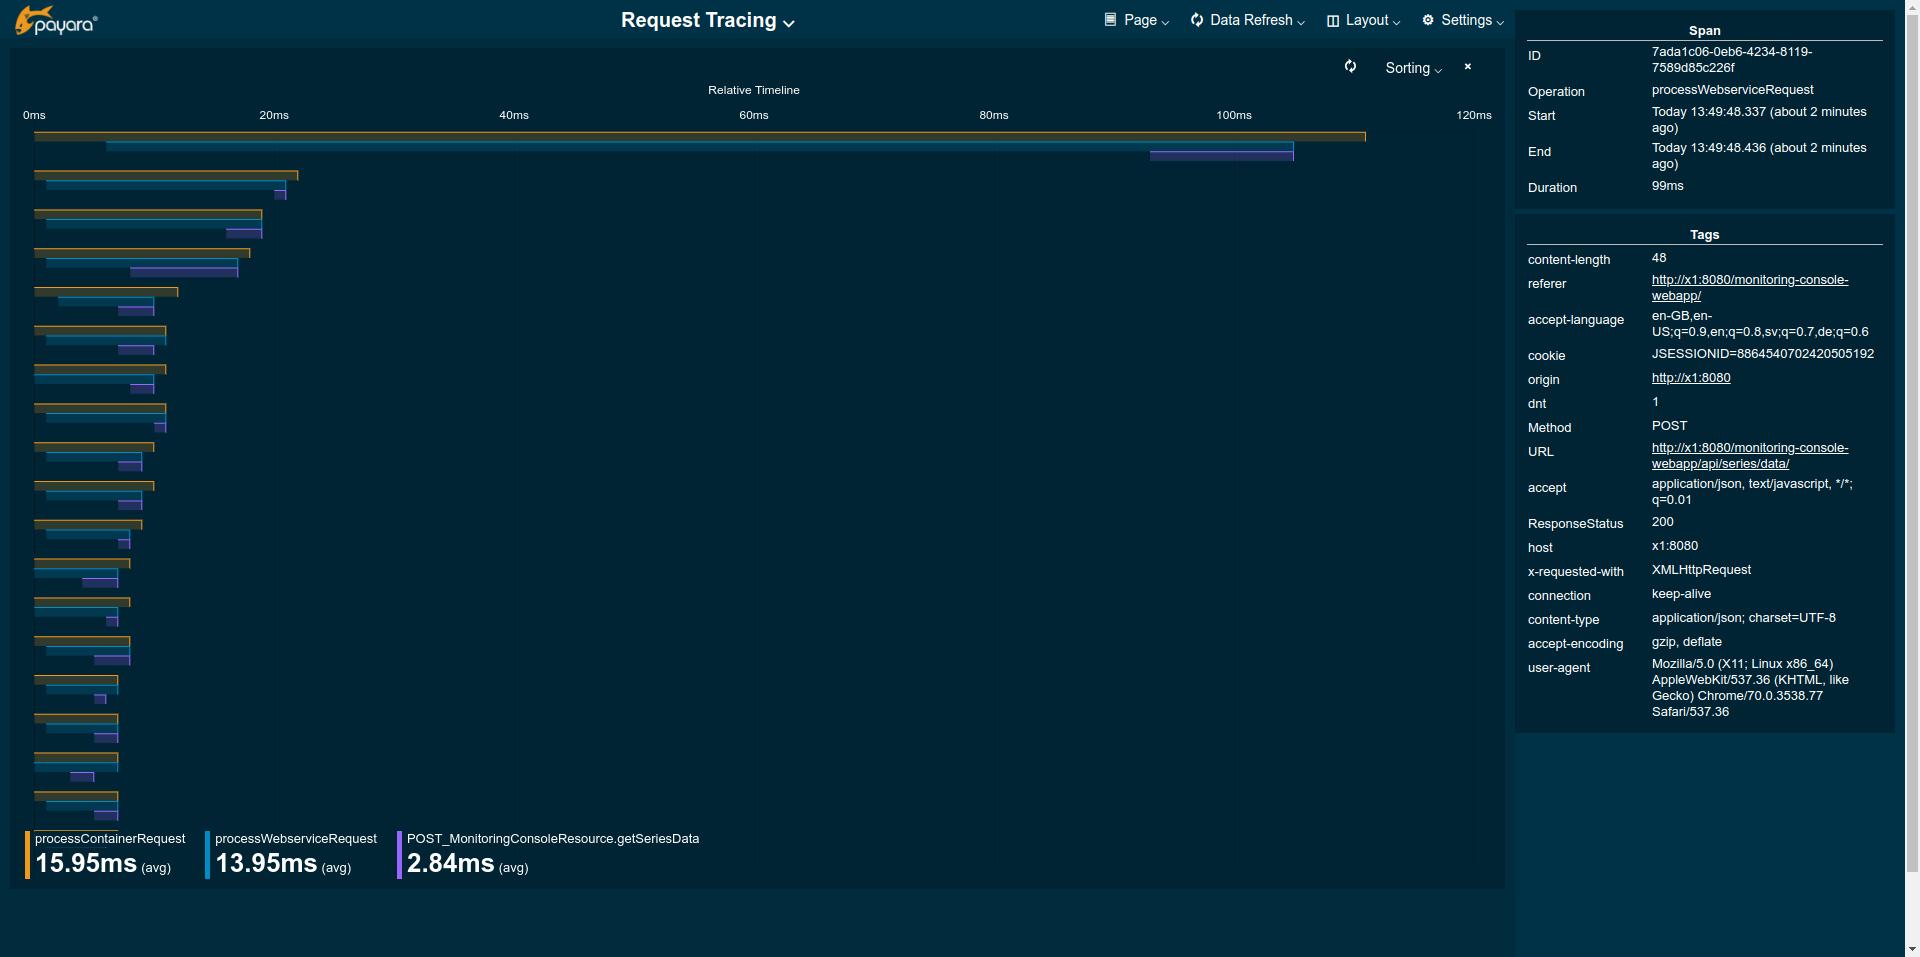
By default the traces are sorted longest (slowest) to shortest (fastest) total duration. On the time axis the spans are shown relative to the start of the trace.
When the side panel is opened the details of each trace span can be viewed by clicking on the span bar.
The legend gives average durations for each of the spans occurring for the traced method.
| The detail view does not automatically refresh. To refresh click the refresh icon next to the Sorting menu in the top right of the widget. |
The spans can be sorted by wall time by selecting Sort by Wall Time or by duration by selecting Sort By Duration in the Sorting menu in the top right of the widget.
To get back to the overview close the details by clicking the x-icon on the right side of the Sorting menu.
| Be aware that the graphs in the example images above show unrealistically low numbers due to the way that request tracing was configured. In a more realistic configurations the durations are more likely to be in range of few hundred milliseconds to some seconds. |
User Defined Metrics
Payara monitoring console is build with the intention to allow user defined metrics to be visualised. So far these include the MicroProfile Metrics that might originate from deployed application and other extensions of the server. These are included in the available metrics automatically.
Open the Settings and look for MP Metrics in the topmost dropdown for the Add Widgets property in the Page settings.
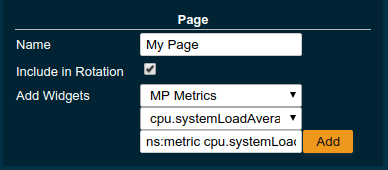
The metrics found in the second dropdown originate from existing MicroProfile Metrics defined in the server.
Eventual MP tags used become the @ group of the shown series key, the MP metric stays the metric name.